FVG fill with immediate rebalance [LuciTech]The "FVG fill with immediate rebalance AKA Golden Arrow" indicator is designed to identify Fair Value Gaps (FVGs) and detect immediate rebalances to highlight potential trading opportunities. It uses colored boxes to mark FVGs and triangular markers to signal bullish or bearish setups, helping traders pinpoint key price levels where imbalances occur and price reactions are likely.
Key Features
FVG Detection: Spots bullish and bearish Fair Value Gaps based on price action, with customizable width settings.
Golden Arrow Signals: Displays triangular markers when price fills an FVG and immediately rebalances, indicating potential reversal or continuation zones.
Customizable Colors: Bullish FVGs appear in green and bearish FVGs in red by default, with options to tweak colors in the settings.
Time Filter: Allows signals to be restricted to a specific time window, highlighted by a background fill for clarity.
Alert System: Supports TradingView alerts for "Bullish Golden Arrow" and "Bearish Golden Arrow" signals to keep traders updated on setups.
How It Works
FVG Calculation: Analyzes gaps between candles to identify FVGs, with user-defined minimum width options (points, percentages, or ATR-based).
Signal Generation: Triggers a Golden Arrow signal when price fills the FVG and rebalances immediately, based on wick penetration and closing conditions.
Visual Aids:
Bullish FVGs are shown as green boxes, bearish FVGs as red boxes.
Upward triangles mark bullish signals, downward triangles mark bearish signals.
Time-Based Filtering: Optionally limits signals to specific hours, with a background fill showing the active period.
Cerca negli script per "imbalance"

cd_cisd_market_CxHi Traders,
Overview:
Many traders follow market structure to identify the market direction and seek trade opportunities in line with the trend.
However, markings derived from user-defined inputs can create different structures, depending on personal choices. For instance, choosing a pivot distance of 3 instead of 2 alters the structure, even though the chart remains the same. Ideally, the structure should remain consistent.
"Change in State Delivery" ( CISD ) is a widely accepted concept among traders and is considered a significant indicator of market direction based on the gain/loss of CISD levels.
In this indicator, CISD is selected as the primary criterion for marking market structure, eliminating the influence of user-dependent variations.
Here is a summary of the key logic and rules applied:
• When the price forms a new high/low, that level is only considered a pivot if a CISD has occurred.
• A bullish CISD is always followed by a bearish CISD, and vice versa.
• Pivot points form the internal structure.
• The internal structure is used to interpret the swing structure.
• Probabilities are derived from internal structure patterns.
________________________________________
Details:
How is CISD determined?
As is commonly known:
• When price makes a new high, the opening level of the first candle in the consecutive bullish candle sequence is marked.
• When price makes a new low, the opening of the first candle in the consecutive bearish sequence is marked.
• If there’s only one candle in the sequence, its opening level is used.
In a bullish market, losing a bearish CISD level (i.e., a close below it) or in a bearish market, gaining a bullish CISD level (i.e., a close above it) is interpreted as a potential shift in buyer-seller dominance and a possible market reversal.
________________________________________
How are internal (pivot) levels determined?
• When price closes below a bearish CISD level, the highest candle's high becomes a pivot high (PH).
• When price closes above a bullish CISD level, the lowest candle's low becomes a pivot low (PL).
• If the new PH is above the previous PH, it’s labeled as HH (Higher High); otherwise, LH (Lower High).
• If the new PL is below the previous PL, it’s labeled as LL (Lower Low); otherwise, HL (Higher Low).
________________________________________
Internal Market Structure:
• A series of HHs indicates a bullish internal structure.
• A series of LLs indicates a bearish internal structure.
________________________________________
Swing (Main) Market Structure:
Using internal pivots and previous swing levels, the main market structure is derived.
• A new swing high (SH) requires the price to move above the previous SH.
• A new swing low (SL) requires the price to move below the previous SL.
________________________________________
Probability Calculation:
Pivot levels forming the internal structure are coded as five-element sequences.
There are 64 possible combinations of such sequences made from consecutive PH and PL values.
Each pattern’s frequency from its starting candle is tracked.
To make it more understandable:
For example, after the four-sequence “HH, LL, LH,HL”, either HH or LH might follow.
The table shows the statistical likelihood of both possible outcomes for the most recent four-element sequence on the chart.
________________________________________
How reliable is it?
To assess reliability, results are calculated from the beginning using:
Success Rate (Suc. Rt) = Number of Correct Predictions / Total Predictions
This value is added to the table for reference.
It’s important to note that no statistical outcome guarantees certainty—every result offers a different interpretation. What truly matters is to avoid getting stopped out 😊.
________________________________________
Menu Options:
Show/hide preferences and color selections can be customized via the indicator menu.
________________________________________
What’s Coming in Future Versions?
Features such as FVG (Fair Value Gaps) between swing levels, volume imbalances, order blocks / mitigation blocks, Fibonacci levels, and relevant trade suggestions will be added.
________________________________________
This is a BETA version that I believe will help simplify your market reading. I’d be happy to hear your feedback and suggestions.
Cheerful Trading!

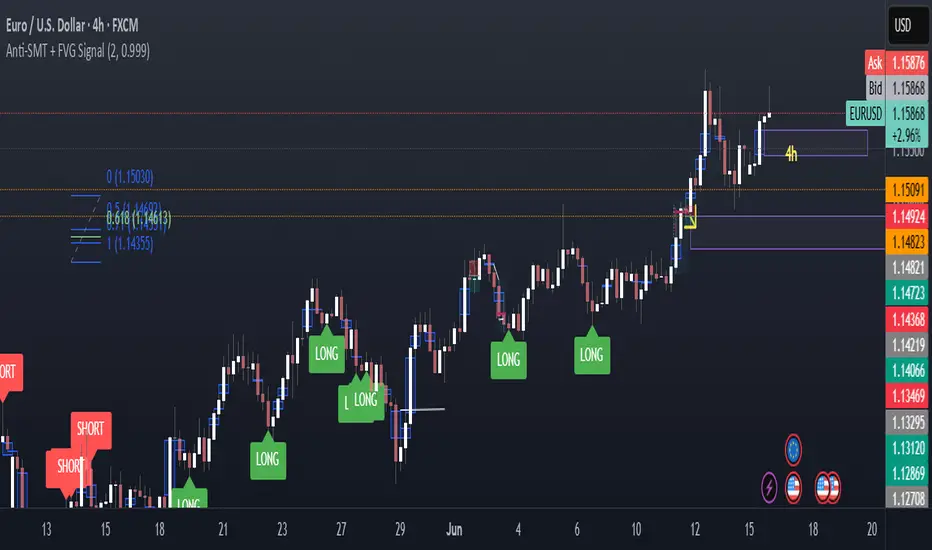
Anti-SMT + FVG SignalMade by Laila
Anti-SMT + FVG Strategy
A contrarian price-action strategy that combines SMT illusion with Fair Value Gap (FVG) confirmation and multiple filters.
Strategy Concept
This strategy challenges traditional SMT divergence logic. Instead of entering trades based on expected SMT divergence between correlated pairs (e.g., EURUSD and DXY), it assumes the divergence is false and will reverse. The concept is to take advantage of these false signals, also known as "SMT illusions."
To confirm the setup, the strategy integrates Fair Value Gaps (FVGs), which are price imbalances left unfilled between candle 1 and 3.
Anti-SMT Logic
Short Entry:
EURUSD makes a new high (Candle 1)
DXY does not make a new low
Long Entry:
EURUSD makes a new low (Candle 1)
DXY does not make a new high
This divergence is considered false, and the strategy expects a reversal.
Fair Value Gap (FVG) Confirmation
A trade is only triggered if the price touches a Fair Value Gap during:
Candle 1 (the candle that forms the SMT illusion), or
Candle 2 (entry confirmation)
This helps avoid low-quality setups and increases entry precision.
Additional Filters
To improve robustness and prevent overfitting, the strategy includes:
EMA Trend Filter:
Long entries are allowed only if price is above the 50 EMA
Short entries are allowed only if price is below the 50 EMA
Time Filter:
Trades are only permitted between 08:00 and 18:00 UTC
Cooldown Filter:
A minimum of 10 candles between trades is required to prevent overtrading
Strategy Parameters and Defaults
Optimized for EURUSD on the 4-hour (4H) timeframe
Includes realistic commission and slippage
Uses conservative position sizing (e.g., 1% per trade)
Backtesting over hundreds of trades shows approximately 57% win rate under default conditions
These results are historical and do not guarantee future performance
Purpose and Value
This strategy offers a structured and logical approach to contrarian trading by:
Introducing the concept of false SMT divergence
Using price inefficiencies (FVGs) as confirmation
Filtering trades with realistic and widely accepted conditions
Encouraging quality over quantity through strict entry rules
It is not a simple mashup but a well-defined trading system that blends institutional concepts in a usable framework.
S&P Power Hour Liquidity Sweep StrategyThis indicator is designed for intraday traders who want to take advantage of liquidity grabs, break of structure (BOS), and optimal entry points during the most volatile hours of the trading day: the NYSE Power Hours (09:30–10:30 AM and 02:30–04:00 PM EST).
Key Features:
Power Hour Detection:
Automatically identifies the two most liquid hours of the trading session.
Liquidity Sweep Detection:
Highlights when price sweeps a recent swing high or low — a common trap before reversals.
Break of Structure (BOS):
Confirms trend shift after a liquidity sweep with smart money-style BOS markers.
Fair Value Gap (FVG) Highlighting: (Optional)
Spot institutional imbalances between candles to fine-tune trade entries.
How It Works:
Wait for price to sweep a swing high or low during the power hours.
Look for a break of structure (BOS) in the opposite direction.
Enter on the next candle or FVG retest.
The indicator will plot a yellow circle for entry, a red line for stop, and a green line for the target (based on your RR setting).
Customizable Inputs:
Swing sensitivity (lookback bars)
Risk-to-reward ratio
Optional FVG visibility
Best Used With:
Higher timeframe bias (15m/1H)
Order blocks or volume analysis
Avoiding major news events
Whether you're a scalper or precision-based intraday trader, this tool helps you spot high-probability reversal setups with clean visuals and clear confirmations.

Path of Least ResistancePath of Least Resistance (PLR)
Concept Overview
The Path of Least Resistance indicator identifies key zones on your chart that act like "muddy" or "sticky" areas where price tends to get bogged down, creating choppy and unpredictable price action. Between these zones lie the "empty spaces" - clear paths where price can move freely with momentum and direction.
The Analogy: Muddy Fields vs Open Roads
Think of your chart like a landscape:
🟫 ZONES (Muddy/Sticky Areas)
Fair Value Gaps (FVGs) from higher timeframes
Pivot wick zones from higher timeframe pivots
Areas where price gets "stuck" and churns
Like walking through thick mud - slow, choppy, unpredictable movement
Price action becomes erratic and difficult to trade
🟢 EMPTY SPACES (Open Roads)
The clear areas between zones
Where price can move freely with momentum
Like driving on an open highway - smooth, directional movement
The "Path of Least Resistance" for price movement
Trading Philosophy
AVOID Trading Within Zones:
Price action is typically choppy and unpredictable
Higher probability of false signals and whipsaws
Like trying to drive through mud - you'll get stuck
TRADE Through the Empty Spaces:
Look for moves that travel between zones
Price tends to move with momentum and direction
Higher probability setups with cleaner price action
Like taking the highway instead of back roads
Zone Types Detected
Fair Value Gaps (FVGs)
Imbalances from higher timeframe candles
Areas where price "owes" a return visit
Often act as magnets, creating choppy price action
Pivot Wick Zones
Upper and lower wicks from higher timeframe pivots
Rejection areas where price previously struggled
Often create resistance/support that leads to choppy movement
Color Coding System
The zones dynamically change color based on current price position:
🔴 RED ZONES : Price is below the zone (bearish context)
🟢 GREEN ZONES : Price is above the zone (bullish context)
🔘 GRAY ZONES : Price is within the zone (neutral/choppy area)
The "Mum Trades" Strategy
The best trades - what we call "Mum trades" (trades so obvious even your mum could spot them) - happen in the empty spaces between zones:
✅ High Probability Characteristics:
Clear directional movement between zones
Less noise and false signals
Higher momentum and follow-through
Cleaner technical patterns
❌ Avoid These Areas:
Trading within the muddy zones
Expecting clean moves through sticky areas
Fighting against the natural flow of price
Key Features
Auto Timeframe Detection : Automatically selects appropriate higher timeframe
Dynamic Zone Management : Overlapping zones are automatically cleaned up
Real-time Alerts : Get notified when price enters/exits zones
Visual Clarity : Clean zone display with extending boundaries
How to Use
Identify the Zones : Let the indicator mark the muddy areas
Find the Paths : Look for clear spaces between zones
Plan Your Trades : Target moves that travel through empty space
Avoid the Mud : Stay away from trading within the zones
Follow the Flow : Trade with the path of least resistance
Remember
Price, like water, always seeks the path of least resistance. By identifying where that path is clear (empty spaces) versus where it's obstructed (zones), you can align your trading with the natural flow of the market rather than fighting against it.
The goal is simple: Trade the highways, avoid the mud.

BAFD (Price Action For D.....s)🧠 Overview
This indicator combines multiple Moving Averages (MA) with visual price action elements such as Fair Value Gaps (FVGs) and Swing Points. It provides traders with real-time insight into trend direction, structural breaks, and potential entry zones based on institutional price behavior.
⚙️ Features
1. Multi MA Visualization (SMA & EMA)
- Plots short-, mid-, and long-term moving averages
- Fully customizable: MA type (SMA/EMA) and length per MA
- Dynamic color coding: green for bullish, red for bearish (based on close >/< MA)
2. Fair Value Gaps (FVG) Detection
Detects bullish and bearish imbalances using multiple logic types:
- Same Type: Last 3 candles move in the same direction
- Twin Close: Last 2 candles close in the same direction
- All: Shows all valid FVGs regardless of pattern
Gaps are marked with semi-transparent yellow boxes
Useful for identifying potential liquidity voids and retest zones
3. Swing Highs and Lows
- Automatically identifies major swing points
- Customizable sensitivity (strength setting)
Marked with subtle colored dots for structure identification or support/resistance mapping
📈 Use Cases
- Trend Identification: Visualize momentum on multiple timeframes
- Liquidity Mapping: Spot potential retracement zones using FVGs
- Confluence Building: Combine MA slope, FVG zones, and swing points for refined setups
🛠️ Customizable Settings
- Moving average type and length for each MA
- FVG logic selection and color
- Swing point strength
🔔 Note
This script does not generate buy/sell signals or alerts. It is designed as a visual decision-support tool for discretionary traders who rely on market structure, trend, and price action.

Volume pressure by GSK-VIZAG-AP-INDIA🔍 Volume Pressure by GSK-VIZAG-AP-INDIA
🧠 Overview
“Volume Pressure” is a multi-timeframe, real-time table-based volume analysis tool designed to give traders a clear and immediate view of buying and selling pressure across custom-selected timeframes. By breaking down buy volume, sell volume, total volume, and their percentages, this indicator helps traders identify demand/supply imbalances and volume momentum in the market.
🎯 Purpose / Trading Use Case
This indicator is ideal for intraday and short-term traders who want to:
Spot aggressive buying or selling activity
Track volume dynamics across multiple timeframes *1 min time frame will give best results*
Use volume pressure as a confirming tool alongside price action or trend-based systems
It helps determine when large buying/selling activity is occurring and whether such behavior is consistent across timeframes—a strong signal of institutional interest or volume-driven trend shifts.
🧩 Key Features & Logic
Real-Time Table Display: A clean, dynamic table showing:
Buy Volume
Sell Volume
Total Volume
Buy % of total volume
Sell % of total volume
Multi-Time frame Analysis: Supports 8 user-selectable custom time frames from 1 to 240 minutes, giving flexibility to analyze volume pressure at various granularities.
Color-Coded Volume Bias:
Green for dominant Buy pressure
Red for dominant Sell pressure
Yellow for Neutral
Intensity-based blinking for extreme values (over 70%)
Dynamic Data Calculation:
Uses volume * (close > open) logic to estimate buy vs sell volumes bar-by-bar, then aggregates by timeframe.
⚙️ User Inputs & Settings
Timeframe Selectors (TF1 to TF8): Choose any 8 timeframes you want to monitor volume pressure across.
Text & Color Settings:
Customize text colors for Buy, Sell, Total volumes
Choose Buy/Sell bias colors
Enable/disable blinking for visual emphasis on extremes
Table Appearance:
Set header color, metric background, and text size
Table positioning: top-right, bottom-right, etc.
Blinking Highlight Toggle: Enable this to visually highlight when Buy/Sell % exceeds 70%—a sign of strong pressure.
📊 Visual Elements Explained
The table has 6 rows and 10 columns:
Row 0: Headers for Today and TF1 to TF8
Rows 1–3: Absolute values (Buy Vol, Sell Vol, Total Vol)
Rows 4–5: Relative percentages (Buy %, Sell %), with dynamic background color
First column shows the metric names (e.g., “Buy Vol”)
Cells blink using alternate background colors if volume pressure crosses thresholds
💡 How to Use It Effectively
Use Buy/Sell % rows to confirm potential breakout trades or identify volume exhaustion zones
Look for multi-timeframe confluence: If 5 or more TFs show >70% Buy pressure, buyers are in control
Combine with price action (e.g., breakouts, reversals) to increase conviction
Suitable for equities, indices, futures, crypto, especially on lower timeframes (1m to 15m)
🏆 What Makes It Unique
Table-based MTF Volume Pressure Display: Most indicators only show volume as bars or histograms; this script summarizes and color-codes volume bias across timeframes in a tabular format.
Customization-friendly: Full control over colors, themes, and timeframes
Blinking Alerts: Rare visual feature to capture user attention during extreme pressure
Designed with performance and readability in mind—even for fast-paced scalping environments.
🚨 Alerts / Extras
While this script doesn’t include TradingView alert functions directly, the visual blinking serves as a strong real-time alert mechanism.
Future versions may include built-in alert conditions for buy/sell bias thresholds.
🔬 Technical Concepts Used
Volume Dissection using close > open logic (to estimate buyer vs seller pressure)
Simple aggregation of volume over custom timeframes
Table plotting using Pine Script table.new, table.cell
Dynamic color logic for bias identification
Custom blinking logic using na(bar_index % 2 == 0 ? colorA : colorB)
⚠️ Disclaimer
This indicator is a tool for analysis, not financial advice. Always backtest and validate strategies before using any indicator for live trading. Past performance is not indicative of future results. Use at your own risk and apply proper risk management.
✍️ Author & Signature
Indicator Name: Volume Pressure
Author: GSK-VIZAG-AP-INDIA
TradingView Username: prowelltraders

FVG (Nephew sam remake)Hello i am making my own FVG script inspired by Nephew Sam as his fvg code is not open source. My goal is to replicate his Script and then add in alerts and more functions. Thus, i spent few days trying to code. There is bugs such as lower time frame not showing higher time frame FVG.
This script automatically detects and visualizes Fair Value Gaps (FVGs) — imbalances between demand and supply — across multiple timeframes (15-minute, 1-hour, and 4-hour).
15m chart shows:
15m FVGs (green/red boxes)
1H FVGs (lime/maroon)
4H FVGs (faded green/red with borders) (Bugged For now i only see 1H appearing)
1H chart shows:
1H FVGs
4H FVGs
4H chart shows:
4H FVGs only
There is the function to auto close FVG when a future candle fully disrespected it.
You're welcome to:
🔧 Customize the appearance: adjust box colors, transparency, border style
🧪 Add alerts: e.g., when price enters or fills a gap
📅 Expand to Daily/Weekly: just copy the logic and plug in "D" or "W" as new layers
📈 Build confluence logic: combine this with order blocks, liquidity zones, or ICT concepts
🧠 Experiment with entry signals: e.g., candle confirmation on return to FVG
🚀 Improve performance: if you find a lighter way to track gaps, feel free to optimize!

RSI - SECUNDARIO - mauricioofsousaSecondary RSI – MGO
Reading the rhythm behind the price action
The Secondary RSI is a specialized oscillator developed as part of the MGO (Matriz Gráficos ON) methodology. It works as a refined strength filter, designed to complement traditional RSI readings by isolating the true internal rhythm of price action and reducing the influence of market noise.
While the standard RSI measures price momentum, the Secondary RSI focuses on identifying breaks in oscillatory balance—the moments when the market shifts from accumulation to distribution or from compression to expansion.
🎯 What the Secondary RSI highlights:
Internal imbalances in energy between buyers and sellers
Micro-divergences not visible on standard RSI
Areas of price fatigue or overextension that often precede reversals
Confirmation zones for MGO oscillatory events (RPA, RPB, RBA, RBB)
📊 Recommended use:
Combine with the Primary RSI for dual-layer validation
Use as a noise-reduction tool before entering trends
Ideal in medium timeframes (12H / 4H) where oscillatory patterns form clearly
🧠 How it works:
The Secondary RSI recalculates the momentum signal using a block-based interpretation (aligned with the MGO structure) instead of simply following raw candle data. It adapts to the periodic nature of price behavior and provides the trader with a more stable and reliable measure of true market strength.

Dskyz (DAFE) GENESIS Dskyz (DAFE) GENESIS: Adaptive Quant, Real Regime Power
Let’s be honest: Most published strategies on TradingView look nearly identical—copy-paste “open-source quant,” generic “adaptive” buzzwords, the same shallow explanations. I’ve even fallen into this trap with my own previously posted strategies. Not this time.
What Makes This Unique
GENESIS is not a black-box mashup or a pre-built template. It’s the culmination of DAFE’s own adaptive, multi-factor, regime-aware quant engine—built to outperform, survive, and visualize live edge in anything from NQ/MNQ to stocks and crypto.
True multi-factor core: Volume/price imbalances, trend shifts, volatility compression/expansion, and RSI all interlock for signal creation.
Adaptive regime logic: Trades only in healthy, actionable conditions—no “one-size-fits-all” signals.
Momentum normalization: Uses rolling, percentile-based fast/slow EMA differentials, ALWAYS normalized, ALWAYS relevant—no “is it working?” ambiguity.
Position sizing that adapts: Not fixed-lot, not naive—not a loophole for revenge trading.
No hidden DCA or pyramiding—what you see is what you trade.
Dashboard and visual system: Directly connected to internal logic. If it’s shown, it’s used—and nothing cosmetic is presented on your chart that isn’t quantifiable.
📊 Inputs and What They Mean (Read Carefully)
Maximum Raw Score: How many distinct factors can contribute to regime/trade confidence (default 4). If you extend the quant logic, increase this.
RSI Length / Min RSI for Shorts / Max RSI for Longs: Fine-tunes how “overbought/oversold” matters; increase the length for smoother swings, tighten floors/ceilings for more extreme signals.
⚡ Regime & Momentum Gates
Min Normed Momentum/Score (Conf): Raise to demand only the strongest trends—your filter to avoid algorithmic chop.
🕒 Volatility & Session
ATR Lookback, ATR Low/High Percentile: These control your system’s awareness of when the market is dead or ultra-volatile. All sizing and filter logic adapts in real time.
Trading Session (hours): Easy filter for when entries are allowed; default is regular trading hours—no surprise overnight fills.
📊 Sizing & Risk
Max Dollar Risk / Base-Max Contracts: All sizing is adaptive, based on live regime and volatility state—never static or “just 1 contract.” Control your max exposures and real $ risk. ATR will effect losses in high volatility times.
🔄 Exits & Scaling
Stop/Trail/Scale multipliers: You choose how dynamic/flexible risk controls and profit-taking need to be. ATR-based, so everything auto-adjusts to the current market mode.
Visuals That Actually Matter
Dashboard (Top Right): Shows only live, relevant stats: scoring, status, position size, win %, win streak, total wins—all from actual trade engine state (not “simulated”).
Watermark (Bottom Right): Momentum bar visual is always-on, regime-aware, reflecting live regime confidence and momentum normalization. If the bar is empty, you’re truly in no-momentum. If it glows lime, you’re riding the strongest possible edge.
*No cosmetics, no hidden code distractions.
Backtest Settings
Initial capital: $10,000
Commission: Conservative, realistic roundtrip cost:
15–20 per contract (including slippage per side) I set this to $25
Slippage: 3 ticks per trade
Symbol: CME_MINI:NQ1!
Timeframe: 1 min (but works on all timeframes)
Order size: Adaptive, 1–3 contracts
No pyramiding, no hidden DCA
Why these settings?
These settings are intentionally strict and realistic, reflecting the true costs and risks of live trading. The 10,000 account size is accessible for most retail traders. 25/contract including 3 ticks of slippage are on the high side for NQ, ensuring the strategy is not curve-fit to perfect fills. If it works here, it will work in real conditions.
Why It Wins
While others put out “AI-powered” strategies with little logic or soul, GENESIS is ruthlessly practical. It is built around what keeps traders alive:
- Context-aware signals, not just patterns
- Tight, transparent risk
- Inputs that adapt, not confuse
- Visuals that clarify, not distract
- Code that runs clean, efficient, and with minimal overfitting risk (try it on QQQ, AMD, SOL, etc. out of the box)
Disclaimer (for TradingView compliance):
Trading is risky. Futures, stocks, and crypto can result in significant losses. Do not trade with funds you cannot afford to lose. This is for educational and informational purposes only. Use in simulation/backtest mode before live trading. No past performance is indicative of future results. Always understand your risk and ownership of your trades.
This will not be my last—my goal is to keep raising the bar until DAFE is a brand or I’m forced to take this private.
Use with discipline, use with clarity, and always trade smarter.
— Dskyz , powered by DAFE Trading Systems.

UT Bot + Cooldown + Visual FVGSynopsis – UT Bot + Cooldown + Visual FVG
This TradingView script combines:
✅ UT Bot Reversal Signals
Based on ATR and volatility logic
BUY when trend flips from bearish to bullish
SELL when trend flips from bullish to bearish
✅ Cooldown Filter
Limits signals to 1 per X bars (default 30)
Prevents overtrading during choppy price action
✅ Optional FVG Markers (Fair Value Gaps)
Visually shows bullish or bearish imbalances (3-bar gaps)
Does not affect signal generation — only for confluence
🔍 Ideal for traders who want clean, time-filtered signals with visual price-action context. Suitable for futures, crypto, or forex on intraday charts.

Multi-Indicator Swing [TIAMATCRYPTO]v6# Strategy Description:
## Multi-Indicator Swing
This strategy is designed for swing trading across various markets by combining multiple technical indicators to identify high-probability trading opportunities. The system focuses on trend strength confirmation and volume analysis to generate precise entry and exit signals.
### Core Components:
- **Supertrend Indicator**: Acts as the primary trend direction filter with optimized settings (Factor: 3.0, ATR Period: 10) to balance responsiveness and reliability.
- **ADX (Average Directional Index)**: Confirms the strength of the prevailing trend, filtering out sideways or choppy market conditions where the strategy avoids taking positions.
- **Liquidity Delta**: A volume-based indicator that analyzes buying and selling pressure imbalances to validate trend direction and potential reversals.
- **PSAR (Optional)**: Can be enabled to add additional confirmation for trend changes, turned off by default to reduce signal filtering.
### Key Features:
- **Flexible Direction Trading**: Choose between long-only, short-only, or bidirectional trading to adapt to market conditions or account restrictions.
- **Conservative Risk Management**: Implements fixed percentage-based stop losses (default 2%) and take profits (default 4%) for a positive risk-reward ratio.
- **Realistic Backtesting Parameters**: Includes commission (0.1%) and slippage (2 points) to reflect real-world trading conditions.
- **Visual Signals**: Clear buy/sell arrows with customizable sizes for easy identification on the chart.
- **Information Panel**: Dynamic display showing active indicators and current risk settings.
### Best Used On:
Daily timeframes for cryptocurrencies, forex, or stock indices. The strategy performs optimally on assets with clear trending behavior and sufficient volatility.
### Default Settings:
Optimized for conservative position sizing (5% of equity per trade) with an initial capital of $10,000. The backtesting period (2021-2023) provides a statistically significant sample of varied market conditions.

Bull vs Bear Volume (Enhanced)Bull vs Bear Volume (Enhanced) is a custom volume histogram that separates and visualizes estimated buying vs. selling volume within each candle. This allows traders to better understand market sentiment and detect imbalances in demand and supply.
🔍 What It Does:
Plots bullish volume (green) above the x-axis and bearish volume (red) below.
Estimates bull/bear volume by analyzing the close location within the candle's range.
Highlights volume spikes with lime (bullish) or maroon (bearish) when volume exceeds a user-defined threshold.
Includes an optional total volume line for added context.
Supports smoothing via simple moving average (SMA) to reduce noise.
🛠️ Inputs:
Toggle smoothing and set its length.
Enable/disable threshold spike highlighting.
Show/hide the total volume overlay.
Adjust the threshold multiplier for spike detection.
⚠️ Important:
This script uses a proxy method based on candle structure to estimate volume split — it does not use real-time order flow or trade direction data.
Works best on liquid assets with consistent volume.

CRT Finder (WanHakimFX)📈 Liquidity Grab Indicator with MTF Confluence & Alerts
🔍 Overview:
The Liquidity Grab Indicator is designed to detect precise moments when price sweeps liquidity — either by wicking below recent lows (bullish LQH) or above recent highs (bearish LQL) — followed by a clear rejection. It combines this logic with multi-timeframe confirmation and trend filters, making it a powerful tool for identifying high-probability reversal setups.
⚙️ How It Works:
✅ Liquidity Sweep Logic (LQH / LQL)
Bullish (LQH):
Current candle wicks below the previous low
Closes above the previous candle body
Confirms potential bullish reversal
Bearish (LQL):
Current candle wicks above the previous high
Closes below the previous candle body
Confirms potential bearish reversal
✅ Additional Conditions:
Must occur during London or New York sessions.
Requires trend confluence:
LQH = Price must be above SMMA 60/100/200
LQL = Price must be below SMMA 60/100/200
🧠 Multi-Timeframe Confluence:
The indicator scans for LQH/LQL sweeps across:
Daily
4H
1H
30M
15M
If a sweep occurs on any of these timeframes, an alert is triggered and a triangle marker appears on the chart for real-time visual confluence.
📊 Visual Features:
Green/Red labels for active timeframe sweeps.
Dotted wick lines to show liquidity zones from the previous candle.
Colored triangle markers for MTF sweep alerts.
🛠 Strategy Usage:
This indicator is best used as a trigger tool in a confluence-based strategy:
Use higher-timeframe MTF LQH/LQL markers for directional bias.
Wait for matching sweep on your entry timeframe (e.g., M1/M5).
Enter on confirmation candle or break of structure.
Target imbalances, FVGs, or previous highs/lows.
Risk-managed entries using sweep candle's high/low as stop.
📢 Alerts:
✅ Bullish Sweep (LQH) on any timeframe
✅ Bearish Sweep (LQL) on any timeframe

FVG [TakingProphets]🧠 Purpose
This indicator is built for traders applying Inner Circle Trader (ICT) methodology. It detects and manages Fair Value Gaps (FVGs) — price imbalances that often act as future reaction zones. It also highlights New Day Opening Gaps (NDOGs) and New Week Opening Gaps (NWOGs) that frequently play a role in early-session price behavior.
📚 What is a Fair Value Gap?
A Fair Value Gap forms when price moves rapidly, skipping over a portion of the chart between three candles — typically between the high of the first candle and the low of the third. These zones are considered inefficient, meaning institutions may return to them later to:
-Rebalance unfilled orders
-Enter or scale into positions
-Engineer liquidity with minimal slippage
In ICT methodology, FVGs are seen as both entry zones and targets, depending on market structure and context.
⚙️ How It Works
-This script automatically identifies and manages valid FVGs using the following logic:
-Bullish FVGs: When the low of the current candle is above the high from two candles ago
-Bearish FVGs: When the high of the current candle is below the body of two candles ago
-Minimum Gap Filter: Gaps must be larger than 0.05% of price
-Combine Consecutive Gaps (optional): Merges adjacent gaps of the same type
-Consequent Encroachment Line (optional): Plots the midpoint of each gap
-NDOG/NWOG Tracking: Labels gaps created during the 5–6 PM session transition
-Automatic Invalidation: Gaps are removed once price closes beyond their boundary
🎯 Practical Use
-Use unmitigated FVGs as potential entry points or targets
-Monitor NDOG and NWOG for context around daily or weekly opens
-Apply the midpoint (encroachment) line for precise execution decisions
-Let the script handle cleanup — only active, relevant zones remain visible
🎨 Customization
-Control colors for bullish, bearish, and opening gaps
-Toggle FVG borders and midpoint lines
-Enable or disable combining of consecutive gaps
-Fully automated zone management, no manual intervention required
✅ Summary
This tool offers a clear, rules-based approach to identifying price inefficiencies rooted in ICT methodology. Whether used for intraday or swing trading, it helps traders stay focused on valid, active Fair Value Gaps while filtering out noise and maintaining chart clarity.

US30 Smart Money 5M/4H Strategy🧠 How It Works
✅ 1. 4H Trend Bias Detection
Uses the 4-hour chart (internally) to determine if the market is in an uptrend or downtrend.
Background turns green for bullish trend, red for bearish trend.
This helps filter trades — only take longs during uptrend, shorts during downtrend.
✅ 2. Liquidity Sweeps (Stop Hunts) on 5M
Highlights candles that break previous highs/lows and then reverse (typical of institutional stop raids).
Draws a shaded red box above sweep-high candles and green box under sweep-lows.
These indicate key reversal zones.
✅ 3. Order Block Zones
Detects bullish/bearish engulfing patterns after liquidity sweeps.
Draws a supply or demand zone box extending forward.
These zones show where institutions likely placed large orders.
✅ 4. FVG Midpoint from 30-Min Chart
Detects Fair Value Gaps (imbalances) on the 30-minute chart.
Plots a line at the midpoint of the gap (EQ level), which is often revisited for entries or rejections.
✅ 5. Buy/Sell Signals (Non-Repainting)
Buy = 4H uptrend + 5M liquidity sweep low + bullish engulfing candle.
Sell = 4H downtrend + 5M liquidity sweep high + bearish engulfing.
Prints green “BUY” or red “SELL” label on the chart — these do not repaint.
📈 How to Use It
Wait for trend bias — only take trades in the direction of the 4H trend.
Watch for liquidity sweep boxes — these hint a stop hunt just occurred.
Look for a signal label (BUY/SELL) — confirms entry criteria.
Use FVG EQ lines & Order Block zones as confluence or targets.
Take trades after NY open (9:30 AM EST) for best momentum.

London ORB + Session High/Low + FVGLondon ORB + Session High/Low + FVG
📘 Script Description: London ORB + Session High/Low + Fair Value Gap
This script is designed to assist intraday traders during the London session open by combining:
🕒 1. Opening Range Breakout (ORB)
Captures the high and low of the first 15-minute candle after the London open (08:00–08:15 GMT).
Draws lines and labels for the ORB High and Low levels.
Detects breakouts above or below the ORB and plots a triangle signal at the breakout bar.
🌐 2. Asian & US Session Levels
Automatically marks the highs and lows of the Asian (00:00–06:00 GMT) and US (13:30–20:00 GMT) sessions.
Useful for identifying prior session liquidity zones, key support/resistance levels, and potential reaction areas.
📉 3. Fair Value Gaps (FVG)
Highlights imbalances in price action between non-overlapping candles (also known as FVGs or inefficiencies).
Draws a shaded box between candles where gaps exist:
Green for bullish FVGs
Red for bearish FVGs
🔔 4. Alert Support
Optional alerts are built in for:
Long breakout (price breaks above ORB)
Short breakout (price breaks below ORB)
🎯 Use Case
Perfect for:
Day traders looking to capitalize on early volatility at the London open
Traders using liquidity-based strategies, retests, or gap-fills
Visualizing and aligning with prior session highs/lows for structure and context

ADX Divergence and Gap Monitor [theUltimator5]ADX Divergence and Gap Monitor is a custom technical analysis tool designed to visualize momentum imbalances and sudden shifts in trend participation using the ADX system. It combines traditional ADX, DI+ and DI− calculations with dynamic filtering and visual highlighting to help identify key moments of directional acceleration or weakening.
🔍 What It Does:
This indicator builds on the Average Directional Index (ADX) system to detect conditions where market trend strength diverges significantly from directional input (DI) activity. It includes two major visual signals:
Highlight Backgrounds
These appear when the indicator detects a “gap” or sudden acceleration in DI values while ADX remains low, suggesting early-stage momentum bursts or signal noise spikes.
The trigger threshold for DI change can be adjusted using the Gap Trigger Level input.
A background highlight is shown when DI+ or DI− increases sharply, either from a low-ADX environment or from a rapid standalone spike.
GAP Markers
Optional yellow label markers display the word "GAP" just below the lowest line (ADX, DI+, or DI−) whenever a gap condition is triggered. These provide a more noticeable visual cue without crowding the chart.
You can enable or disable the markers with the Show GAP Markers toggle.
🧠 Advanced Divergence Detection:
The script also scans for dominant ADX divergence events, where ADX is significantly higher than DI+ or DI−, indicating strong trend force with weak directional participation. When these conditions are met:
Red or green background fills appear depending on whether DI+ or DI− is being overpowered.
These conditions are based on customizable moving averages and DI strength relationships.
⚙️ Key Inputs:
ADX Length: Period for ADX calculation
DI Moving Average: Smoothing length for directional index signals
Gap Trigger Level: Minimum DI change needed to trigger a GAP highlight
Show Highlight Backgrounds: Toggle to display or hide background signals
Show GAP Markers: Toggle to show or hide text-based GAP labels
🧪 Use Cases:
Spot early breakouts or reversals when DI activity spikes while ADX is still low
Identify periods of trend exhaustion or false breakouts using divergence logic
Confirm trade entry points when ADX begins to rise after a GAP event

Reversal Strength Meter – Adib NooraniThe Reversal Strength Meter is an oscillator designed to identify potential reversal zones based on supply and demand dynamics. It uses smoothed stochastic logic to reduce noise and highlight areas where momentum may be weakening, signaling possible market turning points.
🔹 Smooth, noise-reduced stochastic oscillator
🔹 Custom zones to highlight potential supply and demand imbalances
🔹 Non-repainting, compatible across all timeframes and assets
🔹 Visual-only tool — intended to support discretionary trading decisions
This oscillator assists scalpers and intraday traders in tracking subtle shifts in momentum, helping them identify when a market may be preparing to reverse — always keeping in mind that trading is based on probabilities, not certainties.
📘 How to Use the Indicator Efficiently
For Reversal Trading:
Buy Setup
– When the blue line dips below the 20 level, wait for it to re-enter above 20.
– Look for reversal candlestick patterns (e.g., bullish engulfing, hammer, or morning star).
– Enter above the pattern’s high, with a stop loss below its low.
Sell Setup
– When the blue line rises above the 80 level, wait for it to re-enter below 80.
– Look for bearish candlestick patterns (e.g., bearish engulfing, inverted hammer, or evening star).
– Enter below the pattern’s low, with a stop loss above its high.
🛡 Risk Management Guidelines
Risk only 0.5% of your capital per trade
Book 50% profits at a 1:1 risk-reward ratio
Trail the remaining 50% using price action or other supporting indicators

Retirement Portfolio Dashboard1. Set It Up
Paste the script into the Pine Script editor in TradingView
Add to chart (use a daily chart for any TSX ticker)
Configure the inputs on the right panel:
Choose your ETF tickers (default: VFV, XAW, XIC)
Enter your target allocations (U.S., Global, Canada, Cash)
Set your current portfolio value and contribution plan
Adjust your expected return and rebalance trigger
📊 2. What It Tracks
💼 Allocation Overview
Target vs. actual % for each asset class
CAD value of each component
Performance YTD based on Jan 2nd start
Drift % to see how far each asset has deviated
📈 Growth Forecast
Future value projection with contributions
Weighted return (based on typical historical returns)
Inflation-adjusted real return (assuming 2% inflation)
⚠ Rebalancing
If any drift exceeds your set threshold (e.g., 5%), the script:
Highlights the issue in red
Displays "⚠ Rebalance Suggested"
Triggers a TradingView alert if you've activated it
🔔 3. Set Up Alerts
Go to Alerts > Create Alert
Choose your script from the dropdown
Under Condition, select "Rebalance Alert"
Choose your desired alert type (popup, email, webhook, etc.)
✅ 4. How to Use It Effectively
Task What to Do
Monitor allocations Check dashboard weekly or monthly
Spot imbalances Use Drift % and Status (green/red)
Forecast retirement growth Adjust contributions, return rate, and horizon
Prepare to rebalance Use alerts when drift > threshold
Tune assumptions Change expected returns or inflation rate as needed
💡 Tips
You can edit return assumptions (e.g., make Global equity more conservative)
Use this on a “blank” ticker (like TSX:XIC) so you don't overlay the chart
Copy values from your broker or retirement account to update real allocations

[TehThomas] - ICT Inversion Fair value Gap (IFVG) The Inversion Fair Value Gap (IFVG) indicator is a powerful tool designed for traders who utilize ICT (Inner Circle Trader) strategies. It focuses on identifying and displaying Inversion Fair Value Gaps, which are critical zones that emerge when traditional Fair Value Gaps (FVGs) are invalidated by price action. These gaps represent key areas where price often reacts, making them essential for identifying potential reversals, trend continuations, and liquidity zones.
What Are Inversion Fair Value Gaps?
Inversion Fair Value Gaps occur when price revisits a traditional FVG and breaks through it, effectively flipping its role in the market. For example:
A bullish FVG that is invalidated becomes a bearish zone, often acting as resistance.
A bearish FVG that is invalidated transforms into a bullish zone, serving as support.
These gaps are significant because they often align with institutional trading activity. They highlight areas where large orders have been executed or where liquidity has been targeted. Understanding these gaps provides traders with a deeper insight into market structure and helps them anticipate future price movements with greater accuracy.
Why This Strategy Works
The IFVG concept is rooted in ICT principles, which emphasize liquidity dynamics, market inefficiencies, and institutional order flow. Traditional FVGs represent imbalances in price action caused by gaps between candles. When these gaps are invalidated, they become inversion zones that can act as magnets for price. These zones frequently serve as high-probability areas for price reversals or trend continuations.
This strategy works because it aligns with how institutional traders operate. Inversion gaps often mark areas of interest for "smart money," making them reliable indicators of potential market turning points. By focusing on these zones, traders can align their strategies with institutional behavior and improve their overall trading edge.
How the Indicator Works
This indicator simplifies the process of identifying and tracking IFVGs by automating their detection and visualization on the chart. It scans the chart in real-time to identify bullish and bearish FVGs that meet user-defined thresholds for inversion. Once identified, these gaps are dynamically displayed on the chart with distinct colors for bullish and bearish zones.
The indicator also tracks whether these gaps are mitigated or broken by price action. When an IFVG is broken, it extends the zone for a user-defined number of bars to visualize its potential role as a new support or resistance level. Additionally, alerts can be enabled to notify traders when new IFVGs form or when existing ones are broken, ensuring timely decision-making in fast-moving markets.
Key Features
Automatic Detection: The indicator automatically identifies bullish and bearish IFVGs based on user-defined thresholds.
Dynamic Visualization: It displays IFVGs directly on the chart with customizable colors for easy differentiation.
Real-Time Updates: The status of each IFVG is updated dynamically based on price action.
Zone Extensions: Broken IFVGs are extended to visualize their potential as support or resistance levels.
Alerts: Notifications can be set up to alert traders when key events occur, such as the formation or breaking of an IFVG.
These features make the tool highly efficient and reduce the need for manual analysis, allowing traders to focus on execution rather than tedious chart work.
Benefits of Using This Indicator
The IFVG indicator offers several advantages that make it an indispensable tool for ICT traders. By automating the detection of inversion gaps, it saves time and reduces errors in analysis. The clearly defined zones improve risk management by providing precise entry points, stop-loss levels, and profit targets based on market structure.
This tool is also highly versatile and adapts seamlessly across different timeframes. Whether you’re scalping lower timeframes or swing trading higher ones, it provides actionable insights tailored to your trading style. Furthermore, by aligning your strategy with institutional logic, you gain a significant edge in anticipating market movements.
Practical Applications
This indicator can be used across various trading styles:
Scalping: Identify quick reversal points on lower timeframes using real-time alerts.
Day Trading: Use inversion gaps as key levels for intraday support/resistance or trend continuation setups.
Swing Trading: Analyse higher timeframes to identify major inversion zones that could act as critical turning points in larger trends.
By integrating this tool into your trading routine, you can streamline your analysis process and focus on executing high-probability setups.
Conclusion
The Inversion Fair Value Gap (IFVG) indicator is more than just a technical analysis tool—it’s a strategic ally for traders looking to refine their edge in the markets. By automating the detection and tracking of inversion gaps based on ICT principles, it simplifies complex market analysis while maintaining accuracy and depth. Whether you’re new to ICT strategies or an experienced trader seeking greater precision, this indicator will elevate your trading game by aligning your approach with institutional behavior.
If you’re serious about improving your trading results while saving time and effort, this tool is an essential addition to your toolkit. It provides clarity in chaotic markets, enhances precision in trade execution, and ensures you never miss critical opportunities in your trading journey.
__________________________________________
Thanks for your support!
If you found this idea helpful or learned something new, drop a like 👍 and leave a comment, I’d love to hear your thoughts! 🚀
Make sure to follow me for more price action insights, free indicators, and trading strategies. Let’s grow and trade smarter together! 📈

TR FVG Finder 1.0TR FVG Finder 1.0 - Identify High-Probability Trading Zones
Unlock the power of Fair Value Gaps (FVGs) with this advanced TradingView indicator! Designed for traders seeking high-probability setups, the Fair Value Gap Detector identifies key price imbalances on your chart, helping you spot potential reversal and continuation zones with precision.
Key Features:
Accurate FVG Detection: Automatically detects bullish and bearish Fair Value Gaps based on a proven 3-candle pattern, highlighting areas where price is likely to return.
Customizable Display: Shows the most recent 3 FVGs by default (combined bullish and bearish), with an option to adjust the number of FVGs displayed.
Visual Clarity: Draws semi-transparent boxes (green for bullish FVGs, red for bearish FVGs) that extend 15 candles to the right, making it easy to track key levels.
Versatile for All Markets: Works on any timeframe and instrument—perfect for forex, stocks, crypto, and commodities like XAU/USD (gold).
User-Friendly: Simple to use with customizable settings, ideal for both beginner and experienced traders.
How It Works:
The indicator identifies FVGs by analyzing a 3-candle pattern:
- Bullish FVG: When the high of the candle two bars back is below the low of the current candle.
- Bearish FVG: When the low of the candle two bars back is above the high of the current candle. These gaps often act as magnets for price, making them powerful zones for trading strategies like breakouts, pullbacks, or reversals.
Why Use This Indicator?
- Enhance your technical analysis with a proven concept used by institutional traders.
- Spot high-probability trading opportunities with clear visual cues.
- Save time by automating FVG detection—no manual drawing required.
Best Practices:
- Use on lower timeframes (e.g., 15-minute or 1-hour) for more frequent FVGs, especially in volatile markets like forex or crypto.
- Combine with other indicators (e.g., support/resistance, volume) for confirmation.
- Ideal for strategies like ICT (Inner Circle Trader) concepts, Smart Money trading, and price action analysis.
Regards,
Trader Riaz

On Balance VolumeThe traditional OBV (On-Balance Volume) indicator line chart has been replaced with a candlestick-based OBV chart, offering a more granular and visually comprehensive approach to volume-price analysis. This transformation allows traders to analyze OBV fluctuations in the form of candlestick patterns, making it easier to identify critical price action signals such as support and resistance levels, breakouts, and breakdowns.
By integrating OBV candlesticks with the price chart, traders can better assess volume accumulation and distribution phases, detect divergences, and confirm trend strength. This enhanced visualization helps in identifying momentum shifts, liquidity imbalances, and institutional activity with greater accuracy. The OBV candlestick chart provides a deeper layer of market structure analysis, allowing price action traders to refine their strategies and improve trade execution based on real-time volume dynamics."
