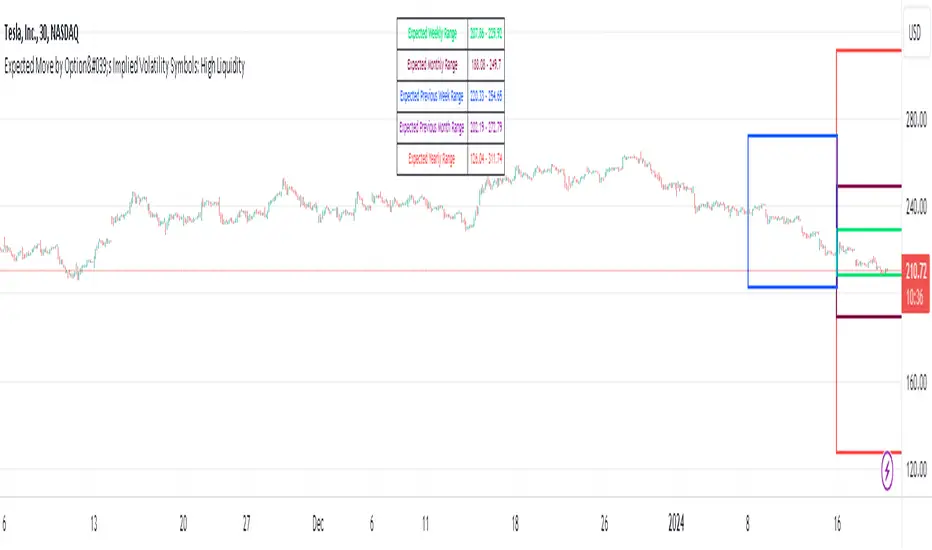
Expected Move by Option's Implied Volatility High Liquidity
This script plots boxes to reflect weekly, monthly and yearly expected moves based on "At The Money" put and call option's implied volatility.
Symbols in range: This script will display Expected Move data for Symbols with high option liquidity.
Weekly Updates: Each weekend, the script is updated with fresh expected move data, a job that takes place every Saturday following the close of the markets on Friday.
In the provided script, several boxes are created and plotted on a price chart to represent the expected price moves for various timeframes.
These boxes serve as visual indicators to help traders and analysts understand the expected price volatility.
Definition of Expected Move: Expected Move refers to the anticipated range within which the price of an underlying asset is expected to move over a specific time frame, based on the current implied volatility of its options. Calculation: Expected Move is typically calculated by taking the current stock price and applying a multiple of the implied volatility. The most commonly used multiple is the one-standard-deviation move, which encompasses approximately 68% of potential price outcomes.
Example: Suppose a stock is trading at $100, and the implied volatility of its options is 20%. The one-standard-deviation expected move would be $100 * 0.20 = $20.
This suggests that there is a 68% probability that the stock's price will stay within a range of $80 to $120 over the specified time frame. Usage: Traders and investors use the expected move as a guideline for setting trading strategies and managing risk. It helps them gauge the potential price swings and make informed decisions about buying or selling options.There is a 68% chance that the underlying asset stock or ETF price will be within the boxed area at option expiry. The data on this script is updating weekly at the close of Friday, calculating the implied volatility for the week/month/year based on the "at the money" put and call options with the relevant expiry. This script will display Expected Move data for Symbols within the range of JBL-NOTE in alphabetical order.
In summary, implied volatility reflects market expectations about future price volatility, especially in the context of options. Expected Move is a practical application of implied volatility, helping traders estimate the likely price range for an asset over a given period. Both concepts play a vital role in assessing risk and devising trading strategies in the options and stock markets.
Cerca negli script per "implied"
Expected Move by Option's Implied Volatility Symbols: EAT - GBDC
This script plots boxes to reflect weekly, monthly and yearly expected moves based on "At The Money" put and call option's implied volatility.
Symbols in range: This script will display Expected Move data for Symbols within the range of EAT-GDBC in alphabetical order.
Weekly Updates: Each weekend, the script is updated with fresh expected move data, a job that takes place every Saturday following the close of the markets on Friday.
In the provided script, several boxes are created and plotted on a price chart to represent the expected price moves for various timeframes.
These boxes serve as visual indicators to help traders and analysts understand the expected price volatility.
Definition of Expected Move: Expected Move refers to the anticipated range within which the price of an underlying asset is expected to move over a specific time frame, based on the current implied volatility of its options. Calculation: Expected Move is typically calculated by taking the current stock price and applying a multiple of the implied volatility. The most commonly used multiple is the one-standard-deviation move, which encompasses approximately 68% of potential price outcomes.
Example: Suppose a stock is trading at $100, and the implied volatility of its options is 20%. The one-standard-deviation expected move would be $100 * 0.20 = $20.
This suggests that there is a 68% probability that the stock's price will stay within a range of $80 to $120 over the specified time frame. Usage: Traders and investors use the expected move as a guideline for setting trading strategies and managing risk. It helps them gauge the potential price swings and make informed decisions about buying or selling options. There is a 68% chance that the underlying asset stock or ETF price will be within the boxed area at option expiry. The data on this script is updating weekly at the close of Friday, calculating the implied volatility for the week/month/year based on the "at the money" put and call options with the relevant expiry.
In summary, implied volatility reflects market expectations about future price volatility, especially in the context of options. Expected Move is a practical application of implied volatility, helping traders estimate the likely price range for an asset over a given period. Both concepts play a vital role in assessing risk and devising trading strategies in the options and stock markets.

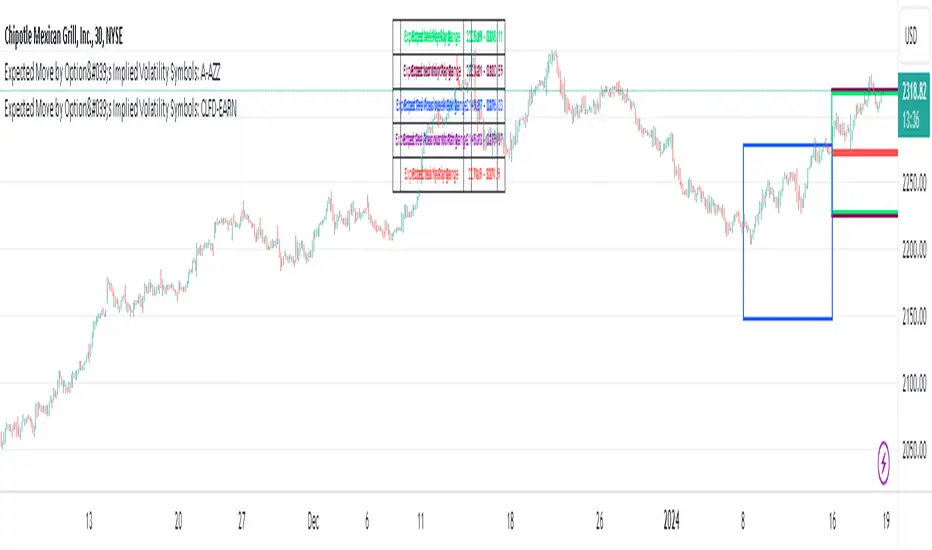
Expected Move by Option's Implied Volatility Symbols: CLFD-EARN This script plots boxes to reflect weekly, monthly and yearly expected moves based on "At The Money" put and call option's implied volatility.
Symbols in range: This script will display Expected Move data for Symbols within the range of CLFD - EARN in alphabetical order.
Weekly Updates: Each weekend, the script is updated with fresh expected move data, a job that takes place every Saturday following the close of the markets on Friday.
In the provided script, several boxes are created and plotted on a price chart to represent the expected price moves for various timeframes.
These boxes serve as visual indicators to help traders and analysts understand the expected price volatility.
Definition of Expected Move: Expected Move refers to the anticipated range within which the price of an underlying asset is expected to move over a specific time frame, based on the current implied volatility of its options. Calculation: Expected Move is typically calculated by taking the current stock price and applying a multiple of the implied volatility. The most commonly used multiple is the one-standard-deviation move, which encompasses approximately 68% of potential price outcomes.
Example: Suppose a stock is trading at $100, and the implied volatility of its options is 20%. The one-standard-deviation expected move would be $100 * 0.20 = $20.
This suggests that there is a 68% probability that the stock's price will stay within a range of $80 to $120 over the specified time frame. Usage: Traders and investors use the expected move as a guideline for setting trading strategies and managing risk. It helps them gauge the potential price swings and make informed decisions about buying or selling options. There is a 68% chance that the underlying asset stock or ETF price will be within the boxed area at option expiry. The data on this script is updating weekly at the close of Friday, calculating the implied volatility for the week/month/year based on the "at the money" put and call options with the relevant expiry.
In summary, implied volatility reflects market expectations about future price volatility, especially in the context of options. Expected Move is a practical application of implied volatility, helping traders estimate the likely price range for an asset over a given period. Both concepts play a vital role in assessing risk and devising trading strategies in the options and stock markets.
Expected Move by Option's Implied Volatility Symbols: B - CLF
This script plots boxes to reflect weekly, monthly and yearly expected moves based on "At The Money" put and call option's implied volatility.
Symbols in range: This script will display Expected Move data for Symbols within the range of B - CLF in alphabetical order.
Weekly Updates: Each weekend, the script is updated with fresh expected move data, a job that takes place every Saturday following the close of the markets on Friday.
In the provided script, several boxes are created and plotted on a price chart to represent the expected price moves for various timeframes.
These boxes serve as visual indicators to help traders and analysts understand the expected price volatility.
Definition of Expected Move: Expected Move refers to the anticipated range within which the price of an underlying asset is expected to move over a specific time frame, based on the current implied volatility of its options. Calculation: Expected Move is typically calculated by taking the current stock price and applying a multiple of the implied volatility. The most commonly used multiple is the one-standard-deviation move, which encompasses approximately 68% of potential price outcomes.
Example: Suppose a stock is trading at $100, and the implied volatility of its options is 20%. The one-standard-deviation expected move would be $100 * 0.20 = $20.
This suggests that there is a 68% probability that the stock's price will stay within a range of $80 to $120 over the specified time frame. Usage: Traders and investors use the expected move as a guideline for setting trading strategies and managing risk. It helps them gauge the potential price swings and make informed decisions about buying or selling options. There is a 68% chance that the underlying asset stock or ETF price will be within the boxed area at option expiry. The data on this script is updating weekly at the close of Friday, calculating the implied volatility for the week/month/year based on the "at the money" put and call options with the relevant expiry.
In summary, implied volatility reflects market expectations about future price volatility, especially in the context of options. Expected Move is a practical application of implied volatility, helping traders estimate the likely price range for an asset over a given period. Both concepts play a vital role in assessing risk and devising trading strategies in the options and stock markets.
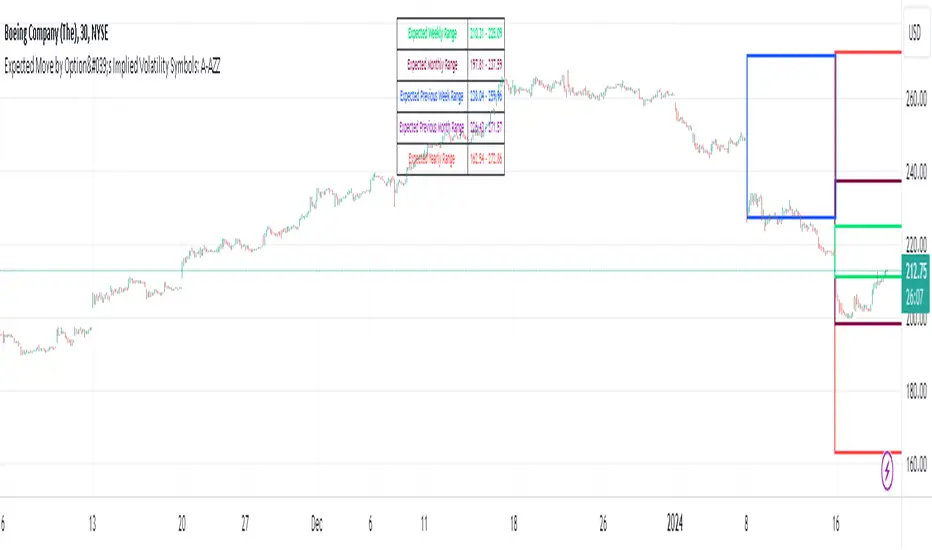
Expected Move by Option's Implied Volatility Symbols: A - AZZ
This script plots boxes to reflect weekly, monthly and yearly expected moves based on "At The Money" put and call option's implied volatility.
Symbols in range: This script will display Expected Move data for Symbols within the range of A - AZZ in alphabetical order.
Weekly Updates: Each weekend, the script is updated with fresh expected move data, a job that takes place every Saturday following the close of the markets on Friday.
In the provided script, several boxes are created and plotted on a price chart to represent the expected price moves for various timeframes.
These boxes serve as visual indicators to help traders and analysts understand the expected price volatility.
Definition of Expected Move: Expected Move refers to the anticipated range within which the price of an underlying asset is expected to move over a specific time frame, based on the current implied volatility of its options. Calculation: Expected Move is typically calculated by taking the current stock price and applying a multiple of the implied volatility. The most commonly used multiple is the one-standard-deviation move, which encompasses approximately 68% of potential price outcomes.
Example: Suppose a stock is trading at $100, and the implied volatility of its options is 20%. The one-standard-deviation expected move would be $100 * 0.20 = $20.
This suggests that there is a 68% probability that the stock's price will stay within a range of $80 to $120 over the specified time frame. Usage: Traders and investors use the expected move as a guideline for setting trading strategies and managing risk. It helps them gauge the potential price swings and make informed decisions about buying or selling options. There is a 68% chance that the underlying asset stock or ETF price will be within the boxed area at option expiry. The data on this script is updating weekly at the close of Friday, calculating the implied volatility for the week/month/year based on the "at the money" put and call options with the relevant expiry.
In summary, implied volatility reflects market expectations about future price volatility, especially in the context of options. Expected Move is a practical application of implied volatility, helping traders estimate the likely price range for an asset over a given period. Both concepts play a vital role in assessing risk and devising trading strategies in the options and stock markets.

Implied Volatility Estimator using Black Scholes [Loxx]Implied Volatility Estimator using Black Scholes derives a estimation of implied volatility using the Black Scholes options pricing model. The Bisection algorithm is used for our purposes here. This includes the ability to adjust for dividends.
Implied Volatility
The implied volatility (IV) of an option contract is that value of the volatility of the underlying instrument which, when input in an option pricing model (such as Black–Scholes), will return a theoretical value equal to the current market price of that option. The VIX , in contrast, is a model-free estimate of Implied Volatility. The latter is viewed as being important because it represents a measure of risk for the underlying asset. Elevated Implied Volatility suggests that risks to underlying are also elevated. Ordinarily, to estimate implied volatility we rely upon Black-Scholes (1973). This implies that we are prepared to accept the assumptions of Black Scholes (1973).
Inputs
Spot price: select from 33 different types of price inputs
Strike Price: the strike price of the option you're wishing to model
Market Price: this is the market price of the option; choose, last, bid, or ask to see different results
Historical Volatility Period: the input period for historical volatility ; historical volatility isn't used in the Bisection algo, this is to serve as a comparison, even though historical volatility is from price movement of the underlying asset where as implied volatility is the volatility of the option
Historical Volatility Type: choose from various types of implied volatility , search my indicators for details on each of these
Option Base Currency: this is to calculate the risk-free rate, this is used if you wish to automatically calculate the risk-free rate instead of using the manual input. this uses the 10 year bold yield of the corresponding country
% Manual Risk-free Rate: here you can manually enter the risk-free rate
Use manual input for Risk-free Rate? : choose manual or automatic for risk-free rate
% Manual Yearly Dividend Yield: here you can manually enter the yearly dividend yield
Adjust for Dividends?: choose if you even want to use use dividends
Automatically Calculate Yearly Dividend Yield? choose if you want to use automatic vs manual dividend yield calculation
Time Now Type: choose how you want to calculate time right now, see the tool tip
Days in Year: choose how many days in the year, 365 for all days, 252 for trading days, etc
Hours Per Day: how many hours per day? 24, 8 working hours, or 6.5 trading hours
Expiry date settings: here you can specify the exact time the option expires
*** the algorithm inputs for low and high aren't to be changed unless you're working through the mathematics of how Bisection works.
Included
Option pricing panel
Loxx's Expanded Source Types
Related Indicators
Cox-Ross-Rubinstein Binomial Tree Options Pricing Model

Implied Volatility RangeThe Implied Volatility Range is a forward-looking tool that transforms option market data into probability ranges for future prices. Based on the lognormal distribution of asset prices assumed in modern option pricing models, it converts the implied volatility curve into a volatility cone with dynamic labels that show the market’s expectations for the price distribution at a specific point in time. At the selected future date, it displays projected price levels and their percentage change from today’s close across 1, 2, and 3 standard deviation (σ) ranges:
1σ range = ~68.2% probability the price will remain within this range.
2σ range = ~95.4% probability the price will remain within this range.
3σ range = ~99.7% probability the price will remain within this range.
What makes this indicator especially useful is its ability to incorporate implied volatility skew. When only ATM IV (%) is entered, the indicator displays the standard Black–Scholes lognormal distribution. By adding High IV (%) and Low IV (%) values tied to strikes above and below the current price, the indicator interpolates between these inputs to approximate the implied volatility skew. This adjustment produces a market-implied probability distribution that indicates whether the option market is leaning bullish or bearish, based on the data entered in the menu:
ATM IV (%) = Implied volatility at the current spot price (at-the-money).
High IV (%) = Implied volatility at a strike above the current spot price.
High Strike = Strike price corresponding to the High IV input (OTM call).
Low IV (%) = Implied volatility at a strike below the current spot price.
Low Strike = Strike price corresponding to the Low IV input (OTM put).
Expiration (Day, Month, Year) = Option expiration date for the projection.
Once these inputs are entered, the indicator calculates implied probability ranges and, if both High IV and Low IV values are provided, adjusts for skew to approximate the option market’s distribution. If no implied volatility data is supplied, the indicator defaults to a lognormal distribution based on historical volatility, using past realized volatility over the same forward horizon. This keeps the tool functional even without implied volatility inputs, though in that case the output represents only an approximation of ATM IV, not the actual market view.
In summary, the Implied Volatility Range is a powerful tool that translates implied volatility inputs into a clear and practical estimate of the market’s expectations for future prices. It allows traders to visualize the probability of price ranges while also highlighting directional bias, a dimension often difficult to interpret from traditional implied volatility charts. It should be emphasized, however, that this tool reflects only the market’s expectations at a specific point in time, which may change as new information and trading activity reshape implied volatility.

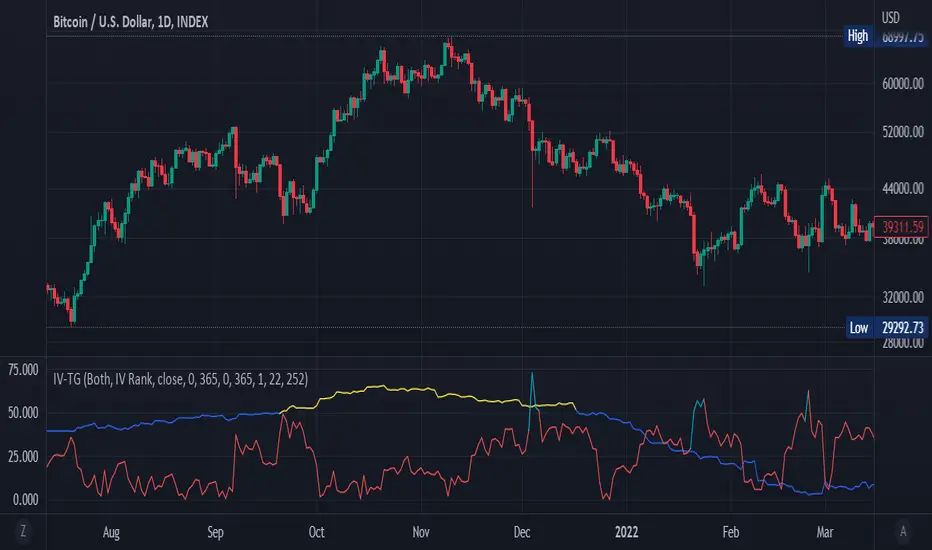
Implied Volatility SuiteThis is an updated, more robust, and open source version of my 2 previous scripts : "Implied Volatility Rank & Model-Free IVR" and "IV Rank & IV Percentile".
This specific script provides you with 4 different types of volatility data: 1)Implied volatility, 2) Implied Volatility Rank, 3)Implied Volatility Percentile, 4)Skew Index.
1) Implied Volatility is the market's forecast of a likely movement, usually 1 standard deviation, in a securities price.
2) Implied Volatility Rank, ranks IV in relation to its high and low over a certain period of time. For example if over the past year IV had a high of 20% and a low of 10% and is currently 15%; the IV rank would be 50%, as 15 is 50% of the way between 10 & 20. IV Rank is mean reverting, meaning when IV Rank is high (green) it is assumed that future volatility will decrease; while if IV rank is low (red) it is assumed that future volatility will increase.
3) Implied Volatility Percentile ranks IV in relation to how many previous IV data points are less than the current value. For example if over the last 5 periods Implied volatility was 10%,12%,13%,14%,20%; and the current implied volatility is 15%, the IV percentile would be 80% as 4 out of the 5 previous IV values are below the current IV of 15%. IV Percentile is mean reverting, meaning when IV Percentile is high (green) it is assumed that future volatility will decrease; while if IV percentile is low (red) it is assumed that future volatility will increase. IV Percentile is more robust than IV Rank because, unlike IV Rank which only looks at the previous highs and lows, IV Percentile looks at all data points over the specified time period.
4)The skew index is an index I made that looks at volatility skew. Volatility Skew compares implied volatility of options with downside strikes versus upside strikes. If downside strikes have higher IV than upside strikes there is negative volatility skew. If upside strikes have higher IV than downside strikes then there is positive volatility skew. Typically, markets have a negative volatility skew, this has been the case since Black Monday in 1987. All negative skew means is that projected option contract prices tend to go down over time regardless of market conditions.
Additionally, this script provides two ways to calculate the 4 data types above: a)Model-Based and b)VixFix.
a) The Model-Based version calculates the four data types based on a model that projects future volatility. The reason that you would use this version is because it is what is most commonly used to calculate IV, IV Rank, IV Percentile, and Skew; and is closest to real world IV values. This version is what is referred to when people normally refer to IV. Additionally, the model version of IV, Rank, Percentile, and Skew are directionless.
b) The VixFix version calculates the four data types based on the VixFix calculation. The reason that you would use this version is because it is based on past price data as opposed to a model, and as such is more sensitive to price action. Additionally, because the VixFix is meant to replicate the VIX Index (except it can be applied to any asset) it, just like the real VIX, does have a directional element to it. Because of this, VixFix IV, Rank, and Percentile tend to increase as markets move down, and decrease as markets move up. VixFix skew, on the other hand, is directionless.
How to use this suite of tools:
1st. Pick the way you want your data calculated: either Model-Based or VixFix.
2nd. Input the various length parameters according to their labels:
If you're using the model-based version and are trading options input your time til expiry, including weekends and holidays. You can do so in terms of days, hours, and minutes. If you're using the model-based version but aren't trading options you can just use the default input of 365 days.
If you're using the VixFix version, input how many periods of data you want included in the calculation, this is labeled as "VixFix length". The default value used in this script is 252.
3rd. Finally, pick which data you want displayed from the dropdown menu: Implied Volatility, IV Rank, IV Percentile, or Volatility Skew Index.

Implied Volatility Suite (TG Fork)Displays the Implied Volatility, which is usually calculated from options, but here is calculated indirectly from spot price directly, either using a model or model-free using the VIXfix.
The model-free VIXfix based approach can detect times of high volatility, which usually coincides with panic and hence lowest prices. Inversely, the model-based approach can detect times of highest greed.
Forked and updated by Tartigradia to fix some issues in the calculations, convert to pinescript v5 and reverse engineered to reproduce the "Implied Volatility Rank & Model Free IVR" indicator by the same author (but closed source) and allow to plot both model-based and model-free implied volatilities simultaneously.
If you like this indicator, please show the original author SegaRKO some love:
Implied Volatility PercentileThis script calculates the Implied Volatility (IV) based on the daily returns of price using a standard deviation. It then annualizes the 30 day average to create the historical Implied Volatility. This indicator is intended to measure the IV for options traders but could also provide information for equities traders to show how price is extended in the expected price range based on the historical volatility.
The IV Rank (Green line) is then calculated by looking at the high and low volatility over the number of days back specified in the input parameter, default is 252 (trading days in 1 year) and then calculating the rank of the current IV compared to the High and Low. This is not as reliable as the IV Percentile as the and extreme high or low could have a side effect on the ranking but it is included for those that want to use.
The IV Percentile is calculated by counting the number of days below the current IV, then returns this as a % of the days back in the input
You can adjust the number of days back to check the IV Rank & IV Percentile if you are not wanting to look back a whole year.
This will only work on Daily or higher timeframe charts.

Implied Orderblock Breaker (Zeiierman)█ Overview
The Implied Order Block Breaker (Zeiierman) is a tool designed to identify enhanced order blocks with imbalances. These enhanced order blocks represent areas where there is a rapid price movement. Essentially, this indicator uses order blocks and suggests that a swift price movement away from these levels, breaking the current market structure, could indicate an area that the market has not correctly valued. This technique offers traders a unique method to identify potential market inefficiencies and imbalances, serving as a guide for potential price revisits.
The indicator doesn't scan for imbalances in the traditional sense — where there's an absence of trades between two price levels — but instead, it identifies quick movements away from key levels that suggest where an imbalance might exist. Relying on crossovers and cross-unders in conjunction with pivot points and examining the high/low within the same period provides an innovative method for traders to spot these potentially undervalued or overvalued areas in the market. These inferred imbalances can be crucial for traders looking for price levels where the market might make significant moves.
█ How It Works
Bullish
Crossover: The closing price of a bar crosses above a pivot high, which is an indication that buyers are in control and pushing the price upwards.
New Low Within Period: There is a lower low within the same period as the pivot high. This suggests that after setting a high, the market pulled back to set a new low, potentially leaving a price gap on the way up as the price quickly recovers.
Bearish
Crossunder: The closing price of a bar crosses under a pivot low, indicating that sellers are taking control and driving the price down.
New High Within Period: There is a higher high within the same period as the pivot low. This condition suggests that the market rallied to a new high before falling back below the pivot low, potentially leaving a gap on the way down.
█ How to Use
The enhanced order blocks are often revisited, and the price may aim to 'fill' the potential imbalance created by the rapid price movement, thereby presenting traders with potential entry or exit points. This approach aligns with the idea that imbalances are frequently revisited by the market, and when combined with the context of Order Blocks, it provides even more confluence.
Example
Here, if the price drops rapidly after setting a new high—crossing under the pivot low—it may skip over certain price levels, creating a 'gap' that signifies an area where the price might have been overvalued (imbalance), which the market may revisit for a potential price correction or revaluation.
█ Settings
Period: Determines the number of bars used for identifying pivot highs and lows. A higher value gives more significant but less frequent signals, while a lower value increases sensitivity but might give more false positives.
Pivot Surrounding: Specifies the number of candles to analyze around a pivot point. Increasing this value broadens the analysis range, potentially capturing more setups but possibly including less significant ones.
-----------------
Disclaimer
The information contained in my Scripts/Indicators/Ideas/Algos/Systems does not constitute financial advice or a solicitation to buy or sell any securities of any type. I will not accept liability for any loss or damage, including without limitation any loss of profit, which may arise directly or indirectly from the use of or reliance on such information.
All investments involve risk, and the past performance of a security, industry, sector, market, financial product, trading strategy, backtest, or individual's trading does not guarantee future results or returns. Investors are fully responsible for any investment decisions they make. Such decisions should be based solely on an evaluation of their financial circumstances, investment objectives, risk tolerance, and liquidity needs.
My Scripts/Indicators/Ideas/Algos/Systems are only for educational purposes!

Implied Fair Value Gap (IFVG) ICT [TradingFinder] Hidden FVG OTE🔵 Introduction
The Implied Fair Value Gap (IFVG) is distinctive due to its unique three-candlestick formation, which differentiates it from conventional Fair Value Gaps.
Implied fair value represents an estimated worth of an asset—often a business or its goodwill—based on the price likely to be received in a structured transaction between market participants at a specific point in time.
In the ever-evolving world of technical analysis, pinpointing price reversal points and market anomalies can significantly enhance trading strategies and decision-making for traders and investors. Among the advanced concepts gaining traction in this field is the Implied Fair Value Gap (IFVG), introduced by the renowned analyst Inner Circle Trader (ICT).
This tool has proven to be an effective method for identifying hidden supply and demand zones in financial markets, offering a unique edge to traders looking for high-probability setups.
Unlike traditional gaps that are visible on price charts, IFVG is a hidden gap that doesn’t appear explicitly on the chart and thus requires specialized technical analysis tools for accurate identification.
This hidden gap can signal potential price reversals and offers traders insight into high-liquidity areas where price is likely to react. This article will guide you through using the ICT Implied Fair Value Gap Indicator effectively, covering its settings, usage strategies, and key features to help you make informed decisions in the market.
🟣 Bullish Implied FVG
🟣 Bearish Implied FVG
🔵 How to Use
The IFVG indicator is designed to assist traders in recognizing hidden support and resistance zones by identifying Bullish and Bearish IFVG patterns. With this tool, traders can make better-informed decisions about suitable entry and exit points for their trades based on these patterns.
🟣 Bullish Implied Fair Value Gap
This pattern occurs in an uptrend when a large bullish candlestick forms, with the wicks of the previous and following candles overlapping the body of the central candlestick.
This overlap creates a demand zone or a hidden support level, which can act as an ideal entry point for buy trades. Often, when the price returns to this area, it is likely to resume its upward trend, presenting a profitable buying opportunity.
🟣 Bearish Implied Fair Value Gap
This pattern is similar but forms in downtrends. Here, a large bearish candlestick appears on the chart, with the wicks of adjacent candles overlapping its body. This overlap defines a supply zone or a hidden resistance level and serves as a signal for potential sell trades.
When the price returns to this zone, it often continues its downward trend, providing an optimal point for entering sell trades.
The IFVG indicator also includes various filters that traders can use to refine their analysis based on market conditions. These filters, including Very Aggressive, Aggressive, Defensive, and Very Defensive, allow users to customize the IFVG zones' width, offering flexibility according to the trader’s risk tolerance and trading style.
🟣 Example Trading Scenarios
Suppose you’re in a strong uptrend and the IFVG indicator identifies a Bullish IFVG zone. In this scenario, you could consider entering a buy trade when the price retraces to this zone, expecting the uptrend to resume. Conversely, in a downtrend, a Bearish IFVG zone can signal a favorable entry point for short trades when the price revisits this area.
🔵 Settings
Implied Block Validity Period: This parameter specifies the validity period of each identified block, taking into account the number of bars that have passed since its formation. Proper adjustment of this period helps traders focus only on relevant zones, increasing the accuracy of the analysis.
Mitigation Level OB : This option defines the mitigation level for supply and demand blocks (Order Blocks), with settings including Proximal, 50% OB, and Distal.
Depending on the selected level, the indicator will focus on closer, mid-range, or farther points for block identification, allowing traders to adjust for the level of precision required.
Implied Filter : Activating this filter allows traders to apply conditions based on the width of the IFVG zones. With options like Very Aggressive and Very Defensive, traders can control the width of IFVG zones to suit their risk management strategy—whether they prefer high-risk setups or low-risk setups.
Display and Color Settings : This section enables users to customize the appearance of the IFVG zones on their charts. Traders can set different colors for Bullish and Bearish zones, allowing for easier distinction and improved visualization.
Alert Settings : One of the standout features of the IFVG indicator is the alert system. By setting up alerts, users can be notified whenever the price approaches a demand or supply zone.
Alerts can be customized to trigger Once Per Bar (one alert per bar) or Per Bar Close (alert at the close of each bar), ensuring that traders stay updated on critical price movements without needing to monitor the chart continuously.
🔵 Conclusion
The ICT Implied Fair Value Gap (IFVG) indicator is a powerful and sophisticated tool in technical analysis, allowing professional traders to identify hidden supply and demand zones and use them as entry and exit points for buy and sell trades.
This indicator’s automatic detection of IFVG zones helps traders uncover hidden trading opportunities that can enhance their analysis.
While the IFVG indicator offers numerous advantages, it is important to use it in conjunction with other technical analysis tools and sound risk management practices.
IFVG alone does not guarantee profitability in trading; it works best when combined with other indicators such as volume analysis and trend-following indicators for a comprehensive trading strategy.

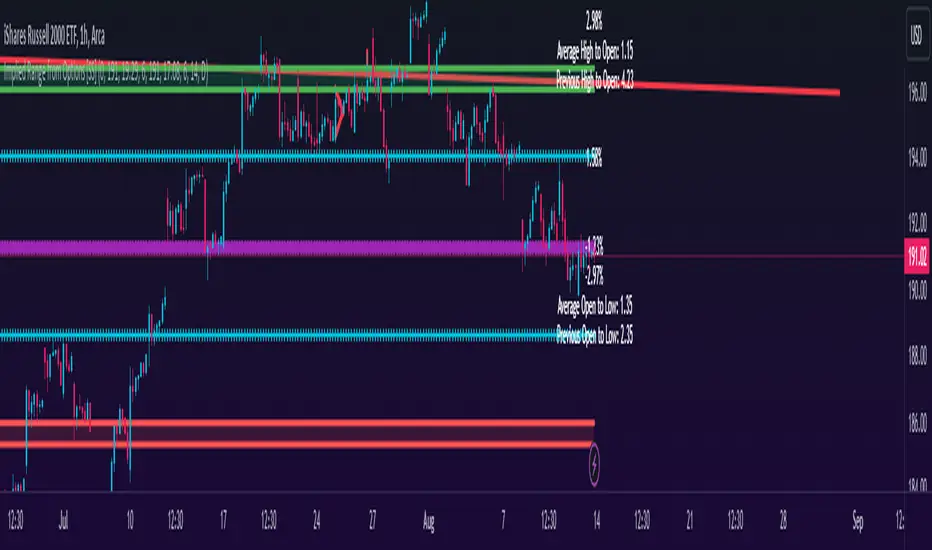
Implied Range from Options [SS]I have been promising to post this for a while, but I just needed to make sure that a) there were no similar indicators already available and b) make it a bit more user friendly.
So here it is, a basic indicator that will display the implied range from options.
In addition to displaying the implied range from options, it will provide some secondary information to help add context to the implied range. Those are shown in the chart below:
The indicator will list various precents at each point to the upside and to the downside. This is the percent move required, based on the current close price, to obtain any point in the implied move range.
In addition, the indicator will display the average move from open to high and open to low over a user defined period (default to 14 candle period) as well as the previous open to high and open to low move from the previous day.
This is to give you context of:
a) How much of a % increase or decrease is required to reach the implied ranges; and
b) How does the implied range compare to the ticker's average moves.
An increased implied range that exceeds the ticker's average move can alert you that the market is pricing in an above average move. This can be helpful and alert you to potential news releases or other fundamental things that have the potential to move the market.
How to Use the indicator:
So unfortunately, this indicator requires a bit of manual input. I was going to do an auto IV calculcation using Black-Scholes Model but just to be more rigorous in accuracy, I decided to, for now, leave it at a manual input. So when you launch the settings menu, this is what you will see:
You can collect all of this required information from your broker. Inversely, you can collect it online for free from various services such as Barchart or COBE's exchange website. The easiest way is to just pull it from your broker though.
Make sure, if you are doing weekly options to see the weekly range, you set the timeframe to 1 week. The timeframe function will calculate the average move over the desired timeframe length. So if you are doing a 0 dte for the next day, you want to see the intra-day range and will select the 1 day timeframe. It will then present to you the range averages and information on the daily timeframe for you to compare to the implied options range.
Same for the weekly, monthly, yearly, etc.
Additional options:
The indicator provides the midline average and midway points, to add static targets if you are trading the implied range.
These can be toggled on or off in the settings menu:
As well, as you can see, you can also toggle off the range labels.
There is also an offset option. This allows you to extend the range into the future:
Simply select how many candles you would like to plot the range in advance.
Closing remarks
That is the indicator. Its very simple, but it is handy. I was never one to pay attention to option pricing data, but I have been plotting it out daily and weekly these past few weeks and it does add a bit of context in terms of what the market is thinking. So I do recommend actually adding it to your repertoire of analyses going into the weeks and months, and really just paying attention to how the average ranges compare to what the market is pricing in.
One quick suggestion, select the strike price that aligns with the closing price of the ticker. This gives you a better representation of the range.
Safe trades everyone and leave your comments, questions and suggestions below!
VIX Implied Move Bands for ES/Emini futuresThis script uses the close of the VIX on a daily resolution to provide the 'implied move' for the E-mini SP500 futures. While it can be applied to any equity index, it's crucial to know that the VIX is calculated using SPX options, and may not reflect the implied volatility of other indices. The user can adjust the length of the moving average used to calculate the bands, the window of days used to calculate the implied move, and the multiplier that effects the width of the bands.

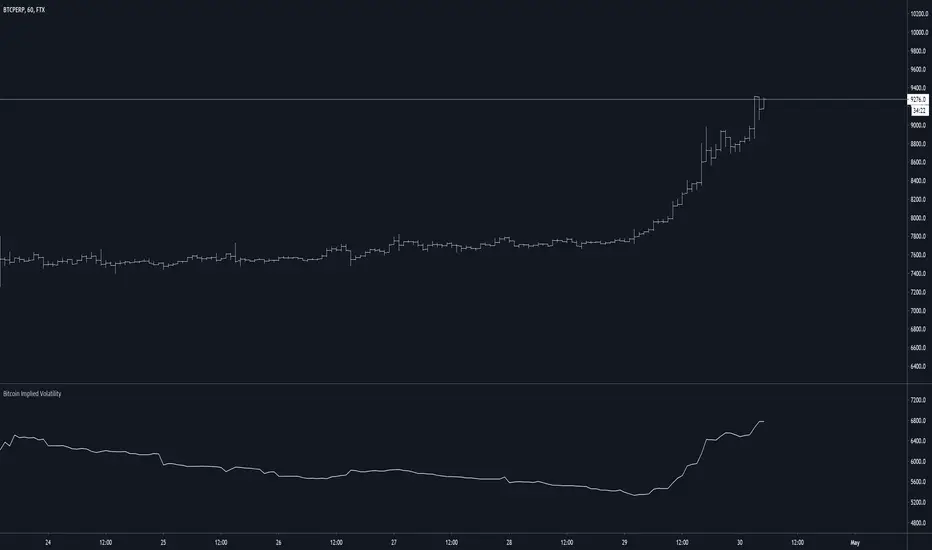
Bitcoin Implied VolatilityThis simple script collects data from FTX:BVOLUSD to plot BTC’s implied volatility as a standalone indicator instead of a chart.
Implied volatility is used to gauge future volatility and often used in options trading.
ICT Implied Fair Value Gap (IFVG) [LuxAlgo]An Implied Fair Value Gap (IFVG) is a three candles imbalance formation conceptualized by ICT that is based on detecting a larger candle body & then measuring the average between the two adjacent candle shadows.
This indicator automatically detects this imbalance formation on your charts and can be extended by a user set number of bars.
The IFVG average can also be extended until a new respective IFVG is detected, serving as a support/resistance line.
Alerts for the detection of bullish/bearish IFVG's are also included in this script.
🔶 SETTINGS
Shadow Threshold %: Threshold percentage used to filter out IFVG's with low adjacent candles shadows.
IFVG Extension: Number of bars used to extend highlighted IFVG's areas.
Extend Averages: Extend IFVG's averages up to a new detected respective IFVG.
🔶 USAGE
Users of this indicator can primarily find it useful for trading imbalances just as they would for trading regular Fair Value Gaps or other imbalances, which aims to highlight a disparity between supply & demand.
For trading a bullish IFVG, users can find this imbalance as an area where price is likely to fill or act as an area of support.
In the same way, a user could trade bearish IFVGs by seeing it as a potential area to be filled or act as resistance within a downtrend.
Users can also extend the IFVG averages and use them as longer-term support/resistances levels. This can highlight the ability of detected IFVG to provide longer term significant support and resistance levels.
🔶 DETAILS
Various methods have been proposed for the detection of regular FVG's, and as such it would not be uncommon to see various methods for the implied version.
We propose the following identification rules for the algorithmic detection of IFVG's:
🔹 Bullish
Central candle body is larger than the body of the adjacent candles.
Current price low is higher than high price two bars ago.
Current candle lower shadow makes up more than p percent of its total candle range.
Candle upper shadow two bars ago makes up more than p percent of its total candle range.
The average of the current candle lower shadow is greater than the average of the candle upper shadow two bars ago.
where p is the user set threshold.
🔹 Bearish
Central candle body is larger than the body of the adjacent candles.
Current price high is higher than low price two bars ago.
Current candle upper shadow makes up more than p percent of its total candle range.
Candle lower shadow two bars ago makes up more than p percent of its total candle range.
The average of the candle lower shadow 2 bars ago is greater than the average of the current candle higher shadow.
where p is the user set threshold.
🔶 SUPPLEMENTARY MATERIAL
You can see our previously posted script that detects various imbalances as well as regular Fair Value Gaps which have very similar usability to Implied Fair Value Gaps here:

Implied SPX from ES Implied SPX from ES Futures (ETH)
Description:
This script calculates the implied SPX index level based on real-time ES futures pricing during extended trading hours (ETH). It uses the spread between the previous day’s ES and SPX RTH closes to adjust for fair value and intraday divergence.
📈 Features:
Tracks current ES price vs. yesterday's RTH spread to estimate SPX
Useful for SPX options traders who want to monitor synthetic index levels during ETH
Ideal for assessing SPX movement when the cash market is closed
This tool is especially helpful for those trading SPX index options overnight or seeking to align SPX levels with ES futures movement.

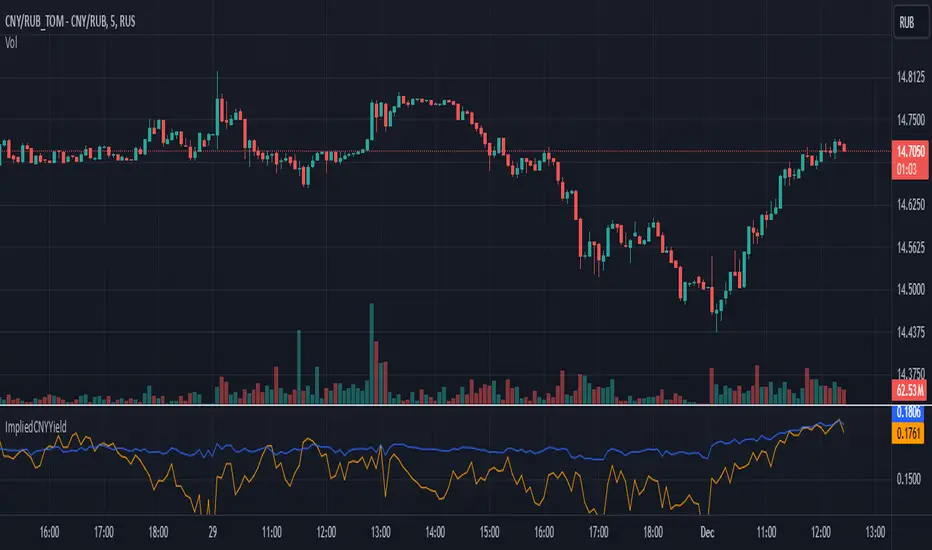
Implied Correlation Divergence OscillatorImplied Correlation Divergence Oscillator (ICDO)
ICDO uses an SMA calculation as a low-pass filter to determine divergences from trend. This can be useful for multiple strategies, including detecting overbought or oversold trends, and finding dispersion opportunities, including zero delta straddle plays using options for indices and single assets within the S&P 500 Index.
The aim of the oscillator is to provide a unique perspective on the existing signals provided by the CBOE (Chicago Board Options Exchange)
First choose from a variety of Implied Correlation symbols including: COR1M, COR3M, COR6M, COR9M, COR1Y, COR10D, COR30D, COR70D, COR90D
Then once an IC signal is chosen, configure the moving average (MA) as a customized low-pass filter that will determine the sensitivity of the divergence signal.
The resulting signal is an oscillator around the zero bound, which is color coded for bullish (green), or (bearish) signals.

EWMA Implied Volatility based on Historical VolatilityVolatility is the most common measure of risk.
Volatility in this sense can either be historical volatility (one observed from past data), or it could implied volatility (observed from market prices of financial instruments.)
The main objective of EWMA is to estimate the next-day (or period) volatility of a time series and closely track the volatility as it changes.
The EWMA model allows one to calculate a value for a given time on the basis of the previous day's value.
The EWMA model has an advantage in comparison with SMA, because the EWMA has a memory.
The EWMA remembers a fraction of its past by a factor A, that makes the EWMA a good indicator of the history of the price movement if a wise choice of the term is made.
Full details regarding the formula :
www.investopedia.com
In this scenario, we are looking at the historical volatility using the anual length of 252 trading days and a monthly length of 21.
Once we apply all of that we are going to get the yearly volatility.
After that we just have to divide that by the square root of number of days in a year, or weeks in a year or months in a year in order to get the daily/weekly/monthly expected volatility.
Once we have the expected volatility, we can estimate with a high chance where the market top and bottom is going to be and continue our analysis on that premise.
If you have any questions, please let me know !

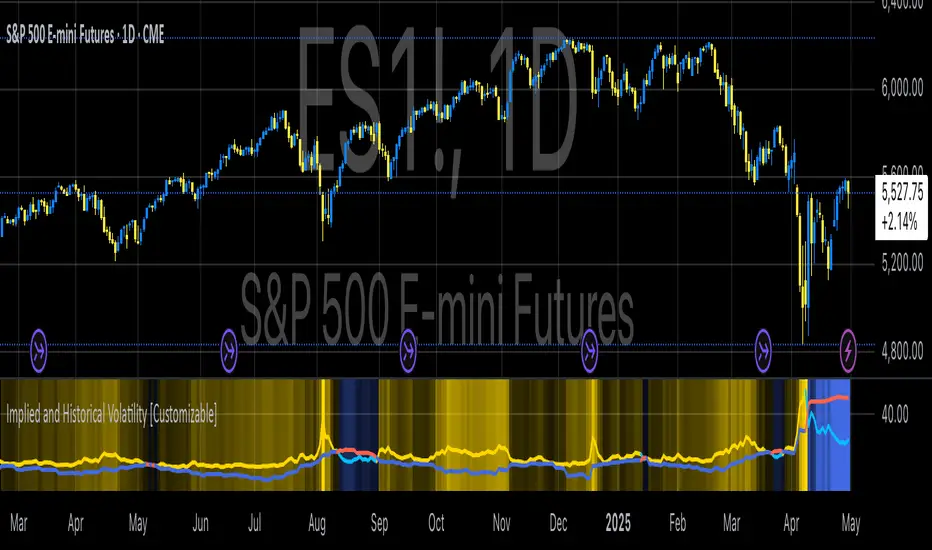
Implied and Historical VolatilityAbstract
This TradingView indicator visualizes implied volatility (IV) derived from the VIX index and historical volatility (HV) computed from past price data of the S&P 500 (or any selected asset). It enables users to compare market participants' forward-looking volatility expectations (via VIX) with realized past volatility (via historical returns). Such comparisons are pivotal in identifying risk sentiment, volatility regimes, and potential mispricing in derivatives.
Functionality
Implied Volatility (IV):
The implied volatility is extracted from the VIX index, often referred to as the "fear gauge." The VIX represents the market's expectation of 30-day forward volatility, derived from options pricing on the S&P 500. Higher values of VIX indicate increased uncertainty and risk aversion (Whaley, 2000).
Historical Volatility (HV):
The historical volatility is calculated using the standard deviation of logarithmic returns over a user-defined period (default: 20 trading days). The result is annualized using a scaling factor (default: 252 trading days). Historical volatility represents the asset's past price fluctuation intensity, often used as a benchmark for realized risk (Hull, 2018).
Dynamic Background Visualization:
A dynamic background is used to highlight the relationship between IV and HV:
Yellow background: Implied volatility exceeds historical volatility, signaling elevated market expectations relative to past realized risk.
Blue background: Historical volatility exceeds implied volatility, suggesting the market might be underestimating future uncertainty.
Use Cases
Options Pricing and Trading:
The disparity between IV and HV provides insights into whether options are over- or underpriced. For example, when IV is significantly higher than HV, options traders might consider selling volatility-based derivatives to capitalize on elevated premiums (Natenberg, 1994).
Market Sentiment Analysis:
Implied volatility is often used as a proxy for market sentiment. Comparing IV to HV can help identify whether the market is overly optimistic or pessimistic about future risks.
Risk Management:
Institutional and retail investors alike use volatility measures to adjust portfolio risk exposure. Periods of high implied or historical volatility might necessitate rebalancing strategies to mitigate potential drawdowns (Campbell et al., 2001).
Volatility Trading Strategies:
Traders employing volatility arbitrage can benefit from understanding the IV/HV relationship. Strategies such as "long gamma" positions (buying options when IV < HV) or "short gamma" (selling options when IV > HV) are directly informed by these metrics.
Scientific Basis
The indicator leverages established financial principles:
Implied Volatility: Derived from the Black-Scholes-Merton model, implied volatility reflects the market's aggregate expectation of future price fluctuations (Black & Scholes, 1973).
Historical Volatility: Computed as the realized standard deviation of asset returns, historical volatility measures the intensity of past price movements, forming the basis for risk quantification (Jorion, 2007).
Behavioral Implications: IV often deviates from HV due to behavioral biases such as risk aversion and herding, creating opportunities for arbitrage (Baker & Wurgler, 2007).
Practical Considerations
Input Flexibility: Users can modify the length of the HV calculation and the annualization factor to suit specific markets or instruments.
Market Selection: The default ticker for implied volatility is the VIX (CBOE:VIX), but other volatility indices can be substituted for assets outside the S&P 500.
Data Frequency: This indicator is most effective on daily charts, as VIX data typically updates at a daily frequency.
Limitations
Implied volatility reflects the market's consensus but does not guarantee future accuracy, as it is subject to rapid adjustments based on news or events.
Historical volatility assumes a stationary distribution of returns, which might not hold during structural breaks or crises (Engle, 1982).
References
Black, F., & Scholes, M. (1973). "The Pricing of Options and Corporate Liabilities." Journal of Political Economy, 81(3), 637-654.
Whaley, R. E. (2000). "The Investor Fear Gauge." The Journal of Portfolio Management, 26(3), 12-17.
Hull, J. C. (2018). Options, Futures, and Other Derivatives. Pearson Education.
Natenberg, S. (1994). Option Volatility and Pricing: Advanced Trading Strategies and Techniques. McGraw-Hill.
Campbell, J. Y., Lo, A. W., & MacKinlay, A. C. (2001). The Econometrics of Financial Markets. Princeton University Press.
Jorion, P. (2007). Value at Risk: The New Benchmark for Managing Financial Risk. McGraw-Hill.
Baker, M., & Wurgler, J. (2007). "Investor Sentiment in the Stock Market." Journal of Economic Perspectives, 21(2), 129-151.
Implied Volatility LevelsOverview:
The Implied Volatility Levels Indicator is a powerful tool designed to visualize different levels of implied volatility on your trading chart. This indicator calculates various implied volatility levels based on historical price data and plots them as dynamic dotted lines, helping traders identify significant market thresholds and potential reversal points.
Features:
Multi-Level Implied Volatility: The indicator calculates and plots multiple levels of implied volatility, including the mean and both positive and negative standard deviation multiples.
Dynamic Updates: The levels update in real-time, reflecting the latest market conditions without cluttering your chart with outdated information.
Customizable Parameters: Users can adjust the lookback period and the standard deviation multiplier to tailor the indicator to their trading strategy.
Visual Clarity: Implied volatility levels are displayed using distinct colors and dotted lines, providing clear visual cues without obstructing the view of price action.
Support for Multiple Levels: Includes additional levels (up to ±5 standard deviations) for in-depth market analysis.
How It Works:
The indicator computes the standard deviation of the closing prices over a user-defined lookback period. It then calculates various implied volatility levels by adding and subtracting multiples of this standard deviation from the mean price. These levels are plotted as dotted lines on the chart, offering traders a clear view of the current market's volatility landscape.
Usage:
Identify Key Levels: Use the plotted lines to spot potential support and resistance levels based on implied volatility.
Analyze Market Volatility: Understand how volatile the market is relative to historical data.
Plan Entry and Exit Points: Make informed trading decisions by observing where the price is in relation to the implied volatility levels.
Parameters:
Lookback Period (Days): The number of days to consider for calculating historical volatility (default is 252 days).
Standard Deviation Multiplier: A multiplier to adjust the distance of the levels from the mean (default is 1.0).
This indicator is ideal for traders looking to incorporate volatility analysis into their technical strategy, providing a robust framework for anticipating market movements and potential reversals.
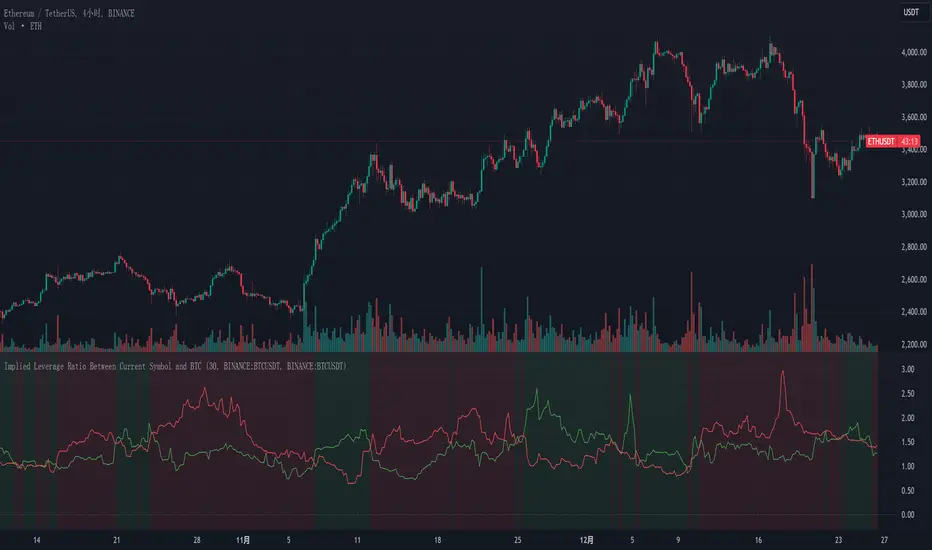
Implied Leverage Ratio Between Current Symbol and BTCThis script calculates and visualizes the implied leverage ratio between the current symbol and Bitcoin (BTC). The implied leverage ratio is computed by comparing the cumulative price changes of the two symbols over a defined number of candles. The results provide insights into how the current symbol performs relative to BTC in terms of bullish (upward) and bearish (downward) movements.
Features
Cumulative Up and Down Ratios:
The script calculates the cumulative price increase (up) and decrease (down) ratios for both the current symbol and BTC. These ratios are based on the percentage changes relative to each candle's opening price.
Implied Leverage Ratio:
For bullish movements, the cumulative up ratio of the current symbol is divided by BTC's cumulative up ratio.
For bearish movements, the cumulative down ratio of the current symbol is divided by BTC's cumulative down ratio.
These values reflect the implied leverage of the current symbol relative to BTC in both directions.
Customizable Comparison Symbol:
By default, the script compares the current symbol to BINANCE:BTCUSDT. However, you can specify any other symbol to tailor the analysis.
Interactive Visualization:
Green Line: Represents the ratio of cumulative up movements (current symbol vs. BTC).
Red Line: Represents the ratio of cumulative down movements (current symbol vs. BTC).
A horizontal zero line is included for reference, ensuring the chart always starts from zero.
How to Use
Add this script to your chart from the Pine Editor or the public library.
Customize the number of candles (t) to define the period over which cumulative changes are calculated.
If desired, replace the comparison symbol with another asset in the input settings.
Analyze the green and red lines to identify relative strength and implied leverage trends.
Who Can Benefit
Traders and Analysts: Gain insights into the relative performance of altcoins, stocks, or other instruments against BTC.
Leverage Seekers: Identify assets with higher or lower implied leverage compared to Bitcoin.
Market Comparisons: Understand how various assets react to market movements relative to BTC.
This tool is particularly useful for identifying potential outperformers or underperformers relative to Bitcoin and can guide strategic decisions in trading pairs or market analysis.