Alt Index - Korean CoinsThis Script attempts to gauge sentiment in the Korean Crypto Market.
Is an equal weighted index of ICX, TRX and STORM.
Cerca negli script per "index"

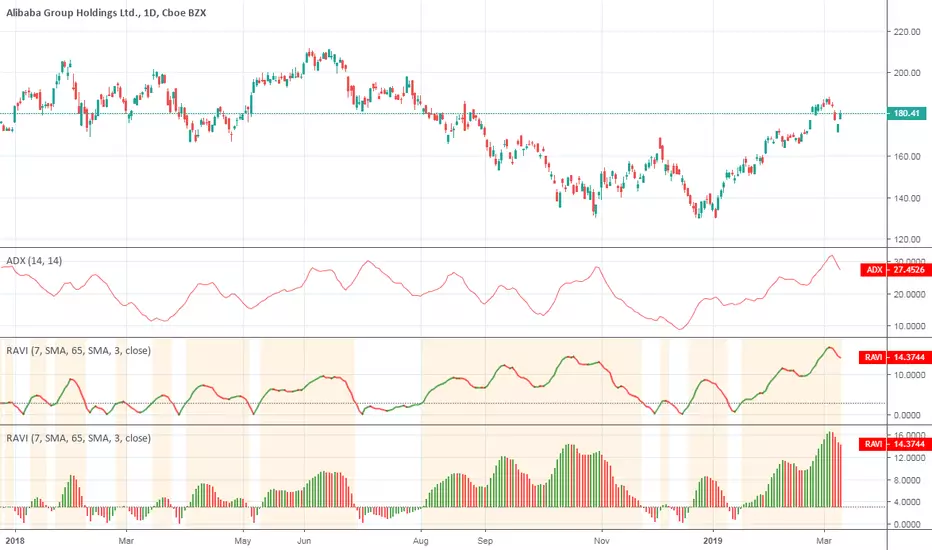
ADX and DI (Average Directional Index) - CORRECT FORMULASo... the popular version of "ADX and DI" shown on tradingview by masanakamura uses some wacky and incorrect formula for DI and uses SMA instead of the Wilder's MA that ADX/DI is supposed to use, and doesn't give the correct ADX and DI values. The Tradingview "Average Directional Index" uses the correct calculation but doesn't show DI+ and DI-. So, here it is with the DI+ and DI- visible. Enjoy!

Range Action Verification Index (RAVI)Range Action Verification Index (RAVI) indicator script. This indicator was originally developed by Tushar Chande (see his book "Beyond Technical Analysis: How to Develop and Implement a Winning Trading System").


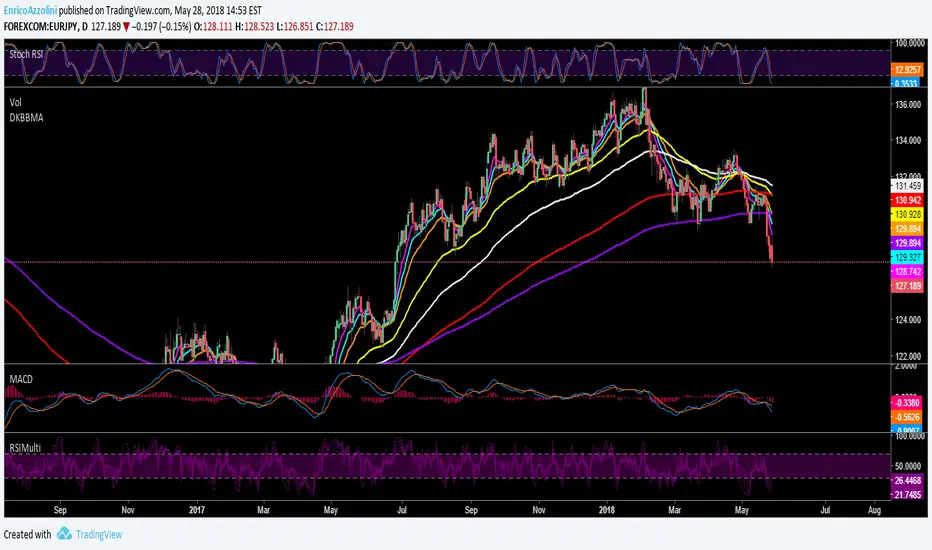
INTRADAY INTENSITY INDEX IIIX by KIVANÇ fr3762DEFINITION of 'Intraday Intensity Index'
A volume based indicator that depicts the flow of funds for a security according to where it closes in its high and low range.
This indicator was developed by Dave Bostian. Its goal is to track the activity of institutional block traders.
A technical indicator that approximates the volume of trading for a specified security in a given day. It is designed to help track the activity of institutional block traders and is calculated by subtracting the day's high and low from double the closing price, divided by the volume and multiplied by the difference between the high and the low.
John BOLLINGER advised to use this indicator as a confirmation tool with the BOLLINGER BANDS .
If price tags the lower BBand, look for IIIX has positive values to enter a trade.
Conversely; If price tags the upper BBand, look for IIIX has negative values to exit.
Developer: David Bostian

Stochastic Momentum IndexStochastic Momentum Index indicator script. This indicator was originally developed by William Blau (Stocks & Commodities V. 11:1 (11-18)).

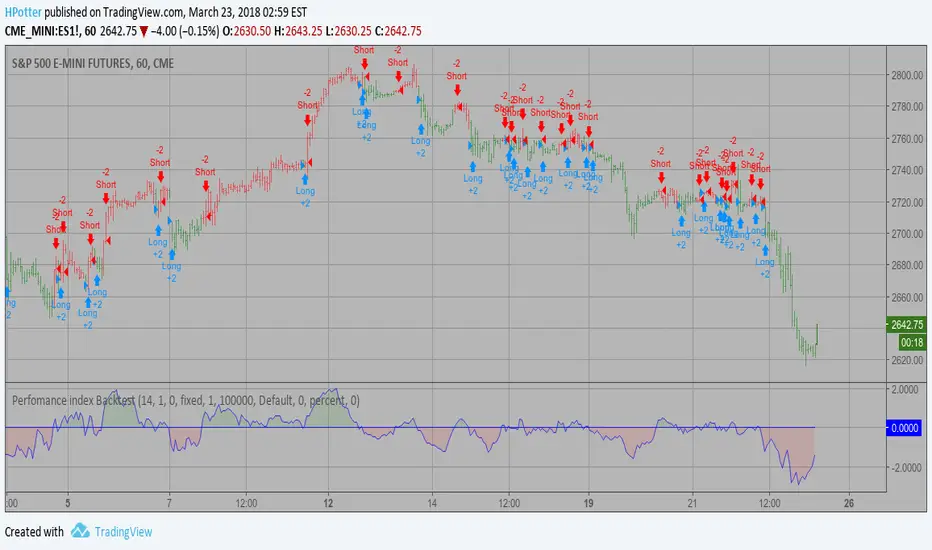
Perfomance index Backtest The Performance indicator or a more familiar term, KPI (key performance indicator),
is an industry term that measures the performance. Generally used by organizations,
they determine whether the company is successful or not, and the degree of success.
It is used on a business’ different levels, to quantify the progress or regress of a
department, of an employee or even of a certain program or activity. For a manager
it’s extremely important to determine which KPIs are relevant for his activity, and
what is important almost always depends on which department he wants to measure the
performance for. So the indicators set for the financial team will be different than
the ones for the marketing department and so on.
Similar to the KPIs companies use to measure their performance on a monthly, quarterly
and yearly basis, the stock market makes use of a performance indicator as well, although
on the market, the performance index is calculated on a daily basis. The stock market
performance indicates the direction of the stock market as a whole, or of a specific stock
and gives traders an overall impression over the future security prices, helping them decide
the best move. A change in the indicator gives information about future trends a stock could
adopt, information about a sector or even on the whole economy. The financial sector is the
most relevant department of the economy and the indicators provide information on its overall
health, so when a stock price moves upwards, the indicators are a signal of good news. On the
other hand, if the price of a particular stock decreases, that is because bad news about its
performance are out and they generate negative signals to the market, causing the price to go
downwards. One could state that the movement of the security prices and consequently, the movement
of the indicators are an overall evaluation of a country’s economic trend.
You can change long to short in the Input Settings
WARNING:
- For purpose educate only
- This script to change bars colors.
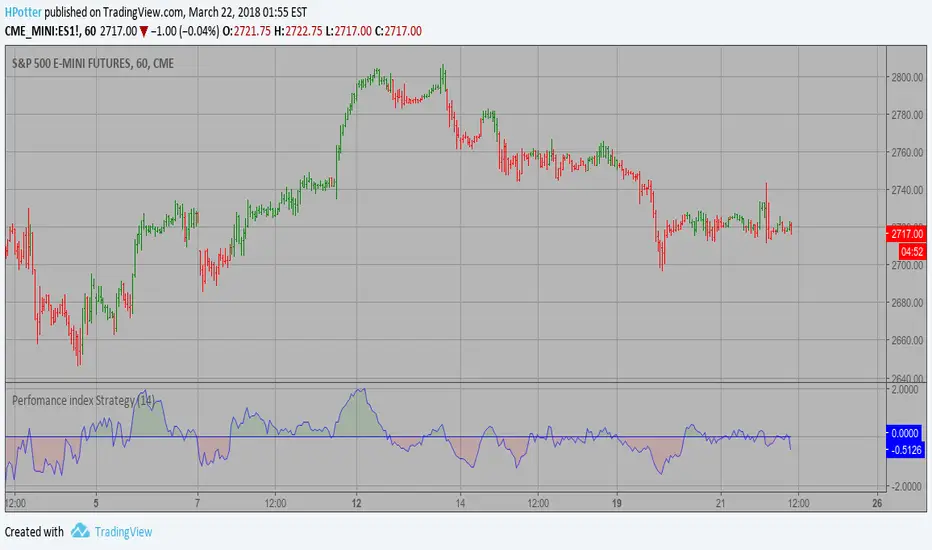
Perfomance index Strategy The Performance indicator or a more familiar term, KPI (key performance indicator),
is an industry term that measures the performance. Generally used by organizations,
they determine whether the company is successful or not, and the degree of success.
It is used on a business’ different levels, to quantify the progress or regress of a
department, of an employee or even of a certain program or activity. For a manager
it’s extremely important to determine which KPIs are relevant for his activity, and
what is important almost always depends on which department he wants to measure the
performance for. So the indicators set for the financial team will be different than
the ones for the marketing department and so on.
Similar to the KPIs companies use to measure their performance on a monthly, quarterly
and yearly basis, the stock market makes use of a performance indicator as well, although
on the market, the performance index is calculated on a daily basis. The stock market
performance indicates the direction of the stock market as a whole, or of a specific stock
and gives traders an overall impression over the future security prices, helping them decide
the best move. A change in the indicator gives information about future trends a stock could
adopt, information about a sector or even on the whole economy. The financial sector is the
most relevant department of the economy and the indicators provide information on its overall
health, so when a stock price moves upwards, the indicators are a signal of good news. On the
other hand, if the price of a particular stock decreases, that is because bad news about its
performance are out and they generate negative signals to the market, causing the price to go
downwards. One could state that the movement of the security prices and consequently, the movement
of the indicators are an overall evaluation of a country’s economic trend.
WARNING:
- This script to change bars colors.

Random Walk IndexRandom Walk Index indicator script. This indicator was originally developed by Michael Poulos.
As you can see, the result is very similar to the Vortex Indicator (was developed by Etienne Botes and Douglas Siepman).

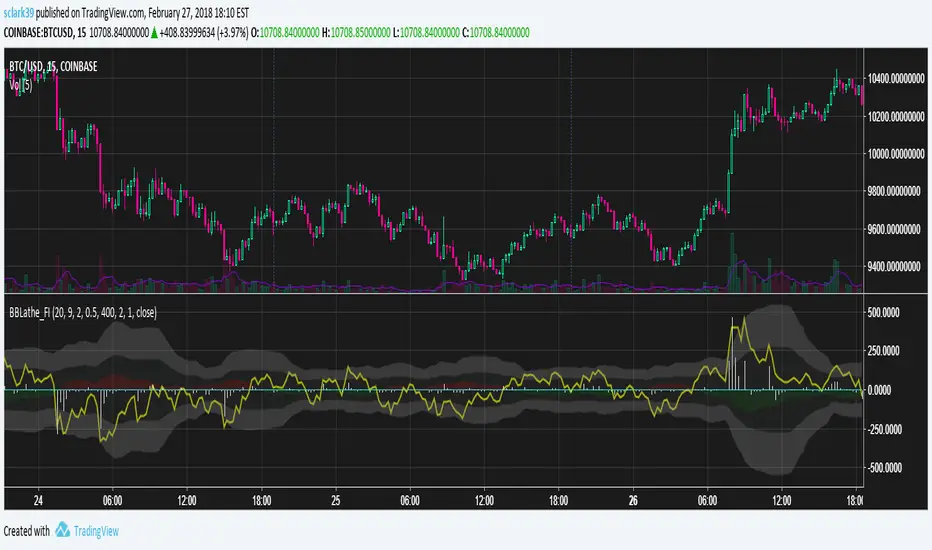
BBLathe2: Bollinger Band Lathe w/ Elder's Force Index [sclark39]Welcome to the second version of the BBLathe!
This shows Bollinger Bands centered on a horizontal basis, to make it easier to see how volatility is changing and identify squeeze opportunities. By default Bollinger bands are calculated using an exponential moving average and an improved higher precision stdev implementation, but this can be disabled. Version 2 also shows Elder's Force Index as a white histogram, so you can see some volume information to help confirm the power of the bears/bulls. The green/red shadow shows how the Bollinger's basis is changing, and when it is going up there will be a green shadow underneath the basis line (this can be inverted in the settings). There is also price line (yellow) showing the location of the price within the Bollinger Bands.
Use this indicator for trades at your own risk, I made this for fun and it is not a trade recommendation.
That being said, if you like my work please tip me!
ETH: 0xf8E0Ea503B5c833fD4546E7fa2c70EcE42A27C8A
Please comment with feedback and requests!
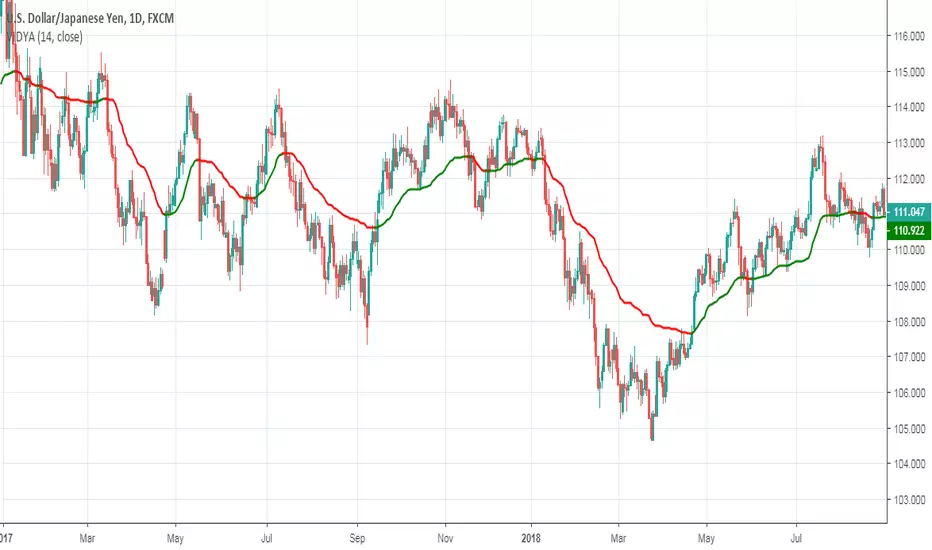
Variable Index Dynamic Average (VIDYA)Variable Index Dynamic Average indicator script based on the original version by Tushar Chande.
Elder's Force Index Double combined by iduThe idea is to see Elder's force index smoothed EMA in different time frame simultaneously.
Default intervals are (2) and (13)
Base on samuel16 script.

BTC Volume IndexBTC volume index for all BFX, GDAX, Stamp, Kraken, and Bitflyer. Also includes an overlay of the volume of the underlying asset (assumed to be BTC at whichever exchange you're viewing.
Happii Trades

AJCrows RSIRelative Strength Index with indicator lines at 20, 30, 50, 70 and 80 marks. Use settings to show/hide these lines, and to choose appropriate colors.

Inverse Fisher Transform on SMI (Stochastic Momentum Index)Inverse Fisher Transform on SMI (Stochastic Momentum Index)
About John EHLERS:
From California, USA, John is a veteran trader. With 35 years trading experience he has seen it all. John has an engineering background that led to his technical approach to trading ignoring fundamental analysis (with one important exception).
John strongly believes in cycles. He’d rather exit a trade when the cycle ends or a new one starts. He uses the MESA principle to make predictions about cycles in the market and trades one hundred percent automatically.
In the show John reveals:
• What is more appropriate than trading individual stocks
• The one thing he relies upon in his approach to the market
• The detail surrounding his unique trading style
• What important thing underpins the market and gives every trader an edge
About INVERSE FISHER TRANSFORM:
The purpose of technical indicators is to help with your timing decisions to buy or
sell. Hopefully, the signals are clear and unequivocal. However, more often than
not your decision to pull the trigger is accompanied by crossing your fingers.
Even if you have placed only a few trades you know the drill.
In this article I will show you a way to make your oscillator-type indicators make
clear black-or-white indication of the time to buy or sell. I will do this by using the
Inverse Fisher Transform to alter the Probability Distribution Function (PDF) of
your indicators. In the past12 I have noted that the PDF of price and indicators do
not have a Gaussian, or Normal, probability distribution. A Gaussian PDF is the
familiar bell-shaped curve where the long “tails” mean that wide deviations from
the mean occur with relatively low probability. The Fisher Transform can be
applied to almost any normalized data set to make the resulting PDF nearly
Gaussian, with the result that the turning points are sharply peaked and easy to
identify. The Fisher Transform is defined by the equation
1)
Whereas the Fisher Transform is expansive, the Inverse Fisher Transform is
compressive. The Inverse Fisher Transform is found by solving equation 1 for x
in terms of y. The Inverse Fisher Transform is:
2)
The transfer response of the Inverse Fisher Transform is shown in Figure 1. If
the input falls between –0.5 and +0.5, the output is nearly the same as the input.
For larger absolute values (say, larger than 2), the output is compressed to be no
larger than unity. The result of using the Inverse Fisher Transform is that the
output has a very high probability of being either +1 or –1. This bipolar
probability distribution makes the Inverse Fisher Transform ideal for generating
an indicator that provides clear buy and sell signals.

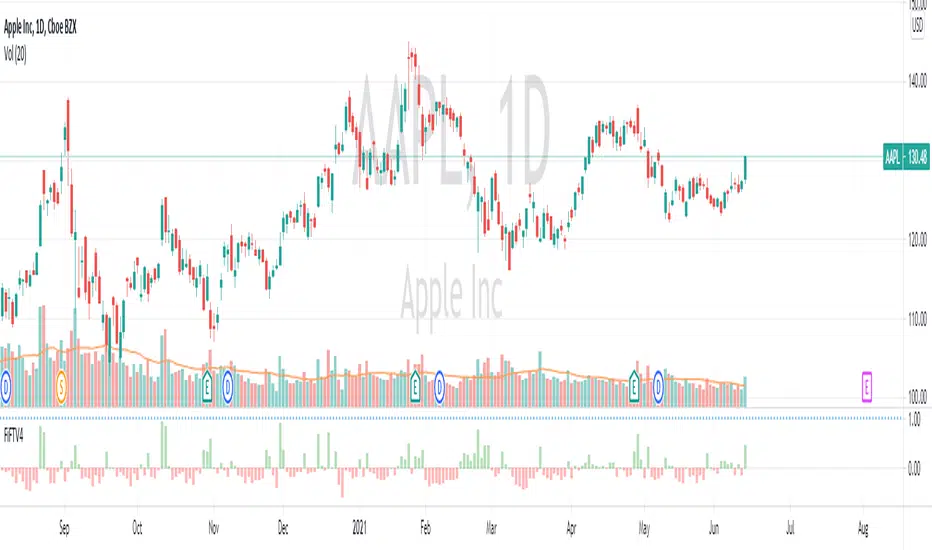
Force Index with Buy on Dip strategyThis charts has 2 indicators
1 - Force Index
This indicator is based on Dr Alexander Elder ForceIndex indicator with relate price to volume by multiplying net change and volume.
- GREEN Bar indicates Bull is in control
- RED Bar indicates Bear is in control.
LENGTH of the bar indicate the strength of Bull or Bear.
Normally there's potential BUY if the RED bar turned GREEN and SELL if GREEN to RED.
2 - Stochastic momentum
Stochastic momentum is to detect potential Reversal where BLUE bar will appear if :-
- Oversold - Stochastic less than 35
- Closing price is higher than last 2 High (Fast Turtle)
// Note : Best use with "EMA Indicators with BUY sell Signal"
Commodity Channel Index Volume BasedCommodity Channel Index Volume Based with WMA as source and a simple moving average.

Relative Volatility Index Backtest The RVI is a modified form of the relative strength index (RSI).
The original RSI calculation separates one-day net changes into
positive closes and negative closes, then smoothes the data and
normalizes the ratio on a scale of zero to 100 as the basis for the
formula. The RVI uses the same basic formula but substitutes the
10-day standard deviation of the closing prices for either the up
close or the down close. The goal is to create an indicator that
measures the general direction of volatility. The volatility is
being measured by the 10-days standard deviation of the closing prices.
You can change long to short in the Input Settings
WARNING:
- For purpose educate only
- This script to change bars colors.

Relative Volatility Index Strategy The RVI is a modified form of the relative strength index (RSI).
The original RSI calculation separates one-day net changes into
positive closes and negative closes, then smoothes the data and
normalizes the ratio on a scale of zero to 100 as the basis for the
formula. The RVI uses the same basic formula but substitutes the
10-day standard deviation of the closing prices for either the up
close or the down close. The goal is to create an indicator that
measures the general direction of volatility. The volatility is
being measured by the 10-days standard deviation of the closing prices.
WARNING:
- This script to change bars colors.
