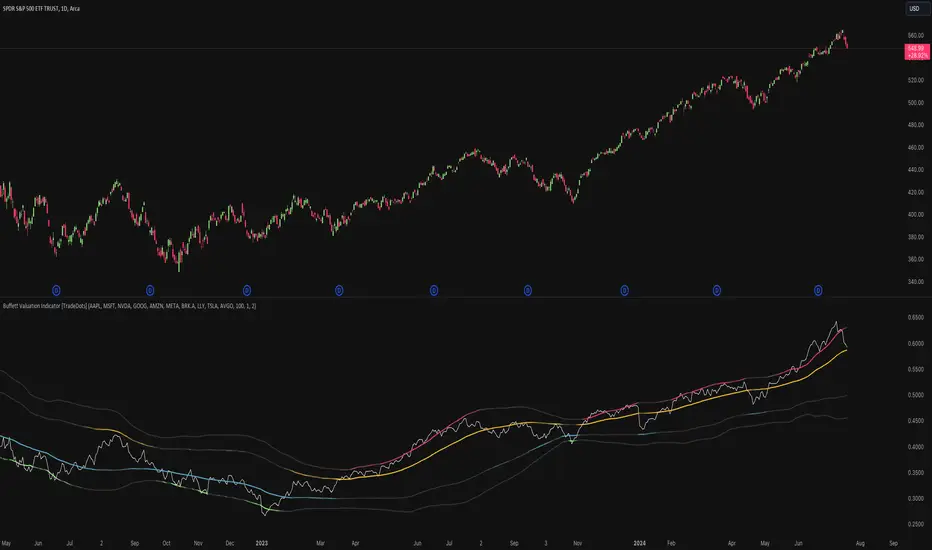
Buffett Valuation Indicator [TradeDots]The Buffett Valuation Indicator (also known as the Buffett Index or Buffett Ratio) measures the ratio of the total United States stock market to GDP.
This indicator helps determine whether the valuation changes in US stocks are justified by the GDP level.
For example, the ratio is calculated based on the standard deviations from the historical trend line. If the value exceeds +2 standard deviations, it suggests that the stock market is overvalued relative to GDP, and vice versa.
This "Buffett Valuation Indicator" is an enhanced version of the original indicator. It applies a Bollinger Band over the Valuation/GDP ratio to identify overvaluation and undervaluation across different timeframes, making it efficient for use in smaller timeframes, e.g. daily or even hourly intervals.
HOW DOES IT WORK
The Buffett Valuation Indicator measures the ratio between US stock valuation and US GDP, evaluating whether stock valuations are overvalued or undervalued in GDP terms.
In this version, the total valuation of the US stock market is represented by considering the top 10 market capitalization stocks.
Users can customize this list to include other stocks for a more balanced valuation ratio. Alternatively, users may use S&P 500 ETFs, such as SPY or VOO, as inputs.
The ratio is plotted as a line chart in a separate panel below the main chart. A Bollinger Band with a default 100-period and multiples of 1 and 2 is used to identify overvaluation and undervaluation.
For instance, if the ratio line moves above the +2 standard deviation line, it indicates that stocks are overvalued, signaling a potential selling opportunity.
APPLICATION
When the indicator is applied to a chart, we observe the ratio line's movements relative to the standard deviation lines. The further the line deviates from the standard deviation lines, the more extreme the overvaluation or undervaluation.
We look for buying opportunities when the Buffett Index moves below the first and second standard deviation lines and sell opportunities when it moves above these lines. This indicator is used as a microeconomic confirmation tool, in combination with other indicators, to achieve higher win-rate setups.
RISK DISCLAIMER
Trading entails substantial risk, and most day traders incur losses. All content, tools, scripts, articles, and education provided by TradeDots serve purely informational and educational purposes. Past performances are not definitive predictors of future results.
Cerca negli script per "indicator"
Volume, Volatility, and Momentum Metrics IndicatorVolume, Volatility, and Momentum Metrics Indicator
Welcome to our comprehensive TradingView indicator designed to provide traders with essential volume, volatility, and momentum metrics. This powerful tool is ideal for traders looking to enhance their market analysis by visualizing key indicators in a concise and easy-to-read format.
Key Features
1. Volume Metrics:
• Daily Dollar Volume: Understand the monetary value of the traded volume each day.
• Relative Volume (RVOL) Day: Compare the current volume to the previous day’s volume to gauge trading activity.
• Relative Volume (RVOL) 30D: Assess the average trading volume over the past 30 days.
• Relative Volume (RVOL) 90D: Evaluate the average trading volume over the past 90 days.
2. Volatility and Momentum Metrics:
• Average Daily Range (ADR) %: Measure the average daily price range as a percentage of the current price.
• Average True Range (ATR): Track the volatility by calculating the average true range over a specified period.
• Relative Strength Index (RSI): Determine the momentum by analyzing the speed and change of price movements.
3. Customizable Table Positions:
• Place the volume metrics table and the volatility/momentum metrics table in the bottom-left or bottom-right corners of your chart for optimal visibility and convenience.
Why Use This Indicator?
• Enhanced Market Analysis: Quickly assess volume trends, volatility, and momentum to make informed trading decisions.
• User-Friendly Interface: The clear and concise tables provide at-a-glance information without cluttering your chart.
• Customization Options: Choose where to display the tables to suit your trading style and preferences.
How It Works
This indicator uses advanced calculations to provide real-time data on trading volume, price range, and momentum. By displaying this information in separate, neatly organized tables, traders can easily monitor these critical metrics without diverting their focus from the main chart.
Who Can Benefit?
• Day Traders: Quickly gauge intraday trading activity and volatility.
• Swing Traders: Analyze longer-term volume trends and momentum to identify potential trade setups.
• Technical Analysts: Utilize comprehensive metrics to enhance technical analysis and trading strategies.
Get Started
To add this powerful indicator to your TradingView chart, simply search for “Volume, Volatility, and Momentum Metrics” in the TradingView public library, or use the provided link to add it directly to your chart. Enhance your trading analysis and make more informed decisions with our comprehensive TradingView indicator.

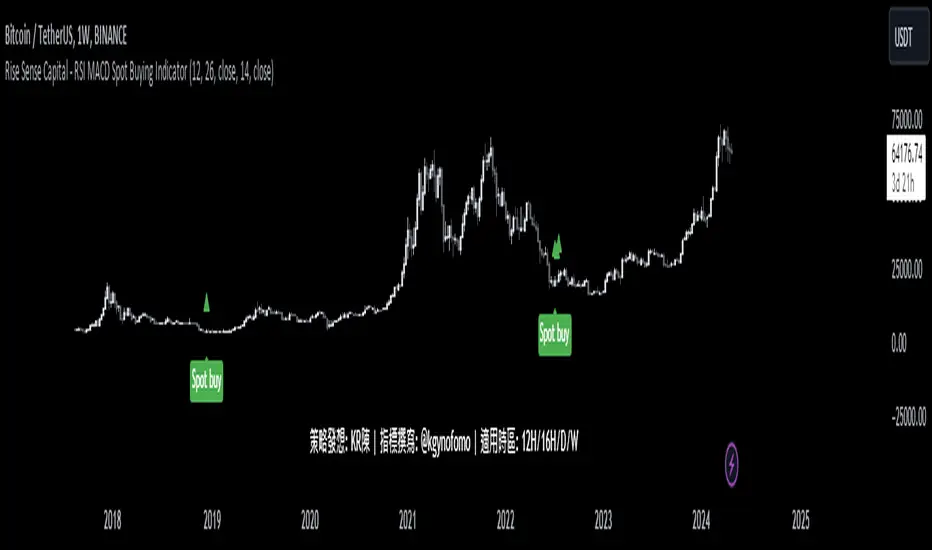
Rise Sense Capital - RSI MACD Spot Buying IndicatorToday, I'll share a spot buying strategy shared by a member @KR陳 within the DATA Trader Alliance Alpha group. First, you need to prepare two indicators:
今天分享一個DATA交易者聯盟Alpha群組裏面的群友@KR陳分享的現貨買入策略。
首先需要準備兩個指標
RSI Indicator (Relative Strength Index) - RSI is a technical analysis tool based on price movements over a period of time to evaluate the speed and magnitude of price changes. RSI calculates the changes in price over a period to determine whether the recent trend is relatively strong (bullish) or weak (bearish).
RSI指標,(英文全名:Relative Strength Index),中文稱為「相對強弱指標」,是一種以股價漲跌為基礎,在一段時間內的收盤價,用於評估價格變動的速度 (快慢) 與變化 (幅度) 的技術分析工具,RSI藉由計算一段期間內股價的漲跌變化,判斷最近的趨勢屬於偏強 (偏多) 還是偏弱 (偏空)。
MACD Indicator (Moving Average Convergence & Divergence) - MACD is a technical analysis tool proposed by Gerald Appel in the 1970s. It is commonly used in trading to determine trend reversals by analyzing the convergence and divergence of fast and slow lines.
MACD 指標 (Moving Average Convergence & Divergence) 中文名為平滑異同移動平均線指標,MACD 是在 1970 年代由美國人 Gerald Appel 所提出,是一項歷史悠久且經常在交易中被使用的技術分析工具,原理是利用快慢線的交錯,藉以判斷股價走勢的轉折。
In MACD analysis, the most commonly used values are 12, 26, and 9, known as MACD (12,26,9). The market often uses the MACD indicator to determine the future direction of assets and to identify entry and exit points.
在 MACD 的技術分析中,最常用的值為 12 天、26 天、9 天,也稱為 MACD (12,26,9),市場常用 MACD 指標來判斷操作標的的後市走向,確定波段漲幅並找到進、出場點。
Strategy analysis by member KR陳:
策略解析 by群友 KR陳 :
Condition 1: RSI value in the previous candle is below oversold zone(30).
條件1:RSI 在前一根的數值低於超賣區(30)
buycondition1 = RSI <30
Condition 2: MACD histogram changes from decreasing to increasing.
條件2:MACD柱由遞減轉遞增
buycondition2 = hist >hist and hist
Bull Bear Trend IndicatorIntroduction: Origin of the Swing Point Indicator
In the quest for a reliable indicator that accurately predicts trend directions and identifies valid highs and lows, the genesis of the Swing Point Indicator emerged. Faced with the challenge of finding a tool that provided comprehensive market analysis and actionable insights, the need for a novel solution became evident. Combining insights gleaned from market analysis and innovative algorithmic approaches, the Swing Point Indicator was born.
Enhanced Feature: Highs and Lows Labeling in Trend Direction
In addition to its core functionalities, the Swing Point Indicator incorporates an advanced feature that enhances the visualization of trend direction. This feature provides further clarity by selectively labeling highs and lows based on the prevailing trend, reinforcing the identification of higher highs and lower lows in uptrends and downtrends, respectively. Overlapping labels on highs and lows signify a potential trend change, providing traders with valuable insight into market reversals.
Detailed Description:
1. Uptrend Labeling:
- Higher Highs (Green Label with Price): In an uptrend, where higher highs are observed, the indicator labels these points with vibrant green color and includes the corresponding price value. This visually highlights the significance of higher highs as pivotal points in the upward trajectory of prices.
- Higher Lows (Red Marker without Text or Diamond): To complement the identification of higher highs, higher lows are marked with a distinct red marker or diamond, devoid of any accompanying text. While these points are crucial in delineating the ascending trend, their emphasis lies in their role as support levels, providing a foundation for upward price movements.
2. Downtrend Labeling:
- Lower Lows (Red Label with Price): Conversely, in a downtrend characterized by lower lows, the indicator labels these points with conspicuous red color, accompanied by the corresponding price value. Lower lows signify critical levels of downward price momentum, acting as indicators of potential bearish continuation.
- Lower Highs (Green Marker without Text or Diamond): Lower highs, indicative of downward retracements in a downtrend, are marked by distinctive green markers or diamonds without accompanying text. While these points denote temporary pauses or pullbacks in the bearish trend, their emphasis lies in their role as resistance levels, impeding upward price movements.
Functionality and Utility:
- Customizable Lookback Candle Count: Traders have the option to adjust the lookback candle count, which is set by default at 108 candles in the settings. This flexibility allows traders to tailor the indicator to their specific trading preferences and timeframes.
- Equal Highs or Lows Option: When enabled, the Swing Point Indicator can identify equal highs or equal lows, providing traders with additional insight into market dynamics.
- Formation Confirmation: A new higher high along with its higher low or a new lower low along with its lower high is confirmed after two candles have closed following the swing point candle. This ensures the reliability of the identified trend direction.
Conclusion:
The incorporation of selective labeling for highs and lows based on trend direction, alongside the introduction of customizable settings and formation confirmation criteria, enhances the effectiveness of the Swing Point Indicator. This feature-rich tool empowers traders with a nuanced understanding of market dynamics, highlighting critical price levels and trend reversals. By offering enhanced visualization, customizable options, and confirmation criteria, the Swing Point Indicator equips traders with the confidence and precision needed to navigate the markets successfully, contributing to more informed and profitable trading strategies.

[The_lurker] RSI-MFI-WPR Indicatoris an advanced trading indicator developed for the TradingView platform, which synergistically refers to the insights of three popular technical analysis tools: the Relative Strength Index (RSI), the Money Flow Index (MFI) and the Williams Indicator. Percentage range (WPR). This indicator is precisely designed to help traders identify potential buy and sell opportunities by accurately interpreting market momentum, volume, and price position relative to recent highs and lows.
The primary goal of the RSI-MFI-WPR Indicator is to provide a comprehensive tool that leverages the combined power of RSI, MFI and WPR to detect overbought and oversold conditions, indicating potential market reversal points. This multi-faceted approach aims to provide traders with a more robust framework for making informed decisions, and enhance their trading strategy through multi-indicator analysis.
Explanation of the indicator conditions
The essence of this indicator lies in its strategic conditions that indicate possible entry and exit points:
Oversold Condition (Condition): This is determined when the RSI and MFI are below 30, and the WPR drops below -91, indicating a strong oversold condition in the market. Such a scenario usually indicates a buying opportunity, assuming that the market may rebound from this oversold state.
Divergence Condition (Condition 1): Checks if the MFI exceeds 2.1 times the RSI. This unique case aims to highlight instances where there is a significant inflow of funds into an asset, which is not proportionately reflected in its RSI, which may indicate an upcoming price increase or highlight an unusual market situation for further From the analysis.
Overbought Warning (conditionExit): An exit signal is triggered when both the MFI and RSI exceed 85, and the WPR is above -15. This combination indicates an overbought condition in the market, indicating that the asset may be overvalued and that a price correction or reversal may be imminent, thus indicating a potential selling opportunity or a warning of initiating new positions.
Application and visualization
The RSI-MFI-WPR Indicator not only provides numerical insights but also displays these conditions on a TradingView chart. Through the use of color coding and plotting, it provides traders with an intuitive way to distinguish market conditions, enabling quick and effective decision-making. Incorporating alert conditions ensures that traders are immediately notified of important market events, in line with their strategic trading objectives.
Planning and alerts in “RSI-MFI-WPR Indicator”
Collected alert status
CombinedAlertCondition is a logical statement that combines all individual conditions (Condition, Condition1, Condition Exit, and The_lurkerMFI_oversold) into a single alert trigger. This condition becomes true and triggers an alert if any of the conditions specified for potential trading opportunities or warnings are met. It is designed to provide a comprehensive alert system that informs the trader of any important signal identified by the indicator, including entry and exit signals as well as oversold conditions.
Visual indicators
Background color for oversold condition: The script sets the background color to a specific shade of blue ( with 90% transparency) when the custom MFI indicates an oversold condition (The_lurkerMFI_oversold). This visual signal helps traders quickly recognize periods when the market may be undervalued and potentially poised for a rebound.
Drawing warning and exit signs:
Entry Signals: For Condition and Condition 1, which identify potential entry points, the indicator draws upward pointing triangles below the price bars. These triangles are colored in specific shades to differentiate signals from a fundamental oversold condition and a divergence condition, making it intuitive for traders to recognize the type of signal.
Exit Signals: For an exit condition, which indicates overbought conditions that may indicate an impending price correction, red downward-pointing triangles are drawn above the price bars. This serves as a clear visual warning to consider exiting positions or proceed with caution.
Configure the alarm
The script uses the conditional alert function to create an alert based on the AlertCondition combination. When this condition is met, any of the predefined signals are indicated
Conclusion
In short, the “RSI-MFI-WPR Indicator” stands out as a versatile and dynamic indicator that enriches a trader's toolkit by combining the analytical strengths of RSI, MFI and WPR. By setting clear conditions for entry and exit points from the market, it facilitates a proactive approach to trading, based on a detailed examination of market dynamics. This indicator demonstrates how mixing multiple technical tools can lead to more informed and accurate market analysis, with the aim of elevating the trading experience on Tradingview.
==================================================================================
هو مؤشر تداول متقدم تم تطويره لمنصة TradingView،
والذي يشير بشكل تآزري إلى رؤى ثلاث أدوات تحليل فني شائعة:
1- مؤشر القوة النسبية (RSI)،
2- مؤشر تدفق الأموال (MFI)،
3- مؤشر ويليامز. نطاق النسبة المئوية (WPR).
تم تصميم هذا المؤشر بدقة لمساعدة المتداولين على تحديد فرص الشراء والبيع المحتملة من خلال التفسير الدقيق لزخم السوق وحجمه وموقع السعر بالنسبة إلى الارتفاعات والانخفاضات الأخيرة.
الهدف الأساسي لمؤشر RSI-MFI-WPR هو توفير أداة شاملة تستفيد من القوة المشتركة لمؤشر RSI وMFI وWPR للكشف عن ظروف ذروة الشراء والمبالغة في البيع، مما يشير إلى نقاط انعكاس السوق المحتملة. ويهدف هذا النهج متعدد الأوجه إلى تزويد المتداولين بإطار أكثر قوة لاتخاذ قرارات مستنيرة، وتعزيز استراتيجية التداول الخاصة بهم من خلال تحليل متعدد المؤشرات.
شرح شروط المؤشر
يكمن جوهر هذا المؤشر في ظروفه الإستراتيجية التي تشير إلى نقاط الدخول والخروج المحتملة:
حالة ذروة البيع (الحالة): يتم تحديد ذلك عندما يكون مؤشر القوة النسبية RSI وMFI أقل من 30، وينخفض WPR إلى أقل من -92، مما يشير إلى حالة ذروة بيع قوية في السوق. يشير مثل هذا السيناريو عادةً إلى فرصة شراء، على افتراض أن السوق قد ينتعش من حالة ذروة البيع هذه.
شرط الاختلاف (الشرط 1): يتحقق مما إذا كانت السيولة تتجاوز 2.1 مرة مؤشر القوة النسبية. تهدف هذه الحالة الفريدة إلى تسليط الضوء على الحالات التي يوجد فيها تدفق كبير للأموال إلى أحد الأصول، وهو ما لا ينعكس بشكل متناسب في مؤشر القوة النسبية الخاص به، مما قد يشير إلى زيادة قادمة في الأسعار أو يسلط الضوء على وضع غير عادي في السوق لمزيد من التحليل.
تحذير ذروة الشراء (conditionExit): يتم إطلاق إشارة خروج عندما يتجاوز مؤشر MFI ومؤشر القوة النسبية 85، ويكون WPR أعلى من -15. يشير هذا المزيج إلى حالة ذروة الشراء في السوق، مما يشير إلى أن الأصل قد يكون مبالغًا في قيمته وأن تصحيح السعر أو انعكاسه قد يكون وشيكًا، مما يشير إلى فرصة بيع محتملة أو تحذير ببدء مراكز جديدة.
التطبيق والتصور
لا يوفر مؤشر RSI-MFI-WPR رؤى رقمية فحسب، بل يعرض أيضًا هذه الشروط على مخطط TradingView. من خلال استخدام الترميز اللوني والتخطيط، فإنه يوفر للمتداولين طريقة بديهية للتمييز بين ظروف السوق، مما يتيح اتخاذ قرارات سريعة وفعالة. يضمن دمج شروط التنبيه إخطار المتداولين على الفور بأحداث السوق المهمة، بما يتماشى مع أهدافهم التجارية الإستراتيجية.
التخطيط والتنبيهات في مؤشر RSI-MFI-WPR
حالة التنبيه التي تم جمعها ( CombinedAlertCondition ) عبارة منطقية تجمع كل الشروط الفردية
Condition، Condition1، Condition Exit، وThe_lurkerMFI_oversold في مشغل تنبيه واحد.
ليصبح هذا الشرط صحيحًا ويطلق تنبيهًا في حالة استيفاء أي من الشروط المحددة لفرص التداول المحتملة أو التحذيرات. وهو مصمم لتوفير نظام تنبيه شامل يُعلم المتداول بأي إشارة مهمة يحددها المؤشر، بما في ذلك إشارات الدخول والخروج بالإضافة إلى ظروف ذروة البيع.
المؤشرات البصرية
لون الخلفية لحالة ذروة البيع: يقوم البرنامج النصي بتعيين لون الخلفية إلى ظل معين من اللون الأزرق (بشفافية 90٪) عندما تشير مؤسسة التمويل الأصغر المخصصة إلى حالة ذروة البيع (The_lurkerMFI_oversold). تساعد هذه الإشارة المرئية المتداولين على التعرف بسرعة على الفترات التي قد تكون فيها السوق مقومة بأقل من قيمتها الحقيقية ومن المحتمل أن تكون مستعدة للانتعاش.
رسم علامات التحذير والخروج:
إشارات الدخول: بالنسبة للحالة والحالة 1، التي تحدد نقاط الدخول المحتملة، يرسم المؤشر مثلثات تشير إلى الأعلى أسفل أشرطة السعر. يتم تلوين هذه المثلثات بظلال محددة لتمييز الإشارات عن حالة ذروة البيع الأساسية وحالة التباعد، مما يجعل من السهل على المتداولين التعرف على نوع الإشارة.
إشارات الخروج: بالنسبة لحالة الخروج، التي تشير إلى ظروف ذروة الشراء التي قد تشير إلى تصحيح وشيك للسعر، يتم رسم مثلثات حمراء تشير إلى الأسفل فوق أشرطة السعر. يعد هذا بمثابة تحذير مرئي واضح للنظر في الخروج من المواقف أو المضي قدمًا بحذر.
تكوين المنبه
يستخدم البرنامج النصي وظيفة التنبيه الشرطي لإنشاء تنبيه بناءً على مجموعة AlertCondition. عند استيفاء هذا الشرط، تتم الإشارة إلى أي من الإشارات المحددة مسبقًا
خاتمة
باختصار، يبرز "مؤشر RSI-MFI-WPR" كمؤشر متعدد الاستخدامات وديناميكي يثري مجموعة أدوات المتداول من خلال الجمع بين نقاط القوة التحليلية لـ RSI وMFI وWPR. ومن خلال وضع شروط واضحة لنقاط الدخول والخروج من السوق، فإنه يسهل اتباع نهج استباقي للتداول، بناءً على فحص تفصيلي لديناميكيات السوق. يوضح هذا المؤشر كيف أن الجمع بين أدوات فنية متعددة يمكن أن يؤدي إلى تحليل سوق أكثر استنارة ودقة، بهدف رفع مستوى تجربة التداول على Tradingview.
==================================================================================
باختصار :
1- ظهور المثلث الاصفر يعني تواجد سيولة كبيره ( مفيد جدا لعملات البومب ) .
2- ظهور المثلث الأبيض يعني وصول الى مستويات تشبع البيع وهي فرصة ممتازه للشراء ( منطقة دخول ).
3- ظهور خط افقي يعني قرب عكس الاتجاه الى أعلى ( منطقة دخول ) .
4- ظهور مثلث أحمر يعني قرب عكس الاتجاه الى أسفل ( منطقة خروج ) .
5- التنبيه يعمل على جميع ما ذكر أعلاه في تنبيه واحد حتى تسهل المراقبة .
6- أفضل فواصل الاستخدام ( 4 ساعات ، 12 ساعه ، يوم ) .

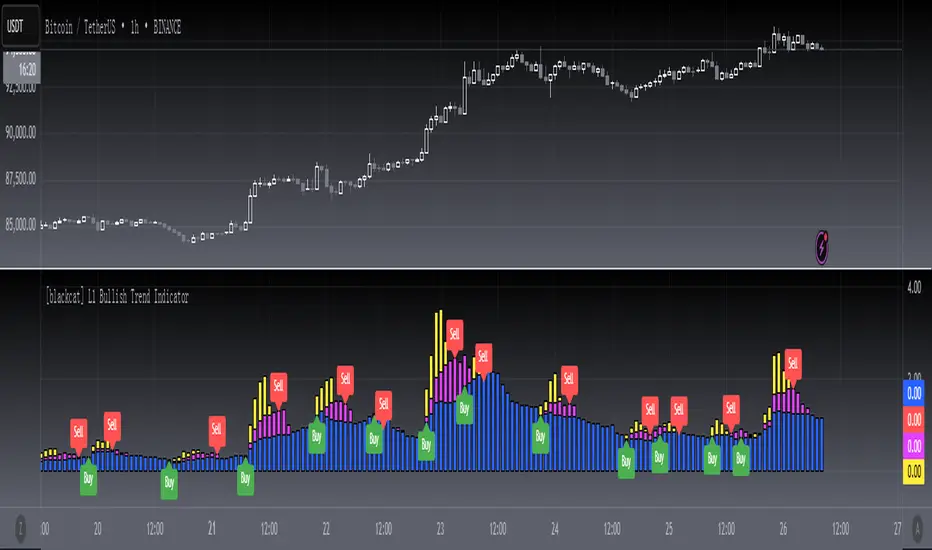
[blackcat] L1 Bullish Trend Indicator
#### Introduction
The " L1 Bullish Trend Indicator" is a unique tool designed for TradingView, tailored to identify and analyze bullish trends in the market. This guide provides an overview of its definition, history, calculation method, operations, and practical trading applications, tailored for both beginners and experienced traders.
#### Definition
- **Role in Technical Analysis**: Primarily identifies bullish trends by analyzing a combination of price and volume data.
- **Type of Indicator**: Classified as a trend indicator, it operates on multiple time frames, offering a comprehensive view of market momentum.
#### Calculation Method
- **Core Calculation**: Combines price action (hlc3 formula) and volume, calculating a series of Simple Moving Averages (SMAs) on this modified factor.
- **Timeframes**: Incorporates short, mid, and long-term analysis through specific length parameters like `len_shortterm1`, `len_midterm`, and `len_longterm`.
- **Output Interpretation**: Proportions calculated from SMAs indicate the relative strength of trends across different timeframes.
#### Basic Operations
- **Comparison with Similar Indicators**: Similar to SMAs and MACD but provides a more detailed multi-timeframe trend analysis.
- **Unique Features**: The multi-timeframe approach and price-volume factor analysis distinguish it from other trend indicators.
- **Practical Example**: A dominant long-term trend (blue candle) might suggest a more stable bullish trend compared to a short-term spike.
#### Style Settings
- **Visual Representation**: Utilizes `plotcandle` functions with specific colors for different trend conditions, enhancing the visual clarity.
- **Color Coding**: Yellow for short-term trends, fuchsia for skyrocket trends, red for mid-term, and blue for long-term trends.
#### Trading Applications
- **Identifying Trends**: Effective in signaling the start and strength of bullish trends in various markets.
- **Combination with Other Tools**: Can be used alongside tools like RSI or MACD for reinforced trading decisions.
#### Conclusion
The " L1 Bullish Trend Indicator" is a powerful tool for traders looking to understand and capitalize on bullish market trends. Its unique combination of price and volume analysis, along with multi-timeframe integration, makes it a valuable addition to any trader's toolkit. Whether you're a beginner or a seasoned trader, this indicator offers insights that can help refine your market analysis and trading strategies.
Wickless Candle IndicatorIt is designed to identify and visually highlight wickless candles on trading charts. A wickless candle is defined as a candle where the high equals either the open or close, and the low equals either the open or close, indicating no wicks.
Key features of the script include:
Customizable Line Width: Users can adjust the width of the lines drawn over wickless candles.
Wickless Candle Detection: A function isWickless is used to determine whether a candle is wickless based on its open, close, high, and low values.
Line Drawing and Management: The script draws lines over wickless candles and extends these lines as long as consecutive wickless candles are detected. The lines are terminated when a candle with a wick is encountered or when the line extends beyond one bar.
Visual Indicators: Wickless candles are marked with a cross shape above them, and lines are colored black for clear visibility.
Efficient Line Handling: The script uses variables to store and update line information, ensuring efficient management of the drawn lines as new price data comes in.
This indicator is particularly useful for traders who consider wickless candles significant in their analysis, providing an automated and visually clear way to identify these candles on a chart.
ATH Drawdown Indicator by Atilla YurtsevenThe ATH (All-Time High) Drawdown Indicator, developed by Atilla Yurtseven, is an essential tool for traders and investors who seek to understand the current price position in relation to historical peaks. This indicator is especially useful in volatile markets like cryptocurrencies and stocks, offering insights into potential buy or sell opportunities based on historical price action.
This indicator is suitable for long-term investors. It shows the average value loss of a price. However, it's important to remember that this indicator only displays statistics based on past price movements. The price of a stock can remain cheap for many years.
1. Utility of the Indicator:
The ATH Drawdown Indicator provides a clear view of how far the current price is from its all-time high. This is particularly beneficial in assessing the magnitude of a pullback or retracement from peak levels. By understanding these levels, traders can gauge market sentiment and make informed decisions about entry and exit points.
2. Risk Management:
This indicator aids in risk management by highlighting significant drawdowns from the ATH. Traders can use this information to adjust their position sizes or set stop-loss orders more effectively. For instance, entering trades when the price is significantly below the ATH could indicate a higher potential for recovery, while a minimal drawdown from the ATH may suggest caution due to potential overvaluation.
3. Indicator Functionality:
The indicator calculates the percentage drawdown from the ATH for each trading period. It can display this data either as a line graph or overlaid on candles, based on user preference. Horizontal lines at -25%, -50%, -75%, and -100% drawdown levels offer quick visual cues for significant price levels. The color-coding of candles further aids in visualizing bullish or bearish trends in the context of ATH drawdowns.
4. ATH Level Indicator (0 Level):
A unique feature of this indicator is the 0 level, which signifies that the price is currently at its all-time high. This level is a critical reference point for understanding the market's peak performance.
5. Mean Line Indicator:
Additionally, this indicator includes a 'Mean Line', representing the average percentage drawdown from the ATH. This average is calculated over more than a thousand past bars, leveraging the law of large numbers to provide a reliable mean value. This mean line is instrumental in understanding the typical market behavior in relation to the ATH.
Disclaimer:
Please note that this ATH Drawdown Indicator by Atilla Yurtseven is provided as an open-source tool for educational purposes only. It should not be construed as investment advice. Users should conduct their own research and consult a financial advisor before making any investment decisions. The creator of this indicator bears no responsibility for any trading losses incurred using this tool.
Please remember to follow and comment!
Trade smart, stay safe
Atilla Yurtseven

Xeeder - Comparison RSI IndicatorXeeder - Comparison RSI Indicator (CRI)
The "Xeeder - Comparison RSI Indicator" (CRI) is a sophisticated tool designed to assist traders in analyzing and comparing the Relative Strength Index (RSI) and Moving Averages (MA) of two different securities simultaneously. This indicator is instrumental in identifying potential shifts in market momentum and strength between two assets.
Details of the Indicator:
Security Input Settings: This feature allows traders to input the symbols of two securities they wish to compare. The input is facilitated through text boxes where traders can enter the ticker symbols of their chosen securities.
Moving Average (MA) Settings: Traders have the option to select different types of moving averages such as SMA, EMA, WMA, among others. The settings also allow for the adjustment of the length of the moving average and the standard deviation multiplier for Bollinger Bands.
RSI Settings: This section allows traders to specify the length of the RSI calculation, which is used to analyze the momentum of the securities.
Dynamic RSI and MA Plotting: The indicator plots the RSI and its moving average for both securities dynamically on the chart, with distinct colors for easy differentiation and analysis.
RSI Bands: The indicator displays multiple RSI bands (Upper Band 1 & 2, Middle Band, Lower Band 1 & 2) as dashed horizontal lines, helping traders identify potential overbought and oversold regions.
Gradient Fill for Overbought and Oversold Regions: The indicator features a gradient fill between the RSI plot and the middle line, visually representing the overbought and oversold regions in different colors.
How to Use the Indicator:
Input Security Symbols: Start by entering the symbols of the two securities you wish to compare in the respective input boxes.
Configure MA and RSI Settings: Adjust the settings for the moving average type, length, and RSI length according to your trading strategy and analysis needs.
Analyze RSI and MA Plots: Observe the plotted RSI and moving averages for both securities to analyze and compare their momentum and trend characteristics.
Utilize RSI Bands: Use the RSI bands as reference points to identify potential overbought and oversold regions, and to gauge the relative strength between the two securities.
Interpret Gradient Fill: Pay attention to the gradient fill regions which visually represent overbought and oversold conditions, assisting in the identification of potential reversal points.
Example of Usage:
As a trader with a knack for developing innovative trading strategies, you can utilize the CRI indicator to enhance your swing trading approach. Here's how you might integrate this tool into your strategy:
Select Securities: Choose two securities that you are interested in comparing, perhaps from sectors you have identified as having potential based on your macroeconomic and geopolitical analysis.
Adjust Settings: Configure the RSI and MA settings to align with the characteristics of the selected securities and your trading strategy.
Analysis and Comparison: Analyze the RSI and MA plots to identify potential divergences or correlations between the two securities, which might indicate trading opportunities.
Utilize RSI Bands: Use the RSI bands to identify potential entry and exit points, aligning them with your analysis of broader market conditions and your trading strategy.
Content Creation: Leverage the insights gained from using the CRI indicator to create captivating content for your audience, sharing your analysis and perspectives on the selected securities and market conditions.
Remember, the CRI indicator serves as a powerful tool in your trading arsenal, offering a unique perspective on market dynamics and facilitating a deeper analysis of securities. Always consider the broader market context and your trading strategy when utilizing this tool.

Smoothed Vortex IndicatorThe Smoothed Vortex Indicator (SVI) is an enhanced version of the original Vortex Indicator (VI), designed to provide traders with a more refined and smoother representation of trend strength and potential reversals in financial markets. While both indicators share the same concept of measuring directional movement and true range, the SVI incorporates the Hull Moving Average (HMA) to achieve additional smoothing , differentiating it from the standard Vortex Indicator.
The original Vortex Indicator (VI) consists of two lines, VI+ and VI-, which represent the positive and negative directional movements, respectively. It calculates the True Range (TR), Plus Directional Movement (PDM), and Minus Directional Movement (MDM) over a specified period, usually 14 periods, and then calculate the Simple Moving Averages (SMAs) of VI+ and VI- based on these values.
On the other hand, the Smoothed Vortex Indicator (SVI) utilizes the HMA to improve precision and reduce lag in trend identification. The HMA is itself a weighted moving average of two WMAs and is known for its smoothing characteristics. The SVI first calculates the VI+ and VI- values as in the original VI and then applies the HMA formula to each of these values separately.
To add further flexibility to the SVI, it introduces a user-defined Weighting Factor. This factor allows traders to fine-tune the smoothing effect applied to VI+ and VI-. By multiplying the weighted VI values with the HMA, the SVI ensures a smoother representation of trend strength, making it easier for traders to identify trends and potential reversal points in the market.
In summary, the Smoothed Vortex Indicator (SVI) enhances the original Vortex Indicator by incorporating the Hull Moving Average (HMA) for additional smoothing and introducing a customizable Weighting Factor. This improved version provides traders with a more refined and visually smoother indicator, aiding them in making better-informed trading decisions based on trend strength and possible market reversals.

Modern Portfolio Management IndicatorAfter weeks of grueling over this indicator, I am excited to be releasing it!
Intro:
This is not a sexy, technical or math based indicator that will give you buy and sell signals or anything fancy, but it is an indicator that I created in hopes to bridge a gap I have noticed. That gap is the lack of indicators and technical resources for those who also like to plan their investments. This indicator is tailored to those who are either established investors and to those who are looking to get into investing but don't really know where to start.
The premise of this indicator is based on Modern Portfolio Theory (MPT). Before we get into the indicator itself, I think its important to provide a quick synopsis of MPT.
About MPT:
Modern Portfolio Theory (MPT) is an investment framework that was developed by Harry Markowitz in the 1950s. It is based on the idea that an investor can optimize their investment portfolio by considering the trade-off between risk and return. MPT emphasizes diversification and holds that the risk of an individual asset should be assessed in the context of its contribution to the overall portfolio's risk. The theory suggests that by diversifying investments across different asset classes with varying levels of risk, an investor can achieve a more efficient portfolio that maximizes returns for a given level of risk or minimizes risk for a desired level of return. MPT also introduced the concept of the efficient frontier, which represents the set of portfolios that offer the highest expected return for a given level of risk. MPT has been widely adopted and used by investors, financial advisors, and portfolio managers to construct and manage portfolios.
So how does this indicator help with MPT?
The thinking and theory that went behind this indicator was this: I wanted an indicator, or really just a "way" to test and back-test ticker performance over time and under various circumstances and help manage risk.
Over the last 3 years we have seen a massive bull market, followed by a pretty huge bear market, followed by a very unexpected bull market. We have been and continue to be plagued with economic and political uncertainty that seems to constantly be looming over everyone with each waking day. Some people have liquidated their retirement investments, while others are fomoing in to catch this current bull run. But which tickers are sound and how tickers and funds have compared amongst each other remains somewhat difficult to ascertain, absent manually reviewing and calculating each ticker individually.
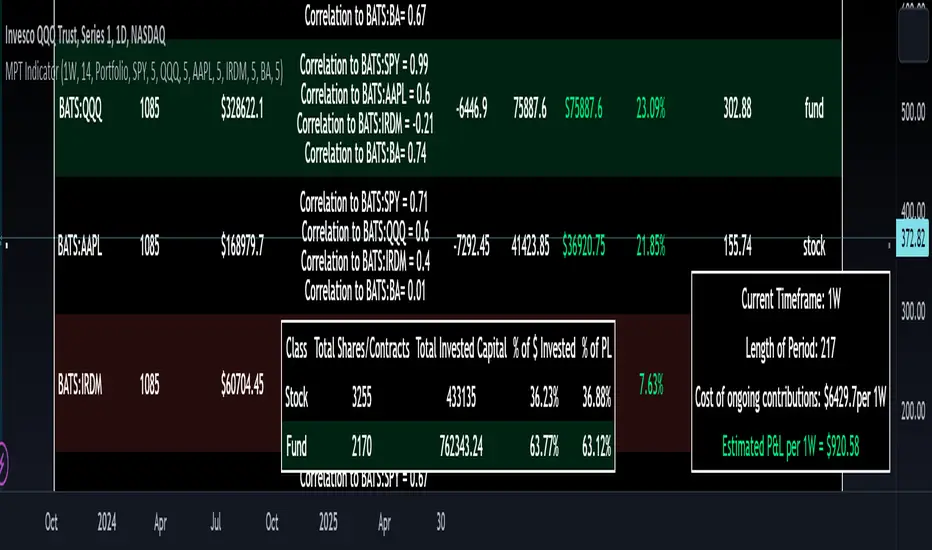
That is where this indicator comes in. This indicator permits the user to define up to 5 equities that they are potentially interested in investing in, or are already invested in. The user can then select a specific period in time, say from the beginning of 2022 till now. The user can then define how much they want to invest in each company by number of shares, so if they want to buy 1 share a week, or 2 shares a month, they can input these variables into the indicator to draw conclusions. As many brokers are also now permitting fractional share trading, this ability is also integrated into the indicator. So for shares, you can put in, say, 0.25 shares of SPY and the indicator will accept this and account for this fractional share.
The indicator will then show you a portfolio summary of what your earnings and returns would be for the defined period. It will provide a percent return as well as the projected P&L based on your desired investment amount and frequency.
But it goes beyond just that, you can also have the indicator display a simple forecasting projection of the portfolio. It will show the projected P&L and % Return over various periods in time on each of the ticker (see image below):
The indicator will also break down your portfolio allocation, it will show where the majority of your holdings are and where the majority of your P&L in coming from (best performers will show a green fill and worst will show a red fill, see image below):
This colour coding also extends to the portfolio breakdown itself.
Dollar cost averaging (DCA) is incorporated into the indicator itself, by assuming ongoing contributions. If you want to stop contributions at a certain point, you just select your end time for contributions at the point in which you would stop contributing.
The indicator also provides some basic fundamental information about the company tickers (if applicable). Simply select the "Fundamental" chart and it will display a breakdown of the fundamentals, including dividends paid, market cap and earnings yield:
The indicator also provides a correlation assessment of each holding against each other holding. This emphasizes the profound role of diversification on portfolios. The less correlation you have in your portfolio among your holdings, the better diversified you are. As well, if you have holdings that are perfectly inverse other holdings, you have a pseudo hedge against the downturn of one of your holdings. This is even more helpful if the inverse is a company with solid fundamentals.
In the below example you will see NASDAQ:IRDM in the portfolio. You will be able to see that NASDAQ:IRDM has a slight inverse relationship to SPY:
Yet IRDM has solid fundamentals and is performing well fundamentally. Thus, this makes IRDIM a solid addition to your portfolio as it can potentially hedge against a downturn for SPY and is less risky than simply holding an inverse leveraged share on SPY which is most likely just going to cost you money than make you money.
Concluding remarks:
There are many fun and interesting things you can do with this indicator and I encourage you to try it out and have fun with it! The overall objective with the indicator is to help you plan for your portfolio and not necessarily to manage your portfolio. If you have a few stocks you are looking at and contemplating investing in, this will help you run some theoretical scenarios with this stock based on historical performance and also help give you a feel of how it will perform in the future based on past behaviour.
It is important to remember that past behaviour does not indicate future behaviour, but the indicator provides you with tools to get a feel for how a stock has performed under various circumstances and get a general feel of the fundamentals of the company you could potentially be investing in.
Please note, this indicator is not meant to replace full, fundamental analyses of individual companies. It is simply meant to give you a "gist" of how companies are fundamentally and how they have performed historically.
I hope you enjoy it!
Safe trades everyone!
Price Exhaustion IndicatorThe Price Exhaustion Indicator (PE) is a powerful tool designed to identify trends weakening and strengthening in the financial markets. It combines the concepts of Average True Range (ATR), Moving Average Convergence Divergence (MACD), and Stochastic Oscillator to provide a comprehensive assessment of trend exhaustion levels. By analyzing these multiple indicators together, traders and investors can gain valuable insights into potential price reversals and long-term market highs and lows.
The aim of combining the ATR, MACD, and Stochastic Oscillator, is to provide a comprehensive analysis of trend exhaustion. The ATR component helps assess the volatility and range of price movements, while the MACD offers insights into the convergence and divergence of moving averages. The Stochastic Oscillator measures the current price in relation to its range, providing further confirmation of trend exhaustion. The exhaustion value is derived by combining the MACD, ATR, and Stochastic Oscillator. The MACD value is divided by the ATR value, and then multiplied by the Stochastic Oscillator value. This calculation results in a single exhaustion value that reflects the combined influence of these three indicators.
Application
The Price Exhaustion Indicator utilizes a unique visual representation by incorporating a gradient color scheme. The exhaustion line dynamically changes color, ranging from white when close to the midline (40) to shades of purple as it approaches points of exhaustion (overbought at 100 and oversold at -20). As the exhaustion line approaches the color purple, this represents extreme market conditions and zones of weakened trends where reversals may occur. This color gradient serves as a visual cue, allowing users to quickly gauge the strength or weakness of the prevailing trend.
To further enhance its usability, the Price Exhaustion Indicator also includes circle plots that signify potential points of trend reversion. These plots appear when the exhaustion lines cross or enter the overbought and oversold zones. Red circle plots indicate potential short entry points, suggesting a weakening trend and the possibility of a downward price reversal. Conversely, green circle plots represent potential long entry points, indicating a strengthening trend and the potential for an upward price reversal.
Traders and investors can leverage the Price Exhaustion Indicator in various ways. It can be utilized as a trend-following tool, or a mean reversion tool. When the exhaustion line approaches the overbought or oversold zones, it suggests a weakening trend and the possibility of a price reversal, helping identify potential market tops and bottoms. This can guide traders in timing their entries or exits in anticipation of a trend shift.
Utility
The Price Exhaustion Indicator is particularly useful for long-term market analysis, as it focuses on identifying long-term market highs and lows. By capturing the gradual weakening or strengthening of a trend, it assists investors in making informed decisions about portfolio allocation, trend continuation, or potential reversals.
In summary, the Price Exhaustion Indicator is a comprehensive and visually intuitive tool that combines ATR, MACD, and Stochastic Oscillator to identify trend exhaustion levels. By utilizing a gradient color scheme and circle plots, it offers traders and investors valuable insights into potential trend reversals and long-term market highs and lows. Its unique features make it a valuable addition to any trader's toolkit, providing a deeper understanding of market dynamics and assisting in decision-making processes. Please note that future performance of any trading strategy is fundamentally unknowable, and past results do not guarantee future performance.

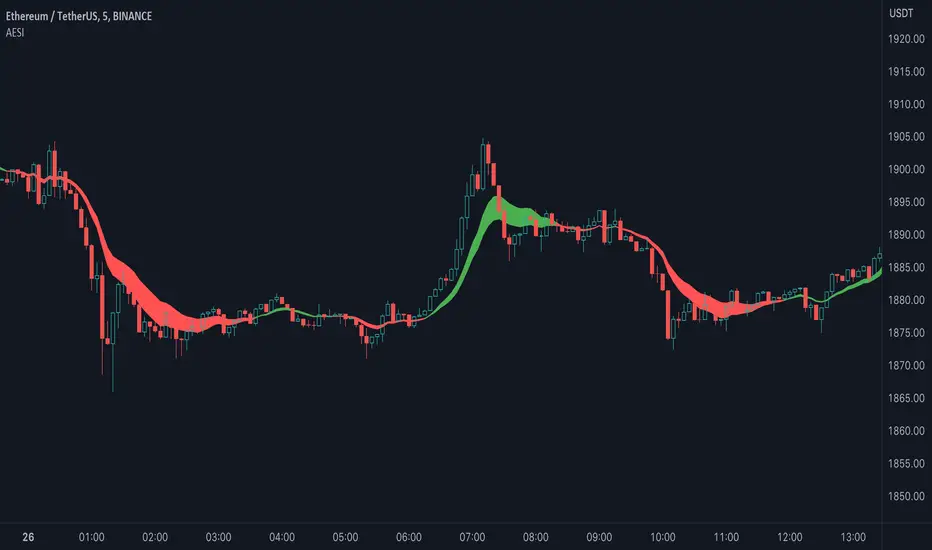
Advanced Exponential Smoothing Indicator (AESI) [AstrideUnicorn]The Advanced Exponential Smoothing Indicator (AESI) provides a smoothed representation of price data using the exponential smoothing technique. It helps traders identify the overall trend and potential reversal points in the market.
SETTINGS
Length: The number of periods used for the calculation of the exponential moving average (EMA). Higher values provide a smoother result but may lag behind price movements.
Alpha: The smoothing factor that determines the weight of the recent price data in the smoothing calculation. Higher values give more weight to recent data, resulting in a more responsive indicator.
Cloud Mode: Determines whether to display a cloud between the AESI line and the EMA line. When enabled, the cloud represents bullish (green) and bearish (red) market conditions.
HOW TO USE
The AESI indicator consists of a single line that represents the advanced exponential smoothing of the price data. It aims to provide a smoother version of the price series, reducing noise and revealing the underlying trend.
Bullish Condition: When the AESI line is above the EMA line, it indicates a bullish market condition. Traders may consider looking for buying opportunities or holding onto existing long positions.
Bearish Condition: When the AESI line is below the EMA line, it suggests a bearish market condition. Traders may consider looking for selling opportunities or holding onto existing short positions.
Optional Cloud Mode:
Enabling the cloud mode allows you to visualize bullish and bearish market conditions more clearly. The cloud appears between the AESI line and the EMA line, providing a visual representation of the prevailing market sentiment.
Bullish Cloud: When the AESI line is above the EMA line, the cloud is green, indicating a potential bullish market condition.
Bearish Cloud: When the AESI line is below the EMA line, the cloud is red, indicating a potential bearish market condition.
Note: The AESI indicator is most effective when used in conjunction with other technical analysis tools and indicators to confirm trading signals and make informed trading decisions.
Adjusting the Parameters:
You can adjust the Length and Alpha parameters to find the best ones for different timeframes and market conditions. Experimenting with different parameter values can help you find the optimal settings for your trading strategy.
It is recommended to backtest the AESI indicator on historical price data and evaluate its performance before using it in live trading. Remember that no indicator can guarantee profitable trades, and it is important to use risk management techniques and exercise caution when making trading decisions.
Regression Candle Conversion IndicatorHey everyone!
I got a pseudo-request a while ago for something like this, essentially the ability to track where another ticker would fall based on an alternative ticker.
I did create my ticker correlation reference indicator which directly looks at the correlation between 2 tickers. However, this is an indicator that operates on the same principle but is more pragmatic for trading.
What does it do?
Well, in keeping with the theme of what I call my indicators, this has a title that explains exactly what it does, "Regression Candle Conversion Indicator" or "RCCI" for short. It uses simple regression to convert one ticker to another. So while you are tracking one indicator, you can see where the expected value should fall on the other.
Applications?
The big application of this for me is being able to track where SPY/QQQ or IWM is falling during overnight trading sessions. Extended trading hours close at 8 pm NYSE time. After that, you have to guess where futures prices will put the ETF version of it. This indicator will allow you to track where, theoretically, the underlying ETF ticker will fall based on the current trading behaviour.
Some other applications are just the ability to track how similar or dissimilar one stock is to the other. For example, if we wanted to trade, say, Boeing using shares of DFEN or ITA (a defence specific ETF), here is what we get:
In the chart above we can see BA as the primary chart and ITA as the RCCI converted chart. We will see 2 major things that should cause us concern.
First, there is a really poor correlation between the two tickers. This indicates that ITA may not produce the best exposure if I am directly looking for Boeing exposure.
Second, there is a wide standard error. this means that the results that the RCCI is providing may be skewed up to +/- 2 points (as indicated by the standard error chart).
Let's take a look at BA and DFEN:
In the above, we can see that the correlation is not great, but the standard error is quite low.
This means that, while this may not be the best ticker for Boeing exposure, the RCCI is able to confidently calculate the ticker within +/- 0.50 cents based on BA's underlying data.
However, its important to note that it is not advisable to really rely on these results if the correlation is less than + 0.5 or greater than -0.5.
Let's take a look at a few more examples:
Above we have BA (NYSE) vs BA (NEO TSX CAD Hedged). We can see the strong relationship and high confidence calculations.
And some others:
SPX (primary) and ES1! (secondary):
RTY and IWM:
ES1! and SPY:
Customizations:
As you can see above, it is pretty straight forward. There are 3 options:
Lookback Length: Determines the length of assessment for correlation and the regression assessment.
Manual Ticker Input: The indicator will pull the data from your current chart and compare it against a manually selected indicator. You must tell the indicator which ticker you are comparing against.
Data Table: This will show you the data table which contains the standard error assessment and the correlation assessment. These are determined by your lookback length. The lookback length is defaulted to 500.
And that's the indicator! It's pretty straight forward. Hopefully you find it helpful, especially if you track futures during overnight sessions.
Leave your comments/questions and feedback below.
Thanks for checking it out!

Z-Score Probability IndicatorThis is the Z-Score Probability indicator. As many people like my original Z-Score indicator and have expressed more interest in the powers of the Z, I decided to make this indicator which shows additional powers of the Z-Score.
Z-Score is not only useful for measuring a ticker or any other variable’s distance from the mean, it is also useful to calculate general probability in a normal distribution set. Not only can it calculate probability in a dataset, but it can also calculate the variables within said dataset by using the Standard Deviation and the Mean of the dataset.
Using these 2 aspects of the Z-Score, you can, In principle, have an indicator that operates similar to Fibonacci retracement levels with the added bonus of being able to actually ascertain the realistic probability of said retracement.
Let’s take a look at an example:
This is a chart showing SPY on the daily timeframe. If we look at the current Z-Score level, we can see that SPY is pushing into the 2 to 3 Z-Score range. We can see two things from this:
1. We can see that a retracement to a Z-Score of 2 would correspond to a price of 425.26 based on the current dataset. And
2. We can see that the probability that SPY retraces to a Z-Score of 2 is around 0.9800 or 98%.
To take it one step further, we can look at the various other variables in the distribution. If we were to bet on SPY retracing back to -1 SDs, that would correspond to a price of around 397.15, with a probability of around 0.1600 or 16% (see image below):
Let’s say, we thought SPY would go to $440. Well, we can see that the probability SPY goes to 434.64 currently is pretty low. How do we know? Because the Z-Score table shows us the probability of values falling BELOW that Z-score level in the current distribution. So if we look at this example below:
We can see that 0.9998 or roughly 99% of values in the current SPY distribution will fall below 434.64. Thus, it may be unrealistic, at this point in time, to target said value.
So what is a Z-Score Table?
Well, I need to disclose/clarify that the Z-Score Table being displayed in this indicator does Z-Score probability a HUGE injustice. However, with the constraints what is realistic to fit into an indicator, I had to make it far more succinct. Let’s take a look at an actual Z-Score Table below:
Above is a look an the actual Z-Score table. How it works is you first identify you’re Z-Score and then find the corresponding value that relates to your score. The number displayed in the dataset represents the number of variables in the dataset/density distribution that fall BELOW that particular Z-score.
So, for example, if we have a Z-Score of -2.31, we can consult that table, go to the -2.3 then scroll across to the 0.01 to represent -2.31. We would see that this Z-Score corresponds to a 0.0104 probability zone (or essentially 1%) indicating that the majority of the variables in the distribution fall below that mean Z-score. In terms of tickers and stocks, that would mean it would theoretically be “overbought”.
So what does the indicator Z-Table tell us?
I have averaged out the data for the purposes of this indicator. However, you can also reference a manual Z-Table to get the exact probability for the current precise Z-Score. However, the reality is it doesn’t necessarily matter to be exact when it comes to tickers. The reason being, ticker’s are in constant flux, and by the time you identify that probability, the ticker will already be at a different level. So generalizations are okay in these circumstances, you just need to get the “gist” of where the distribution lies.
So how do I use the indicator?
Using the indicator is pretty straightforward. Once launched, you will see the current Z-Score of the ticker, the current levels based on the distribution and the summarized Z-Table.
The Z-Table will turn gray to indicate the zone the ticker is currently in. In this case, we can see that SPY currently is in the 2 SD Zone, meaning that 0.98 or 98% of the current dataset being shown falls below the price we are at:
When we launch the settings, we can see a few inputs.
Lookback Length: This determines the number of candles back we want to calculate the distribution for. It is defaulted to 75, but you can adjust it to whichever length you want.
SMA Length: The SMA is optional but defaults to on. If you want to see the smoothed trend of the Z-Score, this will do the trick. It does not need to be set to the same
length as the Z-Score lookback. Thus, if you want a more or less responsive SMA with, say, a larger dataset, then you can reduce the SMA length yourself.
Distribution Probability Fills: This simply colour codes the distribution zones / probability zones on the indicator.
Show Z-Table: This will display the summarized Z-Table.
Show SMA: As I indicated, the SMA is optional, you can toggle it on or off to see the overall Z-Score trend.
Concluding Remarks:
And that my friends is the Z-Score Probability Indicator.
I hope you all enjoy it and find it helpful. As always leave your comments, questions and suggestions below.
Safe trades to all and take care!

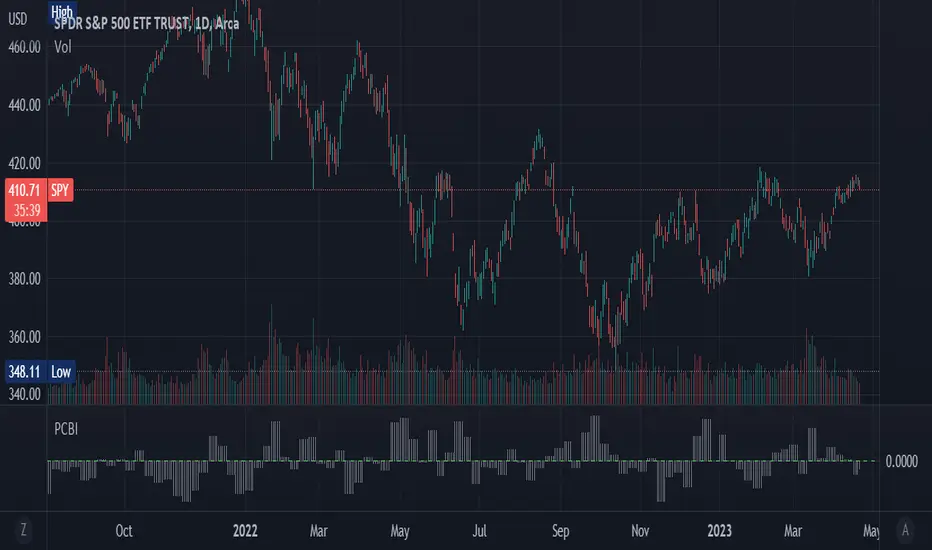
Put-Call Bias IndicatorThe Put-Call Bias Indicator provides a visual representation of the relative bias towards put options using CBOE data. This script calculates the Put/All ratio, displaying the difference as compared to an even 50% ratio as columns on the chart. A positive value indicates a higher proportion of puts being bought compared to the total number of options contracts.
The indicator uses weekly CBOE data to determine the Put/Call ratio, making it suitable for analyzing longer-term trends in options trading sentiment. The gray columns represent the bias towards puts, with the green horizontal line at 0 acting as a reference point to quickly identify the prevailing bias.
In addition to providing an overview of market sentiment, this indicator can also be used as a contrarian indicator. A high Put/All ratio may suggest that the market is overly bearish, potentially signaling a bullish reversal, while a low ratio may indicate an overly bullish market, potentially pointing to a bearish reversal. Please note that this indicator should be used in conjunction with other technical analysis tools and indicators for a comprehensive understanding of the market.
(This is a new version of an old script bc previous version was deleted by TradingView; republishing with a more verbose description)
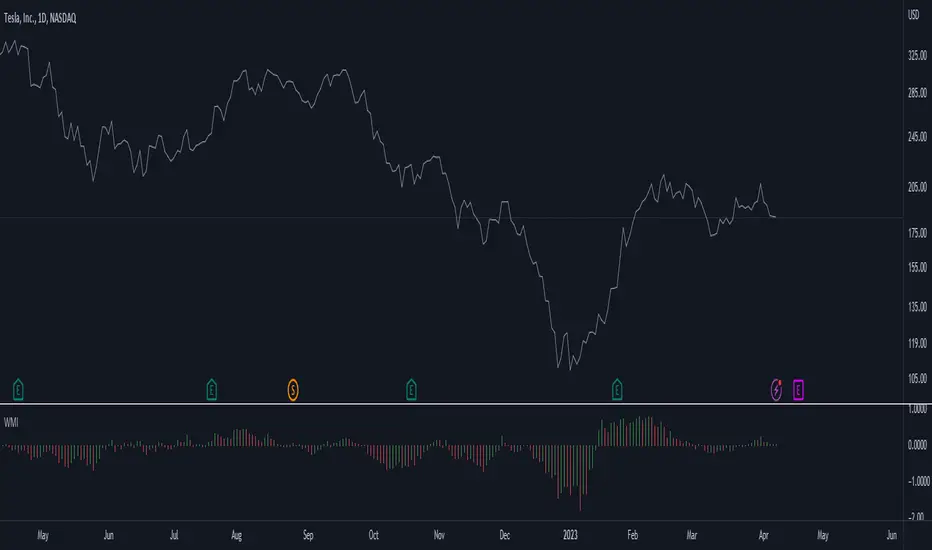
Weighted Momentum and Volatility Indicator (WMI)The Weighted Momentum and Volatility Indicator (WMI) is a composite technical analysis tool that combines momentum and volatility to identify potential trend changes in the underlying asset.
The WMI is displayed as an histogram that oscillates around a zero line, with increasing bars indicating a bullish trend and decreasing bars indicating a bearish trend.
The WMI is calculated by combining the Rate of Change (ROC) and Average True Range (ATR) indicators.
The ROC measures the percentage change in price over a set period of time, while the ATR measures the volatility of the asset over the same period.
The WMI is calculated by multiplying the normalized values of the ROC and ATR indicators, with the normalization process being used to adjust the values to a scale between 0 and 1.
Traders and investors can use the WMI to identify potential trend changes in the underlying asset, with increasing bars indicating a bullish trend and decreasing bars indicating a bearish trend.
The WMI can be used in conjunction with other technical analysis tools to develop a comprehensive trading strategy.
Do not hesitate to let me know your comments if you see any improvements to be made :)
Oliver Velez IndicatorOliver Velez is a well-known trader and educator who has developed multiple trading strategies. One of them is the 20-200sma strategy, which is a basic moving average crossover strategy. The strategy involves using two simple moving averages (SMAs) - a short-term SMA with a period of 20 and a long-term SMA with a period of 200 - on a 2-minute timeframe chart.
When the short-term SMA crosses above the long-term SMA, it signals a potential bullish trend and traders may look for opportunities to enter a long position. Conversely, when the short-term SMA crosses below the long-term SMA, it signals a potential bearish trend and traders may look for opportunities to enter a short position.
Traders using this strategy may also look for additional confirmations, such as price action signals or other technical indicators, before entering or exiting a trade. It is important to note that no trading strategy can guarantee profits, and traders should always use risk management techniques to limit potential losses.
This script is an implementation of the 2 SMA's (can also choose other types of MA's), with Elephant Bar Indicator (EBI) and the Tail Bars Indicator in TradingView.
The Elephant Bar Indicator is a technical indicator used in trading to identify potential trend reversals in the market. It is named after the large size of the bullish or bearish candlestick that it represents. The Tail Bars Indicator is a pattern recognition technique that identifies candlestick patterns with long tails or wicks.
The script starts by defining the input parameters for both indicators. For the Elephant Bar Indicator, the user inputs the lookback period and the size multiplier. For the Tail Bars Indicator, the user inputs the tail ratio and opposite wick ratio.
Next, the script calculates the moving averages of the closing price over the defined short and long periods using the Moving Average function. The script then calculates the average candle size and volume over the lookback period.
The script then identifies the Elephant Bars and Tail Bars using the input parameters and additional conditions. For Elephant Bars, the script identifies bullish and bearish bars that meet certain criteria, such as a size greater than the average candle size and volume greater than the average volume.
For Tail Bars, the script identifies bullish and bearish bars that have long tails or wicks and meet certain criteria such as opposite wick size less than or equal to the tail size multiplied by the input opposite wick ratio.
Finally, the script plots the Elephant Bar and Tail Bar signals on the chart using different colors and shapes. The script also plots the moving averages and Keltner Channels to help traders identify potential trend reversals.
It is still under development, so please, if someone has ideas to add, more than welcome
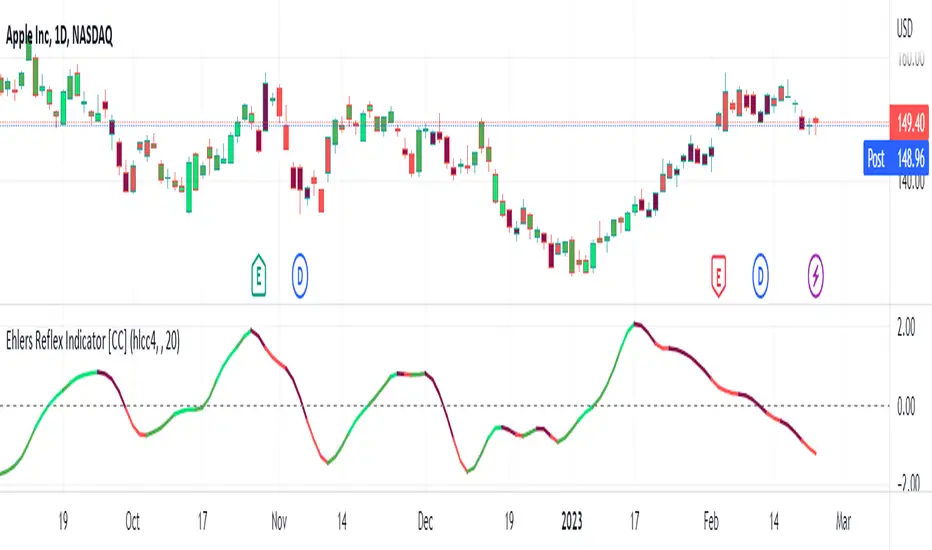
Ehlers Reflex Indicator [CC]The Reflex Indicator was created by John Ehlers (Stocks and Commodities Feb 2020) and this is a zero lag indicator that works similar to an overbought/oversold indicator but with the current stock cycle data. I find that this indicator works well as a leading indicator as well as a divergence indicator. Generally speaking, this indicator indicates a medium to long term downtrend when the indicator is below the line and a medium to long term uptrend when the indicator is above the line. Ehlers has created a few complementary indicators that I will release in the next few days but just keep in mind that this indicator focuses on the underlying cycle component while removing as much noise with no lag. I have color coded the lines to show strong signals with the darker colors and normal signals with the lighter colors. Buy when the line turns green and sell when it turns red.
Let me know if there are any other scripts you would like to see me publish!
Candlestick Pattern Criteria and Analysis Indicator█ OVERVIEW
Define, then locate the presence of a candle that fits a specific criteria. Run a basic calculation on what happens after such a candle occurs.
Here, I’m not giving you an edge, but I’m giving you a clear way to find one.
IMPORTANT NOTE: PLEASE READ:
THE INDICATOR WILL ALWAYS INITIALLY LOAD WITH A RUNTIME ERROR. WHEN INITIALLY LOADED THERE NO CRITERIA SELECTED.
If you do not select a criteria or run a search for a criteria that doesn’t exist, you will get a runtime error. If you want to force the chart to load anyway, enable the debug panel at the bottom of the settings menu.
Who this is for:
- People who want to engage in TradingView for tedious and challenging data analysis related to candlestick measurement and occurrence rate and signal bar relationships with subsequent bars. People who don’t know but want to figure out what a strong bullish bar or a strong bearish bar is.
Who this is not for:
- People who want to be told by an indicator what is good or bad or buy or sell. Also, not for people that don’t have any clear idea on what they think is a strong bullish bar or a strong bearish bar and aren’t willing to put in the work.
Recommendation: Use on the candle resolution that accurately reflects your typical holding period. If you typically hold a trade for 3 weeks, use 3W candles. If you hold a trade for 3 minutes, use 3m candles.
Tldr; Read the tool tips and everything above this line. Let me know any issues that arise or questions you have.
█ CONCEPTS
Many trading styles indicate that a certain candle construct implies a bearish or bullish future for price. That said, it is also common to add to that idea that the context matters. Of course, this is how you end up with all manner of candlestick patterns accounting for thousands of pages of literature. No matter the context though, we can distill a discretionary trader's decision to take a trade based on one very basic premise: “A trader decides to take a trade on the basis of the rightmost candle's construction and what he/she believes that candle construct implies about the future price.” This indicator vets that trader’s theory in the most basic way possible. It finds the instances of any candle construction and takes a look at what happens on the next bar. This current bar is our “Signal Bar.”
█ GUIDE
I said that we vet the theory in the most basic way possible. But, in truth, this indicator is very complex as a result of there being thousands of ways to define a ‘strong’ candle. And you get to define things on a very granular level with this indicator.
Features:
1. Candle Highlighting
When the user’s criteria is met, the candle is highlighted on the chart.
The following candle is highlighted based on whether it breaks out, breaks down, or is an inside bar.
2. User-Defined Criteria
Criteria that you define include:
Candle Type: Bull bars, Bear bars, or both
Candle Attributes
Average Size based on Standard Deviation or Average of all potential bars in price history
Search within a specific price range
Search within a specific time range
Clarify time range using defined sessions and with or without weekends
3. Strike Lines on Candle
Often you want to know how price reacts when it gets back to a certain candle. Also it might be true that candle types cluster in a price region. This can be identified visually by adding lines that extend right on candles that fit the criteria.
4. User-Defined Context
Labeled “Alternative Criteria,” this facet of the script allows the user to take the context provided from another indicator and import it into the indicator to use as a overriding criteria. To account for the fact that the external indicator must be imported as a float value, true (criteria of external indicator is met) must be imported as 1 and false (criteria of external indicator is not met) as 0. Basically a binary Boolean. This can be used to create context, such as in the case of a traditional fractal, or can be used to pair with other signals.
If you know how to code in Pinescript, you can save a copy and simply add your own code to the section indicated in the code and set your bull and bear variables accordingly and the code should compile just fine with no further editing needed.
Included with the script to maximize out-of-the-box functionality, there is preloaded as alternative criteria a code snippet. The criteria is met on the bull side when the current candle close breaks out above the prior candle high. The bear criteria is met when the close breaks below the prior candle. When Alternate Criteria is run by itself, this is the only criteria set and bars are highlighted when it is true. You can qualify these candles by adding additional attributes that you think would fit well.
Using Alternative Criteria, you are essentially setting a filter for the rest of the criteria.
5. Extensive Read Out in the Data Window (right side bar pop out window).
As you can see in the thumbnail, there is pasted a copy of the Data Window Dialogue. I am doubtful I can get the thumbnail to load up perfectly aligned. Its hard to get all these data points in here. It may be better suited for a table at this point. Let me know what you think.
The primary, but not exclusive, purpose of what is in the Data Window is to talk about how often your criteria happens and what happens on the next bar. There are a lot of pieces to this.
Red = Values pertaining to the size of the current bar only
Blue = Values pertaining or related to the total number of signals
Green = Values pertaining to the signal bars themselves, including their measurements
Purple = Values pertaining to bullish bars that happen after the signal bar
Fuchsia = Values pertaining to bearish bars that happen after the signal bar
Lime = Last four rows which are your percentage occurrence vs total signals percentages
The best way I can explain how to understand parts you don’t understand otherwise in the data window is search the title of the row in the code using ‘ctrl+f’ and look at it and see if it makes more sense.
█ [b}Available Candle Attributes
Candle attributes can be used in any combination. They include:
[*}Bodies
[*}High/Low Range
[*}Upper Wick
[*}Lower Wick
[*}Average Size
[*}Alternative Criteria
Criteria will evaluate each attribute independently. If none is set for a particular attribute it is bypassed.
Criteria Quantity can be in Ticks, Points, or Percentage. For percentage keep in mind if using anything involving the candle range will not work well with percentage.
Criteria Operators are “Greater Than,” “Less Than,” and “Threshold.” Threshold means within a range of two numbers.
█ Problems with this methodology and opportunities for future development:
#1 This kind of work is hard.
If you know what you’re doing you might be able to find success changing out the inputs for loops and logging results in arrays or matrices, but to manually go through and test various criteria is a lot of work. However, it is rewarding. At the time of publication in early Oct 2022, you will quickly find that you get MUCH more follow through on bear bars than bull bars. That should be obvious because we’re in the middle of a bear market, but you can still work with the parameters and contextual inputs to determine what maximizes your probability. I’ve found configurations that yield 70% probability across the full series of bars. That’s an edge. That means that 70% of the time, when this criteria is met, the next bar puts you in profit.
#2 The script is VERY heavy.
Takes an eternity to load. But, give it a break, it’s doing a heck of a lot! There is 10 unique arrays in here and a loop that is a bit heavy but gives us the debug window.
#3 If you don’t have a clear idea its hard to know where to start.
There are a lot of levers to pull on in this script. Knowing which ones are useful and meaningful is very challenging. Combine that with long load times… its not great.
#4 Your brain is the only thing that can optimize your results because the criteria come from your mind.
Machine learning would be much more useful here, but for now, you are the machine. Learn.
#5 You can’t save your settings.
So, when you find a good combo, you’ll have to write it down elsewhere for future reference. It would be nice if we could save templates on custom indicators like we can on some of the built in drawing tools, but I’ve had no success in that. So, I recommend screenshotting your settings and saving them in Notion.so or some other solid record keeping database. Then you can go back and retrieve those settings.
#6 no way to export these results into conditions that can be copy/pasted into another script.
Copy/Paste of labels or tables would be the best feature ever at this point. Because you could take the criteria and put it in a label, copy it and drop it into another strategy script or something. But… men can dream.
█ Opportunities to PineCoders Learn:
1. In this script I’m importing libraries, showing some of my libraries functionality. Hopefully that gives you some ideas on how to use them too.
The price displacement library (which I love!)
Creative and conventional ways of using debug()
how to display arrays and matrices on charts
I didn’t call in the library that holds the backtesting function. But, also demonstrating, you can always pull the library up and just copy/paste the function out of there and into your script. That’s fine to do a lot of the time.
2. I am using REALLY complicated logic in this script (at least for me). I included extensive descriptions of this ? : logic in the text of the script. I also did my best to bracket () my logic groups to demonstrate how they fit together, both for you and my future self.
3. The breakout, built-in, “alternative criteria” is actually a small bit of genius built in there if you want to take the time to understand that block of code and think about some of the larger implications of the method deployed.
As always, a big thank you to TradingView and the Pinescript community, the Pinescript pros who have mentored me, and all of you who I am privileged to help in their Pinescripting journey.
"Those who stay will become champions" - Bo Schembechler

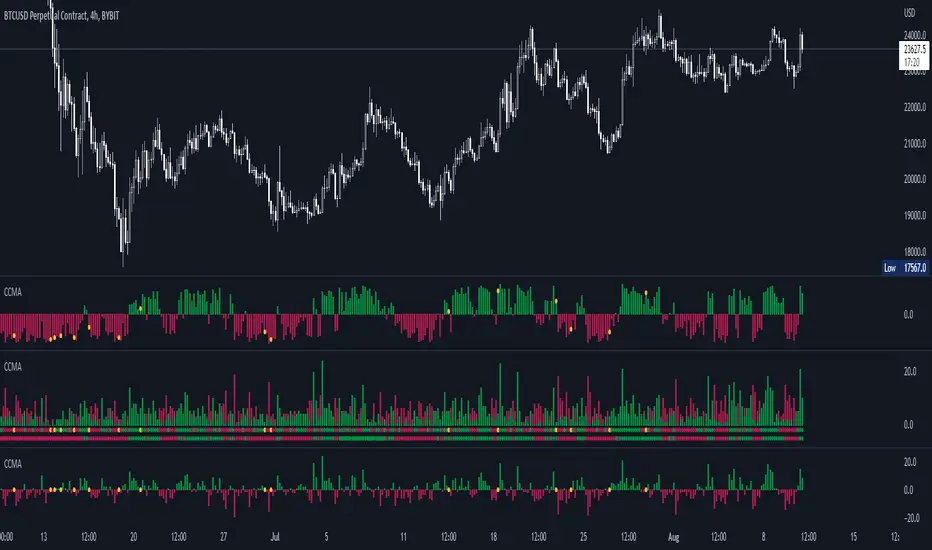
CCMA - Count Condition MA (560 Indicators In One) Do you like using moving averages?
Why do you think a pair of moving averages on a chart will help you?
What is the probability that once two moving averages have crossed, you will successfully enter the trade?
So why not use 100+ moving averages at once to increase the probability of a successful trade?
And all this can be seen in a single oscillator as a histogram!
I want to introduce you to a system that takes into account 560 moving averages movements. And that's just for a second, 560 potential indicators.
Specifically:
- 22 types of MA (EMA, SMA, RMA and others).
- 176 moving averages.
- 310 crossover checks.
- 252 checks of trend following.
The indicator makes the most of the opportunities provided by television. Therefore, it can take a long time to load it.
How does it work ?
In general, the indicator counts the number of fulfilled conditions.
It checks if MA #1 and MA #2 have crossed. If so, it adds +1 to the statistics. It also checks if price is above or below the moving average. There are a total of 560 such checks. (This is about the maximum the TV allowed me).
The default is 8 lengths of moving averages, I took the Fibonacci numbers thinking they were the optimal solution. You can take any of your favorites.
If the "Ratio MOD" feature is on. Then you can see how many MAs are showing signals to enter a long or short position.
You can also see the indication at the bottom as dots. They show which signals are longer/shorter. If the number of signals is the same, the dot will be yellow. The first line of dots counts the number of crossings. The second line counts the number of crossovers + checks whether the price is above or below the average slippage.
If the "Differ MOD" function is enabled. Then you can see the difference between long and short signals. With the same indication as in RATIO MOD.
If "Show all" is on, then the bar graph shows all 560 accounting options. If it is off, only the number of crossovers is displayed. (This does not apply to the display as points)
If the script shows an error, try to change the timeframe and go back. Or add it again.
You can also disable the histogram in the stats settings and leave only the points that help in determining the trend.
BTC - Novel RPPI IndicatorHey Everyone,
This is a collab effort between me (a statistician) and @Stein3d (A coder). So if you like this indicator, be sure to also give him the credit!
This a novel indicator theorized by me and applied by Stein3d. We are calling it the RPPI indicator, standing for Regression based Price Prediction Indicator.
This is specifically coded for BTC and cannot be used for alt coins or ETH.
This is pretty beta so your feedback and comments are encouraged!
I will keep it brief, but here is the run down:
What does it do:
The indicator does 3 main things:
1. Predicts bullish targets;
2. Predicts bearish targets;
3. Predicts close price
Who is it applicable for:
This is generally targeted to day trades, but it can have swing trade applications as well. Feel free to get creative with combining it with other indicators that you feel complement it well.
How does it work:
It uses statistical based regressive analysis of BTC to compare current price action to previous price action and determine where the natural high and lows will fall intra-day based on the current price action of the day.
How to use it:
This does not omit the need for technical analysis and chart interpretation; however, it sets realistic expectations of intra-day bullish and bearish price targets as well as its best guess of where the current day close is most likely to fall. Take a look at some of the images below:
The image is pretty self explanatory but you see that there are 2 bull and bear targets. The bull targets, of course, are listed in Green and the bear targets are listed in Red.
There is a dummy neutral support and resistance target which is listed in yellow and the close price is in the purple dotted line.
Of course these are all customizable.
I think that pretty much covers it in a nut shell but let us know if you have any other questions and also please provide feedback!
Thanks for checking it out!

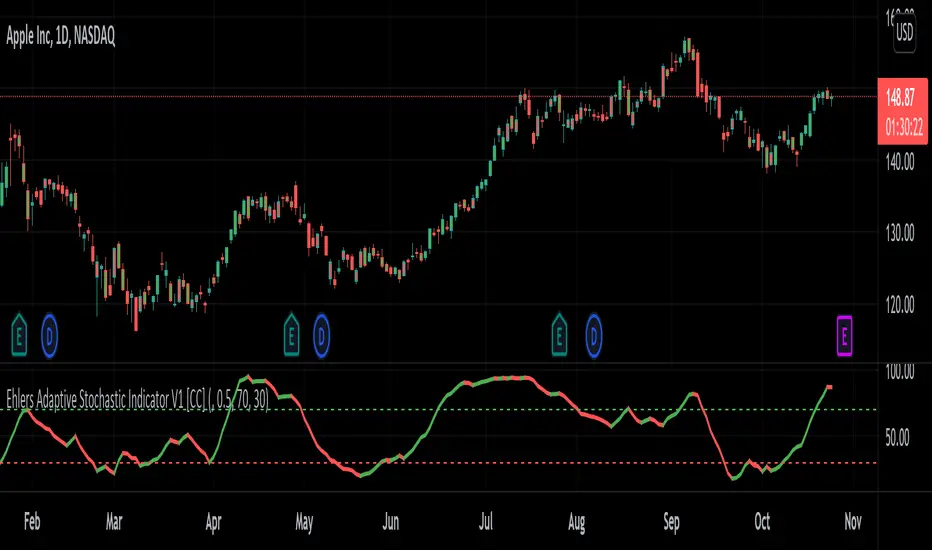
Ehlers Adaptive Stochastic Indicator V1 [CC]The Adaptive Stochastic Indicator V1 was created by John Ehlers (Rocket Science For Traders pgs 233-234) and this indicator uses the same calculations to find a cycle period that is then used for both the creation of the stochastic indicator but also for the smoothing to create a double smoothed stochastic indicator. Because it is calculated this way, this indicator is more reactive than almost any other stochastic indicator and provides clear buy and sell signals especially when the underlying stock is trending. It is interpreted in the same way as a normal stochastic indicator so great buy signals are when the indicator is below the oversold line and starts to move up and vice versa. Buy when the line turns green and sell when it turns red.
Let me know if there are any other indicators you would like to see me publish!