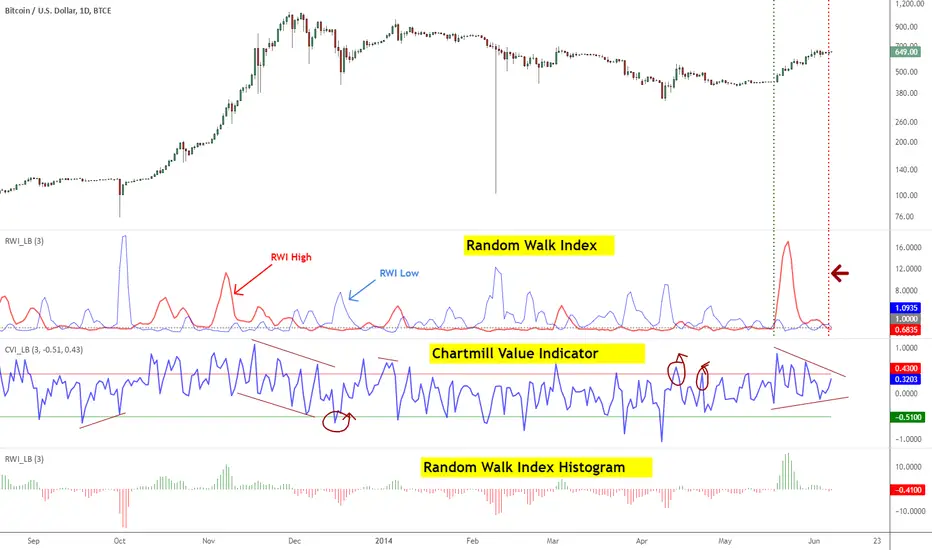
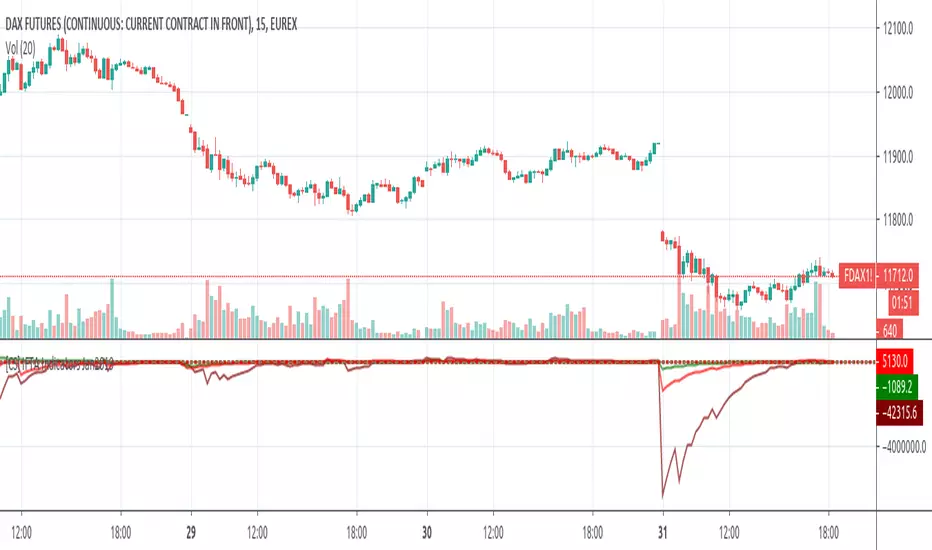
Indicators: Chartmill Value Indicator & Random Walk IndexChartMill Value Indicator & Modified ChartMill Value Indicator :
-------------------------------
Developed by Dirk Vandycke, CVI tracks how far the price spread is from its MA. Since MA keeps increasing even when price consolidates or stalls, it is very difficult for the deviation from a moving average to remain in the overbought or oversold regions for extended periods, which represents a significant improvement over other oscillators such as the RSI and Stochastic indicators.
However, a simple price spread from a moving average would not be comparable across all securities, which would preclude us from using the spread in systematic strategies. Fortunately, Mr.Vandycke addresses this problem by dividing the spread by the average true range, which is dependent on both the price level and volatility of the underlying security.
There is a variation of CVI called Modified CVI, which does time normalization of ATR (not the MA). This indicator supports displaying "Modified CVI" too. Check the options page.
This indicator is best used with other oscillators, to confirm signals. Zero line (in this case, "1" line since the gray line is drawn at the value of 1) crossovers should also be considered as signals.
I suggest tuning the OB/OS levels to match your instrument (usually it is around 0.5/-0.5 range).
More info:
www.traders.com
Random Walk Index
-------------------------
RWI is used to determine if an issue is trending or in a random trading range (like ADX/Aroon). It attempts to do this by first determining an issue's trading range. The next step is to calculate a series of RWI indexes for the maximum look-back period. The largest index move in relation to a random walk is used as today's index.
Michael Poulos, inventor of RWI, recommends 2 to 7 for the short-term time frames and 8-64 for long terms. An issue is trending higher if the long term RWI of highs is greater than 1, while a downtrend is indicated if the long term RWI of lows is greater than 1.
Below are some more rules developed by Mr.Poulos:
- Enter a long (or close short) when the long-term RWI of the highs is greater than 1 and the short-term RWI of lows peaks above 1
- Enter short (or close long) when the long-term RWI of the lows is greater than 1 and the short-term RWI of highs peaks above 1
More info:
- tradingsim.com
For displaying only the histogram (as shown in the bottom pane), select "ShowOnlyHistogram" in the options page.
Cerca negli script per "indicators"
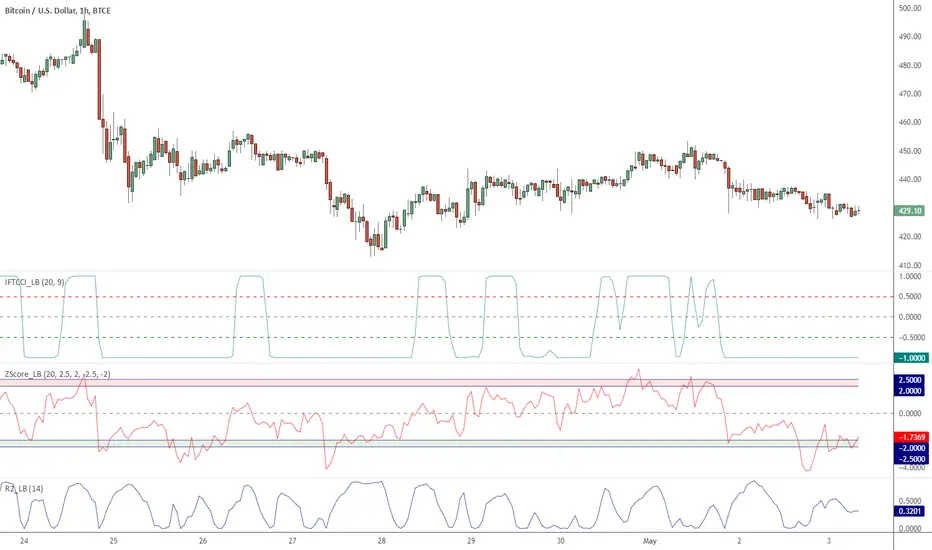
Indicators: Three included :: IFT on CCI, Z-Score and R-Squared*** Full description in the comment below ******
This chart has 3 indicators:
- Chande's R2
- Zscore
- Inverse Fisher Transform on CCI
Feel free to "make mine" (click on the SHARE button) and use these indicators in your charts.
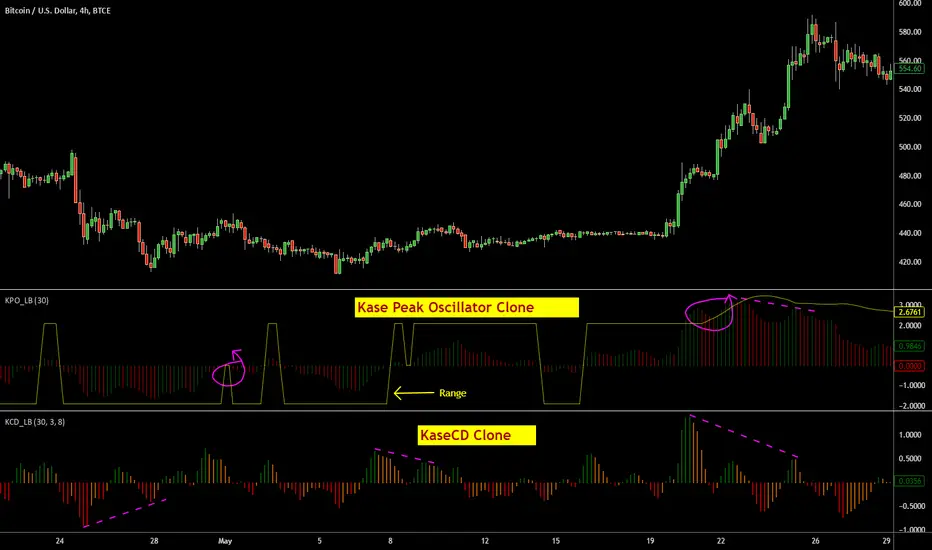
Indicators: KaseCD & Kase Peak OscillatorI have included ports of 2 indicators from MT4 (not from the original commercial source). I couldn't cross check if these matched their commercial equivalents (you need to assume they don't!). If you own any of these in other platforms, appreciate if you could publish some comparison results here.
Kase Peak Oscillator is the difference between two trend measurements, one for rising markets and the other for falling markets. KCD is the PeakOsc minus its own average. So, KPO takes the place of a traditional oscillator and the KCD takes place of the traditional MACD.
Ms.Kase claims KCD is far more accurate than MACD.
More info:
- www.kaseco.com
- beathespread.com
Let me know if you have experience with the original indicators and are willing to help improve these clones. Thanks.
Indicators: Rainbow Charts Oscillator, Binary Wave and MAsRainbow Charts, by Mel Widner, is a trend detector. It uses recursively smoothed MAs (remember, this idea was proposed back in 1997 -- it was certainly cool back then!) and also builds an oscillator out of the MAs. Oscillator bands indicate the stability range.
I have also included a simple binary wave based on whether all the MAs are in an upward slope or not. If you see any value above 0.5 there, the trend is definitely up (all MAs pointing up).
More info:
www.traders.com
Here's my complete list of indicators (With these 3, the total count should be above 100 now...will update the list later today)

Indicators: Volume-Weighted MACD Histogram & Sentiment Zone OscVolume-Weighted MACD Histogram
-------------------------------------------------------------------------------------
Volume-Weighted MACD Histogram, first discussed by Buff Dormeier, is a modified version of MACD study. It calculates volume-averaged Close price for finding the histogram.
More info:
www.moneyshow.com
Sentiment Zone Oscillator
-------------------------------------------------------------------------------------
Sentiment Zone Oscillator, developed by Walid Khalil, is a complementing oscillator to VZO and PZO.
To quote Walid:
>> The sentiment zone oscillator (SZO) is a leading contrary oscillator that measures the extreme emotions of a single market or share.
>> It measures and defines both extremes, bullishness (overoptimism) and bearishness (overpessimism), that could lead to a change
>> in sentiment, eventually changing the trend of the time frame under study. The SZO was devised on the belief that after several waves
>> of rising prices, investors begin to get bullish on the stock with increasing confidence since the price has been rising for some time.
>> The SZO measures that bullishness/bearishness and marks overbought/oversold levels.
SZO has its own oversold/overbought bands. Also, when SZO goes above 7, it indicates extreme optimism. When the SZO goes below -7, it indicates extreme pessimism.
More info: www.traders.com
How to import / use custom indicators from this chart?
-------------------------------------------------------------------------------------
PDF: drive.google.com

Indicators: 6 RSI variationsAs we all know, as published by Wilder, RSI makes use of "CLOSE" values. You probably have experimented changing the input to hl2 or hlc3 . I have included many other RSI variations in this chart. Refer to the developers section below to learn how you can use this code in your scripts.
1) RSI with Volume
---------------------------------------------
Suggested by Morris, this idea adds volume to the RSI indicator. Because volume offers one means of determining whether money is entering or leaving a market, this would provide additional information with which to make trading decisions.
2) RSI using last Open
---------------------------------------------
This is RSI with yesterday's open, This basically compares two full days of price action and in the process produces a smoother RSI line.
RSI of today's close is used as a signal (blue line).
3) RSI using SMA
---------------------------------------------
Wilder used his own MA for calculating RSI (check my post on Wilders MA here - -- This closely resembles EMA). One of Morris's suggestion is to try out SMA.
Compared to normal RSI, you will see more squiggles here.
4) RSI using EMA
---------------------------------------------
Same idea as above, but using EMA.
5) RSI with Fibs
---------------------------------------------
How much does RSI retrace? This makes it easy to determine that :)
6) RSI of MACD
---------------------------------------------
As I mentioned earlier, RSI is a pluggable formula. You can substitute "close" with any data series to derive an index out of it.
This shows RSI of MACD. Note that this is range bound.
More info on RSI variations:
drive.google.com
For Pinescript developers:
---------------------------------------------
You can substitute your favorite indicator in the RSI function. I have made the RSI calculation a separate function in all the indicators above.
Following are the reusable functions (simply copy to your script and call with proper arguments):
* WiMA(src, length)
* calc_rsi(fv, length): This is equivalent to stock rsi() in TV.
* calc_rsi_volume(fv, length)
* calc_rsi_sma(fv, length)
* calc_rsi_ema(fv, length)
* calc_rsi_lastopen(fv, length)
* calc_macd(src, fast, slow)
You can also pick up fibs drawing code and put in on any indicator.

Indicators: Butterworth & Super Smoother filtersThese indicators, from John Ehlers' book "Cybernetic Analysis for Stocks and Futures", are EMA alternatives.
The basic idea behind all these is to try to get smoothing with as little lag as possible. As you can see from the chart, they are much smoother, have better response, and a closer match to market prices.
Basically, all the responsiveness of a faster EMA, with the smoothing of a slower EMA :)

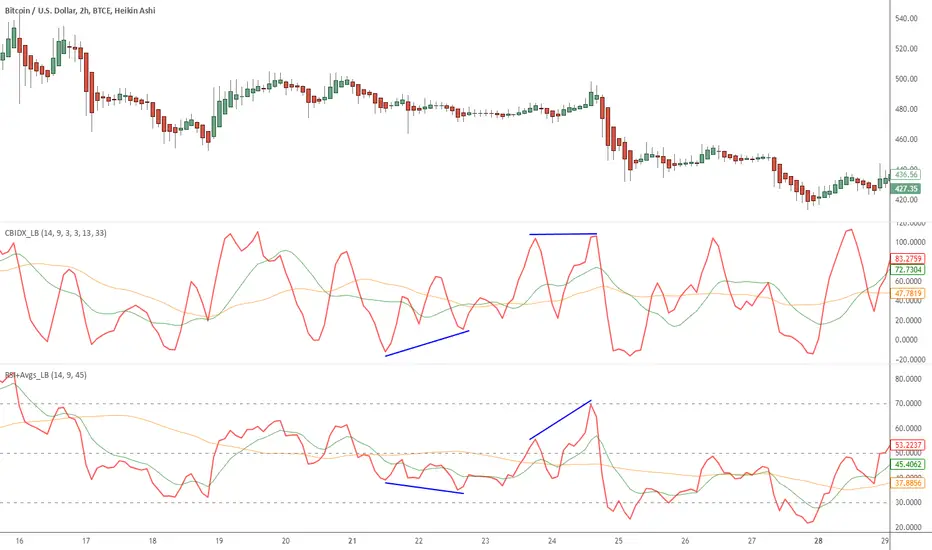
Indicators: Constance Brown Composite Index & RSI+AvgsI am a big fan of Constance Brown. Her book "Technical Analysis for Trading Professionals" is an absolute classic (get the 2nd edition).
I have included here 2 of the indicators she uses in all her charts.
Composite Index
----------------------------------------
This is a formula Ms Brown developed (Cardwell may not agree!) to identify divergence failures with in the RSI. This also highlights the horizontal support levels with in the indicator area.
This index removes the normalization range restrictions in RSI. This means it is not bound with in 0-100 range. Also, this has embedded momentum calculation in it.
The fine nuances of this indicator are not documented well enough, if you find some good documentation, do let me know. Always use this with RSI (like the next one).
RSI+Avgs
----------------------------------------
This is plain 14 period RSI with a 9-period EMA and 45-period SMA overlaid.
Indicators OverlayHello All,
This script shows the indicators in separate windows on the main chart. Included indicators are RSI, CCI, OBV, Stochastic, Money Flow Index, Average True Range and Chande Momentum Oscillator. indicator windows are located at the top or bottom of the chart according to last moves of the Closing price. Different colors are used for each indicator. Horizontal levels are shown as dashed line and label as well.
Using the options;
You can enable/disable the indicators you want to see or not
You can change source and length for each indicator
You can set window length. using this length indicator windows are located on the chart
After you added this indicator to your chart I recommend: right click on any of the indicator windows => "Visual Order" => "Bring to front" as seen screenshot below:
in this example only 3 indicators enabled and period is set as 80:
indicator windows moves to the top or bottom of the chart according to the close price:
P.S. if you want to see any other indicator in the options then leave a comment under the indicator ;)
Enjoy!

Linear Momentum and Performance Indicators (IFTA Jan 2019)This a porting to Trading View of the 12 new indicators introduced in IFTA Journal (January Edition) by Akram El Sherbini, MFTA, CFTe, CETA.
Indicators are available in "Linear Momentum and Performance Indicators" at page four.
IFTA Journal is available below:
ifta.org
Indicators implemented herein:
Linear Force Index: The linear force index LFI measures the force of buyers and sellers during rallies and declines, respectively. It combines two important pieces of market information—the price acceleration
and volumes.
Pressure Index: The pressure index PRI measures the buying and selling pressure over a certain range within a time interval by moving around its zero line. The index indicates a rise in buying pressure when it crosses above the zero line and a rise in selling pressure
when it crosses below the zero line level. The buying and selling force moves the last price during the session to form a range with low and high boundaries.
Strength Index Index : The strength index SI is a leading indicator to the pressure index. It measures the ability of buyers to resist sellers and vice versa. SI of today is the ratio of the latest pressure index value to the strain of today.
Power Index : It measures the buying and selling power within a time interval by moving around its zero line.
Intensity Index : The intensity index II measures the buying and selling intensity within a time interval by moving around its zero line.
Dynamic Strength Index : The sole purpose of the dynamic strength index DSI and the integral dynamic strength index IDSI is to lead their intensity indicator peers.
Integral Force Index
Integral Pressure Index
Integral Strength Index
Integral Power Index
Integral Intensity Index
Integral Dynamic Strength Index
The following example shows a trade following the signal while several indicators are crossing the zero line:
Integral performance indicators have a fewer number of trades than the performance indicators. This result is normal, as the integral indicators are less sensitive than their peers. Moreover, the power, intensity, and dynamic strength are less sensitive than the force, pressure, and strength indicators. The same applies for their integrals. Therefore, the integrals of power, intensity, and dynamic strength indicators are more inclined to be medium-term indicators.
As the paper is suggesting "the linear momentum and the new performance indicators should make a significant change in categorizing several indicators in technical analysis."
Technical indicators are using biased mathematical implementations. For example Momentum Index is in reality a velocity indicator, Force index a Momentum indicator and so on. From a Physical perspective correct momentum, force, velocity etc. needs to be corrected and re-categorized.
The author also gives important insights in how these indicators can be used "simultaneously to identify price turning points and filter irrelevant divergences."
"This paper will attempt to adjust the price momentum and force concepts introduced by Welles Wilder and Alexander Elder, respectively. By introducing the concept of linear momentum, new indicators will emerge to dissect the market performance into six main elements: market’s force, pressure, strength, power, intensity, and dynamic strength. This will lead to a deeper insight about market action. The leading performance indicators can be used simultaneously to identify price turning points and filter irrelevant divergences. The linear momentum and the new performance indicators should make a significant change in categorizing several indicators in technical analysis."
Suggestions and feedback are welcome
Hope you enjoy this,
CryptoStatistical
Targets For Overlay Indicators [LuxAlgo]The Targets For Overlay Indicators is a useful utility tool able to display targets during crossings made between the price and external indicators on the user chart. Users can display a series of two targets, one for crossover events and another one for crossunder event.
Alerts are included for the occurrence of a new target as well as for reached targets.
🔶 USAGE
In order for targets to be displayed users need to select an appropriate input source from the "Source" drop-down input setting. In the example above we apply the indicator to a volatility stop.
This can also easily be done by adding the "Targets For Overlay Indicators" script on the VStop indicator directly.
Targets can help users determine the price limit where the price might start deviating from an indication given by one or multiple indicators. In the context of trading, targets can help secure profits/reduce losses of a trade, as such this tool can be useful to evaluate/determine user take profits/stop losses.
Due to these essentially being horizontal levels, they can also serve as potential support/resistances, with breakouts potentially confirming new trends.
Users might be interested in obtaining new targets once one is reached, this can be done by enabling "New Target When Reached" in the target logic setting section, resulting in more frequent targets.
Lastly, users can restrict new target creation until current ones are reached. This can result in fewer and longer-term targets, with a higher reach rate.
🔹 Examples
The indicator can be applied to many overlay indicators that naturally produce crosses with the price, such as moving average, trailing stops, bands...etc.
Users can use trailing stops such as the SuperTrend or VStop to more easily create clean targets. Do note that certain SuperTrend scripts separate the upper and lower extremities of the SuperTrend into two different plot, which cannot be used with this tool, you may use the provided SuperTrend script below to have a compatible version with our tool:
//@version=5
indicator("SuperTrend", overlay = true)
factor = input.float(3, 'Factor', minval = 0)
atrLen = input.int(10, 'ATR Length', minval = 1)
= ta.supertrend(factor, atrLen)
plot(spt, 'SuperTrend', dir != dir ? na : dir < 0 ? #089981 : #f23645, 2)
plot(spt, 'Circles', dir > dir ? #f23645 : dir < dir ? #089981 : na, 3, plot.style_circles)
Using moving averages can produce more targets than other overlay indicators.
Users can apply the tool twice when using bands or any overlay indicator returning two outputs, using crossover targets for obtaining targets using the upper band as source and crossunder targets for targets using the lower band. We can also use the Trendlines with breaks indicator as example:
🔹 Dashboard
A dashboard is displayed on the top right of the chart, displaying the amount, reach rate of targets 1/2, and total amount.
This dashboard can be useful to evaluate the selected target distances relative to the selected conditions, with a higher reach rate suggesting the distance of the targets from the price allows them to be reached.
🔶 SETTINGS
Source: Indicator source used to create targets. Targets are created when the closing price crosses the specified source.
Show Target Labels: Display target labels on the chart.
Candle Coloring: Apply candle coloring based on the most recent active target.
🔹 Target
Crossover and Crossunder targets use the same settings below:
Show Target: Determines if the target is displayed or not.
Above Price Target: If selected, will create targets above the closing price.
Wait Until Reached: When enabled will not create a new target until an existing one is reached.
New Target When Reached: Will create a new target when an existing one is reached.
Evaluate Wicks: Will use high/low prices to determine if a target is reached. Unselecting this setting will use the closing price.
Target Distance From Price: Controls the distance of a target from the price. Can be determined in currencies/points, percentages, ATR multiples, or ticks.

Strategy Builder With IndicatorsThis strategy script is designed for traders who enjoy building systems using multiple indicators.
Please note: This script does not include any built-in indicators. Instead, it works by referencing the plot outputs of the indicators you’ve already added to your chart.
For example, if you add a MACD and an ATR indicator to your chart, you can assign their plot values as inputs in the settings panel of this strategy.
• MACD as a trigger
• ATR as a filter
How Filters Work
Filters check whether certain conditions are met before a trade can be opened. For instance, if you set a filter like ATR > 30, then no trade will be executed unless that condition is true — even if the trigger fires.
All filters are linked, meaning every active filter must be satisfied for a trade to occur.
How Triggers Work
Triggers are what actually fire a trade signal — such as a moving average crossover or RSI breaking above a specific level. Unlike filters, triggers are independent. Only one active trigger needs to be true for the trade to execute.
Thanks to its modular structure, this strategy can be used with any indicator of your choice.
⸻
Risk Management Features
In the settings, you’ll find flexible options for:
• Stop Loss (SL)
• Trailing Stop Loss (TSL)
• Multi Take-Profit (TP)
These features enhance trade safety and let you tailor your risk management.
SL types available:
• Tick-based SL
• Percent-based SL
• ATR-based SL
Once you select your preferred SL type, you can fine-tune its distance using the offset field.
Trailing SL allows your stop to follow price as it moves in your favor — helping to lock in profits.
Multi-TP lets you take profits at two different levels, helping you secure gains while leaving room for extended moves.
Breakeven option is also available to automatically move your SL to entry after reaching a profit threshold.
⸻
How to Build a Solid Strategy
Let’s break down a good setup into three key components:
1. Trend Filter
Avoid trading against the trend — that’s like swimming against the current.
Use a filter like:
• Supertrend
• Momentum indicators
• Candlestick bias, etc.
Example: In this case, I used Supertrend and filtered for trades only if the price is above the uptrend line.
2. Trigger Condition
Once we confirm the trend is on our side, we need a trigger to execute at the right moment. This can be:
• RSI cross
• Candlestick patterns
• Trendline breaks
• Moving average crossovers, etc.
Example: I used RSI crossing above 50 as the entry trigger.
3. Risk Management
Even in the right trend at the right time — anything can happen. That’s why you should always define Stop Loss and Take Profit levels.
⸻
And there you have it! Your strategy is ready to backtest, refine, and deploy with alerts for live trading.
Questions or suggestions? Feel free to reach out

Multi indicators tableThis is a comprehensive trading tool that presents an overview of the market in a tabular format. It consists of five distinct categories of trading indicators : Volatility, Trend, Momentum, Reversal, and Volume. Each category includes a series of indicators that are widely used in the trading communauty.
The Volatility category includes the Average True Range (ATR) and Bollinger Bands indicators. The Trend category comprises the Average Directional Index (ADX), four Exponential Moving Averages (EMAs), Aroon, Parabolic SAR, and the Supertrend. The Momentum category includes the Stochastic Relative Strength Index (StochRSI), Money Flow Index (MFI), Williams %R, Relative Strength Index (RSI), and Commodity Channel Index (CCI). The Reversal category includes Parabolic SAR, Moving Average Convergence Divergence (MACD), and PP Supertrend. Finally, the Volume category includes the Volume Exponential Moving Average (EMA) indicator.
The indicators states are easily readable, the indicator case is colored based on his actual state. A bullish color (green by default), a bearish color (red by default),
a very bullish color (dark green by default), a very bearish color (dark red by default) and a neutral color (gray by default) displayed when the indicator doesn't give us a clear signal. Some indicators do not have a very bullish or very bearish state. Concerning volatility indicators, the bullish color indicates high volatility, the bearish color indicates low volatility, and the neutral color indicates normal volatility.
Most of the indicators displayed in the table are customizable, and traders can choose to hide the categories they don't want to use. The Indicator provides a quick and easily readable view on the market and allows traders to reduce the number of indicators on their chart making it lighter and more readable.

Breadth Indicators NYSE Percent Above Moving AverageBreadth Indicators NYSE - transmits the processed data from the Barchart provider
NYSE - Breadth Indicators
S&P 500 - Breadth Indicators
DOW - Breadth Indicators
RUSSEL 1000 - Breadth Indicators
RUSSEL 2000 - Breadth Indicators
RUSSEL 3000 - Breadth Indicators
Moving Average - 5, 20, 50, 100, 150, 200
The "Percentage above 50-day SMA" indicator measures the percentage of stocks in the index trading above their 50-day moving average. It is a useful tool for assessing the general state of the market and identifying overbought and oversold conditions.
One way to use the "Percentage above 50-day SMA" indicator in a trading strategy is to combine it with a long-term moving average to determine whether the trend is bullish or bearish. Another way to use it is to combine it with a short-term moving average to identify pullbacks and rebounds within the overall trend.
The purpose of using the "Percentage above 50-day SMA" indicator is to participate in a larger trend with a better risk-reward ratio. By using this indicator to identify pullbacks and bounces, you can reduce the risk of entering trades at the wrong time.
Bull Signal Recap:
150-day EMA of $SPXA50R crosses above 52.5 and remains above 47.50 to set the bullish tone.
5-day EMA of $SPXA50R moves below 40 to signal a pullback
5-day EMA of $SPXA50R moves above 50 to signal an upturn
Bear Signal Recap:
150-day EMA of $SPXA50R crosses below 47.50 and remains below 52.50 to set the bearish tone.
5-day EMA of $SPXA50R moves above 60 to signal a bounce
5-day EMA of $SPXA50R moves below 50 to signal a downturn
Tweaking
There are numerous ways to tweak a trading system, but chartists should avoid over-optimizing the indicator settings. In other words, don't attempt to find the perfect moving average period or crossover level. Perfection is unattainable when developing a system or trading the markets. It is important to keep the system logical and focus tweaks on other aspects, such as the actual price chart of the underlying security.
What do levels above and below 50% signify in the long-term moving average?
A move above 52.5% is deemed bullish, and below 47.5% is deemed bearish. These levels help to reduce whipsaws by using buffers for bullish and bearish thresholds.
How does the short-term moving average work to identify pullbacks or bounces?
When using a 5-day EMA, a move below 40 signals a pullback, and a move above 60 signals a bounce.
How is the reversal of pullback or bounce identified?
A move back above 50 after a pullback or below 50 after a bounce signals that the respective trend may be resuming.
How can you ensure that the uptrend has resumed?
It’s important to wait for the surge above 50 to ensure the uptrend has resumed, signaling improved breadth.
Can the system be tweaked to optimize indicator settings?
While there are various ways to tweak the system, seeking perfection through over-optimizing settings is advised against. It's crucial to keep the system logical and focus tweaks on the price chart of the underlying security.
RUSSIAN \ Русская версия.
Индикатор "Процент выше 50-дневной скользящей средней" измеряет процент акций, торгующихся в индексе выше их 50-дневной скользящей средней. Это полезный инструмент для оценки общего состояния рынка и выявления условий перекупленности и перепроданности.
Один из способов использования индикатора "Процент выше 50-дневной скользящей средней" в торговой стратегии - это объединить его с долгосрочной скользящей средней, чтобы определить, является ли тренд бычьим или медвежьим. Другой способ использовать его - объединить с краткосрочной скользящей средней, чтобы выявить откаты и отскоки в рамках общего тренда.
Цель использования индикатора "Процент выше 50-дневной скользящей средней" - участвовать в более широком тренде с лучшим соотношением риска и прибыли. Используя этот индикатор для выявления откатов и отскоков, вы можете снизить риск входа в сделки в неподходящее время.
Краткое описание бычьего сигнала:
150-дневная ЕМА на уровне $SPXA50R пересекает отметку 52,5 и остается выше 47,50, что задает бычий настрой.
5-дневная ЕМА на уровне $SPXA50R опускается ниже 40, сигнализируя об откате
5-дневная ЕМА на уровне $SPXA50R поднимается выше 50, сигнализируя о росте
Обзор медвежьих сигналов:
150-дневная ЕМА на уровне $SPXA50R пересекает уровень ниже 47,50 и остается ниже 52,50, что указывает на медвежий настрой.
5-дневная ЕМА на уровне $SPXA50R поднимается выше 60, сигнализируя о отскоке
5-дневная ЕМА на уровне $SPXA50 опускается ниже 50, что сигнализирует о спаде
Корректировка
Существует множество способов настроить торговую систему, но графологам следует избегать чрезмерной оптимизации настроек индикатора. Другими словами, не пытайтесь найти идеальный период скользящей средней или уровень пересечения. Совершенство недостижимо при разработке системы или торговле на рынках. Важно поддерживать логику системы и уделять особое внимание другим аспектам, таким как график фактической цены базовой ценной бумаги.
Что означают уровни выше и ниже 50% в долгосрочной скользящей средней?
Движение выше 52,5% считается бычьим, а ниже 47,5% - медвежьим. Эти уровни помогают снизить риски, используя буферы для бычьих и медвежьих порогов.
Как краткосрочная скользящая средняя помогает идентифицировать откаты или отскоки?
При использовании 5-дневной ЕМА движение ниже 40 указывает на откат, а движение выше 60 указывает на отскок.
Как определяется разворот отката или отскока?
Движение выше 50 после отката или ниже 50 после отскока сигнализирует о возможном возобновлении соответствующего тренда.
Как вы можете гарантировать, что восходящий тренд возобновился?
Важно дождаться скачка выше 50, чтобы убедиться в возобновлении восходящего тренда, сигнализирующего о расширении диапазона.
Можно ли настроить систему для оптимизации настроек индикатора?
Хотя существуют различные способы настройки системы, не рекомендуется стремиться к совершенству с помощью чрезмерной оптимизации настроек. Крайне важно сохранить логичность системы и сфокусировать изменения на ценовом графике базовой ценной бумаги.

3 projection Indicators - PBands, PO & PBAll these indicators are by Mel Widner.
Projection Bands :
-------------------------------------------------------
These project market data along the trend with the maxima and minima of the projections defining the band. The method provides a way to signal potential direction changes relative to the trend. Usage is like any other trading band.
Projection Oscillator :
-------------------------------------------------------
This indicates the relative position of price with in the bands. It fluctuates between the values 0 to 100. You can configure the "basis" to make it oscillate around a specific value (for ex., basis=50 will make it oscillate between +50 and -50). EMA of PO (length configurable, default is 5) is plotted as a signal line. There is also an option to plot the difference (oscillator - signal), just like MACD histogram. When you see a divergence in this oscillator, remember that it just indicates a potential movement with in the band (for ex., a bullish divergence shown may cause the price to cross the median and move up to the top band).
Projection Bandwidth :
-------------------------------------------------------
This shows the % width of the projection bands. A trend reversal is signaled by a high value. Low value may indicate the start of a new trend. This is also a trend strength indicator.
More info: drive.google.com
Borrowed the color theme for this chart from @liw0. Thanks :)

IndicatorsLibrary "Indicators"
this has a calculation for the most used indicators.
macd4C(fastMa, slowMa)
this calculates macd 4c
Parameters:
fastMa (simple int) : is the period for the fast ma. the minimum value is 7
slowMa (simple int) : is the period for the slow ma. the minimum value is 7
Returns: the macd 4c value for the current bar
rsi(rsiSourceInput, rsiLengthInput)
this calculates rsi
Parameters:
rsiSourceInput (float) : is the source for the rsi
rsiLengthInput (simple int) : is the period for the rsi
Returns: the rsi value for the current bar
ao(source, fastPeriod, slowPeriod)
this calculates ao
Parameters:
source (float) : is the source for the ao
fastPeriod (int) : is the period for the fast ma
slowPeriod (int) : is the period for the slow ma
Returns: the ao value for the current bar
kernelAoOscillator(kernelFastLookback, kernelSlowLookback, kernelFastWeight, kernelSlowWeight, kernelFastRegressionStart, kernelSlowRegressionStart, kernelFastSmoothPeriod, kernelSlowSmoothPeriod, kernelFastSmooth, kernelSlowSmooth, source)
this calculates our own kernel ao oscillator which we made
Parameters:
kernelFastLookback (simple int)
kernelSlowLookback (simple int)
kernelFastWeight (simple float)
kernelSlowWeight (simple float)
kernelFastRegressionStart (simple int)
kernelSlowRegressionStart (simple int)
kernelFastSmoothPeriod (int)
kernelSlowSmoothPeriod (int)
kernelFastSmooth (bool)
kernelSlowSmooth (bool)
source (float) : is the source for the ao
Returns: the kernel ao oscillator value for the current bar, the colors for both the fast and slow kernel, the fast & slow kernel
signalLineKernel(lag, h, r, x_0, smoothColors, _src, c_bullish, c_bearish)
Parameters:
lag (int)
h (float)
r (float)
x_0 (int)
smoothColors (bool)
_src (float)
c_bullish (color)
c_bearish (color)
zigzagCalc(Depth, Deviation, Backstep, repaint, Show_zz, line_thick, text_color)
Parameters:
Depth (int)
Deviation (int)
Backstep (int)
repaint (bool)
Show_zz (bool)
line_thick (int)
text_color (color)

IndicatorsLibrary "Indicators"
cmf(lookback, n_to_smooth)
Calculates the Chaikin's Money Flow.
Parameters:
lookback (simple int)
n_to_smooth (simple int)
Returns: float The Money Flow value.
cmma(lookback, atr_length)
Calculates the CMMA (Close Minus Moving Average) indicator.
Parameters:
lookback (simple int)
atr_length (simple int)
Returns: float The CMMA value.
macd(fast_length, slow_length, n_to_smooth)
Calculates the normalized and scaled MACD.
Parameters:
fast_length (simple int)
slow_length (simple int)
n_to_smooth (simple int)
Returns: A tuple containing .
stochK(length, n_to_smooth)
Calculates a simplified Stochastic Oscillator.
Uses: 100 * ta.sma((close - lowest_low) / (highest_high - lowest_low), n_to_smooth)
Parameters:
length (simple int)
n_to_smooth (simple int)
Returns: float The Stochastic %K value.
williamsR(length)
Calculates the Williams %R using the stochK function.
Uses: -1 * (100 - stoch(length, 1))
Parameters:
length (simple int)
Returns: float The Williams %R value.

Indicators & Conditions Test Framework [DTU]Hello All,
This script is a framework to build strategies by combining indicators and conditions (long, short, exits). You are able to analyze your strategies in realtime by changing the input parameters related to indicators, conditions and their combinations.
OVERVIEW
With this Study/Strategy framework, you will be able to create strategy conditions, display them on the chart, and test them using existing indicators as well as external and custom indicators that you can add.
The main purpose of the Framework is to choose your indicators to be used in the conditions and test your strategy by producing your "Long, short, Exit long, Exit short" combinations.
Although may be, it can be a bit difficult and complicated at first start, but you can understand the logic on its use in a very short time.
Notes:
I removed external links off descriptive images and video to be comply with Trading view violation House Rules
Since I am new in the community and still trying to understand the pine script language I can make errors and violations on my script. Please Inform me on any issue that I made..
HOW TO
STEP 1: SETTINGS ______________________________________________________________________________________________________
SOURCE, TIMEFRAME, SECURITY
Select the Source, timeframe and Secure type that your indicators will use.
Here, the Secure entry consists of 3 parts and the f_security function is used to determine it.
a)Secure
This option is defined as reducing repaint in tradingview calculations as much as possible. The following function is used.
request.security(_symbol, _res, _src , lookahead=barmerge.lookahead_on)
b)Semi Secure
While this option can reduce repaint in tradingview calculations as much as possible, it is less secure. The following function is used.
request.security(_symbol, _res, _src )
c)Repaint
This option turns on the repaint feature. The following function is used.
request.security(_symbol, _res, _src ) : na
Ind Source:
You can the source that indicators will use their own calculations
Ext Source:
You can import external Indicator sources from here . It appears on condition/combination area as "EXT".
To export the External indicator plot it with a title. It will be visible in source dropdown input
PERIOD , ALERTS...
Period:
Determine your strategy testing period by selecting start and end date/time
(!!! According to your tradingview subscription, it takes the last 5000, 10000.. bars.
The extra bar option may cause problems such as not appearing in the calculations or errors).
Plot Alerts:
Plot condition result as alerts arrows on the chart's bottom for "LONG" and the top for "SHORT" entries, exits
Close on opposite:
When selected, a long entry gets closed when a short entry opens and vice versa
Show Profit:
It appears if script is in strategy mode (not in study) this can display current or open profit for better reanalyzing your strategy entry exit points. (Currently under development)
PLOT TYPE OPERATIONS
This option has 4 entries
a) Mult
Sets the multiplier for the selected Plot Type (stochastic, Percentrank, Org Range (-1,1) ) except for "Original" in the range (-1,1).
EXAMPLE: When 1000 is selected, the indicator in the range of (-1,1) will appear in the range of (-1000, 1000) on the screen.
b) Shift
It determines the shift that will appear on the screen for the selected Plot Type (stochastic, Percentrank,Org Range (-1,1) ) in the range (-1,1) other than "Original".
EXAMPLE: When Shift:35000 and mult:1000 are selected, the indicator will appear in the range (34000, 36000) on the screen.
c) Smooth
This option (only for Stochastic & PercentRank) allows to smooth the indicator to be displayed.
Here, tradinview ta.swma function is used.
b) hline
Adjusts the horizontal lines to appear on the screen according to the mult factor for the range (-1,1)
The lines represent the values (-1, -05, 0, 05, 1)
STEP 2: INDICATORS ______________________________________________________________________________________________________
You need to choose indicators that you can use in strategy conditions.
Here, the indicators come from the dturkuler/lib_Indicators_DT open script library defined in the code
In addition, you can add the indicators that you will create in the area defined in the code to this list..
You can also import external indicators and test them with other variables on the system..
You can choose a maximum of 5 indicators that you can use in total. (can be increased in new versions)
Indicators are categorized in 3 main sections
Indicator Selection:
You can select your indicators from this area
a)Moving Averages
These are indicators such as EMA, SMA that you can show on the stock. They come from the library.
These indicators are fed from Settings/source. Only the length value can be used as a parameter.
In addition, line colors can be changed..
As of now, there are 28 indicators in the library in total and 5 indicators are left as future use for this field for now.
b)Other Indicators
These are different indicators from the stock value such as RSI, COG. They come from the library. These indicators are fed from Settings/source.
Only the length value can be used as a parameter. In addition, line colors can be changed.
As of now, there are 24 indicators in the library in total and 5 indicators are left as a future use for this field for now.
c)Custom Indicators
These indicators are the ones you can create by programming yourself in the source code..
The area at the bottom of the settings screen is reserved for the parameters of this type of indicators.
Indicator Length:
You can update your selected indicator length value from here. (Not: it doesn't work for custom indicators since they have their parameter on cust. Ind. input screen )
Indicator Plot Type:
Next to the indicators, there is an input selection field about how they will be displayed on the screen.
a)Original
The indicator is displayed on the screen with its current values. It is an ideal solution for displaying moving average indicators such as (EMA, SMA) over current stock.
Since the values of indicators such as (RSI, COB) are low (-100,100 : -1.1), they appear at the bottom of the screen and make analysis difficult.
For this reason, other options may be more suitable for these.
b)Stochastic
The indicator is displayed on the screen with stochastic calculation in the range of -1.1.
It uses the stochastic(50) calculation method to spread indicators such as (RSI, COB) over the range (-1,1).
Indicators in this selection can be fixed and monitored under stock on the screen with the parameters under the Plot Type section.
You can see the original values of the relevant indicator on the Data Window screen.
(!!! Do not use the values on the chart in your condition calculations. Instead, get the values from Data Window)
c)PercentRank
The indicator is displayed on the screen with stochastic calculation in the range of -1.1. .
Since the values of indicators such as (RSI, COB) are low (-100,100 : -1.1), they appear at the bottom of the screen and make analysis difficult.
Indicators in this selection can be fixed and monitored under stock on the screen with the parameters under the Plot Type section.
You can see the original values of the relevant indicator on the Data Window screen
((!!! Do not use the values on the chart in your condition calculations. Instead, get the values from Data Window)
d)Org Range (-1,1)
If your indicator is in the range of -1.1, your indicator will be displayed on the screen with its original calculation in the range of -1.1.
Indicators in this selection can be fixed and monitored under stock on the screen with the parameters under the Plot Type section.
You can see the original values of the relevant indicator on the Data Window screen.
(!!! Do not use the values on the chart in your fitness calculations. Instead, get the values from Data Window)
STEP 2 NOTES:
STEP 3: CONDITIONS ______________________________________________________________________________________________________
After choosing the indicators you will use in the conditions, you move on to the "CONDITIONS" section.
There are 4 conditions type here.
• LONG ENTRY CONDITION
• SHORT ENTRY CONDITION
• LONG CLOSE CONDITION
• SHORT CLOSE CONDITION
The use of each condition is the same.
There are 3 combinations you can use in each condition. (can be increased in new versions)
a)COMBINATIONS
There are 3 combinations you can use in each condition. (can be increased in new versions)
Each combination are build from 4 parts
1)1st Indicator
If set to "NONE" this combination will not be used on calculations. You can select
IND1-5: from indicators (See above),
EXT: value from externally imported indicator
Stock built-in values: close, open...
2)Operator
Selected Operator compares 1st Indicator with the 2nd one. You can select different operators such as
crossover, crossunder, cross,>,<,=....
3)2nd Indicator
This indicator will be compared with the 1st one via selected Operator. You can select
IND1-5: from indicators (See above),
VALUE: a float value defined in the combinations value parameter
EXT: value from externally imported indicator
Stock builtin values: close,open...
4)Value
When the 2nd indicator field is "VALUE", value area compares the entered value.
ex: 1st indicator="open", op=">", 2nd indicator="VALUE", value=3000.12 means is(close>3000.12)
In other conditions, it compares the previous values of the indicator.
ex: 1st indicator="open", op=">" 2nd indicator is "close" and value is 2 means is(open>close )
EXAMPLES:
indicator 1= "IND1", Operator=">", indicator 2= "IND2" => is(IND1>IND2)
indicator 1= "IND1", Operator=">", indicator 2= "VALUE", "0.1" => is(IND1>0.9)
indicator 1= "IND2", Operator="crossover", indicator 2= "IND1" => is(IND2 crossover IND1) : like a=ta.crossover(IND2, IND1)
indicator 1= "IND1", Operator="<", indicator 2= "close" => is(IND1>close)
indicator 1= "IND1", Operator="<", indicator 2= "EXT" => is(IND1>EXT) , EXT mean external imported indicator that define on settings section
indicator 1= "IND1", Operator="<", indicator 2= "IND1", Value="1" => is (IND1>IND1 )
b)JOIN COMBINATIONS
Each combination in Condition is compared with the next one via JOIN operator
The join operator can be selected as AND or OR.
Examples:
1st combination= is(IND1>0.9) true
2nd combination= is(IND2 crossover IND1) false
1st combination "AND" 2ndcombination" => false (is(IND1>0.9) AND is(IND2 crossover IND1))
1st combination "OR" 2nd combination" => true (is(IND1>0.9) OR is(IND2 crossover IND1))
STEP 3 NOTES:
When the 2nd indicator field is "VALUE", value area compares the entered value. In other conditions, it compares the previous values of the indicator.
In cases where "VALUE" is not selected, integer values must be entered in this field. (float should not be entered. ie 1, 2 should be entered)
!!!If the 1st indicator is "NONE" in the combination, that combination is cancelled.
Each combination returns true/false, allowing the selected value to be compared with another value
Example: EMA(21)>EMA(50) returns true under all conditions or (EMA(21) crossover EMA(50)) returns true when passed.
You can use , Value of 5 indicators (IND1-IND5) or (VALUE) that you have defined in combinations or import indicator (EXT) or stock values (close, open, high...) in your calculations.
combination Compares the 1st indicator with 2nd indicator via the operator.
STEP 4: CUSTOM INDICATORS ______________________________________________________________________________________________________
There is an area in the code for designing Custom Indicators.
Here you can design your own indicators and use them in the framework.
You can also create unlimited parameters for your indicators in the SETTINGS custom indicator field.
For now, only 3 Custom indicators have been defined.
Examples are entered in the code for custom indicators.
STEP 4 NOTES:
Including / updating custom to the code is explained in the source code
• LIMITATIONS:
!!! According to your tradingview subscription, it takes the last 5000, 10000.. bars. More bar options may cause problems such as not appearing in the calculations or errors.
• RAMBLINGS:
• NOTES [ /i]
This Script can be used as an indicator if the last strategy parts in the code are commented out and converted to the initial strategy study.
It was originally prepared for my use with my own strategy framework and has export functions accordingly.
When integrated to my own strategy framework it brings many more features over strategy definition of trades.
• TODO [ /i]
TODO: Add tooltips to the settings screen
TODO: Add double triple, Quatr factor for all indicators (convert any indicator to factor2-4 facotr. ex: EMA to DEMA, TEMA, QEMA...)
TODO: Add factorized Fibo avg range indicator (good for trend definition and entry exit points)
TODO: Add bands to the indicator and conditions
TODO: Add debug window for exporting indicator's parameters
TODO: Add isRising(value) isFalling(value), is...(value) .... to combinations (they can be used as custom indicator also
TODO: Reassess condition entry screen for user friendly GUI
TODO: Increase # conditions from 3 to 4
TODO: Reassess strategy entries, exit and close (should be improved)
TODO: Add Alerts, Condiional alerts for indicator (study) part
TODO: Create export function v3 for Pinecoders Indicator framework
• THANKS:
For Pine script format docs RicardoSantos .
For Pine script coding standards Pinecoders .
For moving average script used on library s RodrigoKazuma .

Indicators: Volume Zone Indicator & Price Zone IndicatorVolume Zone Indicator (VZO) and Price Zone Indicator (PZO) are by Waleed Aly Khalil.
Volume Zone Indicator (VZO)
------------------------------------------------------------
VZO is a leading volume oscillator that evaluates volume in relation to the direction of the net price change on each bar.
A value of 40 or above shows bullish accumulation. Low values (< 40) are bearish. Near zero or between +/- 20, the market is either in consolidation or near a break out. When VZO is near +/- 60, an end to the bull/bear run should be expected soon. If that run has been opposite to the long term price trend direction, then a reversal often will occur.
Traditional way of looking at this also works:
* +/- 40 levels are overbought / oversold
* +/- 60 levels are extreme overbought / oversold
More info:
drive.google.com
Price Zone Indicator (PZO)
------------------------------------------------------------
PZO is interpreted the same way as VZO (same formula with "close" substituted for "volume").
Chart Markings
------------------------------------------------------------
In the chart above,
* The red circles indicate a run-end (or reversal) zones (VZO +/- 60).
* Blue rectangle shows the consolidation zone (VZO betwen +/- 20)
I have been trying out VZO only for a week now, but I think this has lot of potential. Give it a try, let me know what you think.

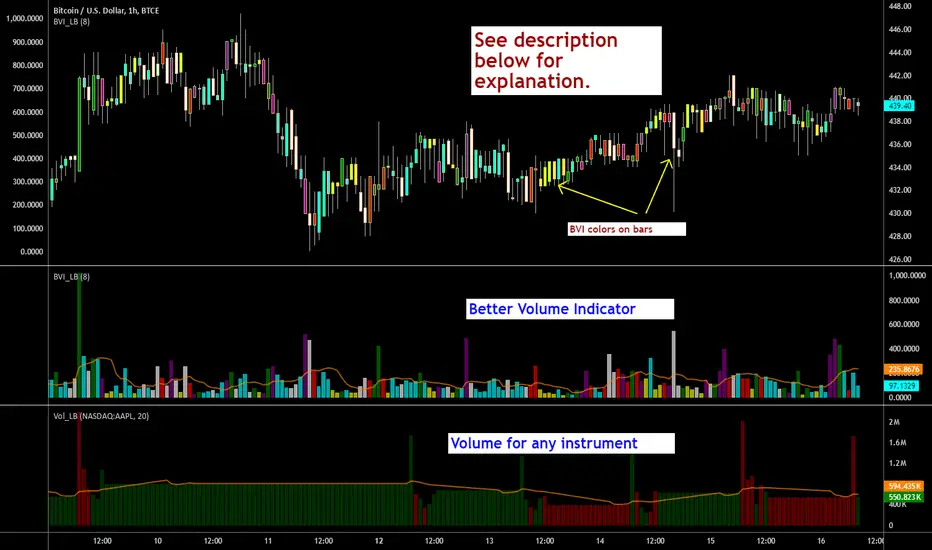
Indicators: Better Volume Indicator & InstrumentVolumeBetter Volume Indicator
-----------------------------------------
This is a direct port of a famous indicator from Tradestation platform.
BVI improves on your typical volume histogram by coloring the bars based on 5 criteria:
* Volume Climax Up – high volume, high range, up bars (red)
* Volume Climax Down – high volume, high range, down bars (white)
* High Volume Churn – high volume, low range bars (green, barcolor= blue)
* Low Volume – low volume bars (yellow)
* Volume Climax plus High Volume Churn – both the above conditions (magenta)
When there are no volume signals the default histogram bar coloring is cyan.
Bars can also be colored to match volume color. Enable "Change BarColors?" in the options page.
Volume Climax Up bars are typically seen at:
* The start of up trends
* The end of up trends, and
* Pullbacks during down trends.
Volume Climax Down bars are typically seen at:
* The start of down trends
* The end of down trends, and
* Pullbacks during up trends.
High Volume Churn bars are typically seen at:
* The end of up trends
* The end of down trends, and
* Profit taking mid-trend.
Low Volume bars are typically seen at:
* The end of up trends
* The end of down trends, and
* Pullbacks mid-trend.
More info:
emini-watch.com
Instrument Volume
-----------------------------------------
This is a simple script that allows you to plot volume for any instrument.
Very handy when you want to compare volumes. Just add multiple instances and select the symbol you want via Options page.
This script also gets close/open for the selected symbol. If you are itching to get started on Pinescripting (scripting language used at TV), I suggest trying out the following, using this script as the template:
- Show RSI for any instrument
(hint: "close" for the selected symbol is already in script. Do a "plot(rsi(c, 14))")
- MACD / CCI / ....
- Plot the difference (not correlation). This may be of interest in some instruments.
For ex. BTC in BTCE exchange mostly lags BITSTAMP.
Hope this piques your interest in Pine. Feel free to post in the Pinescript room if you have any queries.
Indicators: Traders Dynamic Index, HLCTrends and Trix Ribbon1) Trix Ribbon
===============================================================
This was built on request. Many Stock/FX traders overlay multiple Trix lines to form the ribbon, this indicator makes it easy.
Also, optionally this can plot a BollingerBand on Trix_1.
More info on Trix:
stockcharts.com
2) High/Low/Close Trend Indicator
===============================================================
Simple indicator using EMAs of H/L/C. If blue line is above the red line, the trend is up, else down. Keep an eye on the zero line too.
3) Traders Dynamic Index
===============================================================
This hybrid indicator helps to decipher and monitor market conditions related to trend direction, market strength, and market volatility.
TDI has the following components:
* Green line = RSI Price line
* Red line = Trade Signal line
* Blue lines = Volatility Bands
* Orange line = Market Base Line
Trend Direction - Immediate and Overall:
----------------------------------------------------
* Immediate = Green over Red...price action is moving up.
Red over Green...price action is moving down.
* Overall = Orange line trends up and down generally between the lines 32 & 68. Watch for Orange line to bounces off these lines for market reversal. Trade long when price is above the Orange line, and trade short when price is below.
Market Strength & Volatility - Immediate and Overall:
----------------------------------------------------
* Immediate = Green Line - Strong = Steep slope up or down.
Weak = Moderate to Flat slope.
* Overall = Blue Lines - When expanding, market is strong and trending. When constricting, market is weak and in a range. When the Blue lines are extremely tight in a narrow range, expect an economic announcement or other market condition to spike the market.
Entry conditions:
----------------------------------------------------
* Scalping - Long = Green over Red,
Short = Red over Green
* Active - Long = Green over Red & Orange lines
Short = Red over Green & Orange lines
* Moderate - Long = Green over Red, Orange, & 50 lines
Short= Red over Green, Green below Orange & 50 line
Exit conditions:
----------------------------------------------------
If Green crosses either Blue lines, consider exiting when the Green line crosses back over the Blue line.
* Long = Green crosses below Red
* Short = Green crosses above Red
More info on a complete system using TDI:
www.forexmt4.com

Indicators: MMA and 3 oscillatorsGuppy Multiple Moving Averages
---------------------------------
Developed by Daryl Guppy, the basic idea of Multiple moving average(MMA) is to view the trend as two band of moving averages – short term band and long term band.
Shortterm averages capture the inferred behaviour of traders and long term represents the investors. Uses fractal repetition to identify points of agreement and disagreement which precede significant trend changes.
Short intro on interpreting the signals:
drive.google.com
More info:
www.guppytraders.com
Guppy Oscillator
---------------------------------
The Guppy MMA Oscillator, developed by Leon Wilson, is an oscillator representation of difference between GMMA ribbons. Look for signal crosses for the triggers.
Linda Raschke (3/10) Oscillator
---------------------------------
This oscillator is similar to having a MACD of (3,10,16), the nuances are explained by Linda Raschke in her manual "Professional Trading Techniques":
www.lbrgroup.com
Ian Oscillator
---------------------------------
Simple EMA difference converted to an oscillator. Use the signal crosses as triggers.

Indicators: Hurst Bands and Hurst OscillatorThese 2 indicators are derivative work from Jim Hurst's book - "The Magic of Stock Transaction Timing".
The bands are % bands around a median that gets calculated according to Hurst's formula. The outer bands (called ExtremeBands) signify extreme overbought/oversold conditions. Inner bands signify potential pullback points. As you can see, they also act as dynamic S/R levels.
The oscillator bands match the bands overlaid on price, so you will get an excellent indication of where the price is gonna do by using the oscillator along with the bands. Note that Hurst Oscillator can be used separately too, there is no technical dependency on Hurst Bands.
More info on Hurst Method:
www.readtheticker.com
