Indicators Combination Framework v3 IND [DTU]Hello All,
This script is a framework to analyze and see the results by combine selected indicators for (long, short, longexit, shortexit) conditions.
I was designed this for beginners and users to facilitate to see effects of the technical indicators combinations on the chart WITH NO CODE
You can improve your strategies according the results of this system by connecting the framework to a strategy framework/template such as Pinecoder, Benson, daveatt or custom.
This is enhanced version of my previous indicator "Indicators & Conditions Test Framework "
Currently there are 93 indicators (23 newly added) connected over library. You can also import an External Indicator or add Custom indicator (In the source)
It is possible to change it from Indicator to strategy (simple one) by just remarking strategy parts in the source code and see real time profit of your combinations
Feel free to change or use it in your source
Special thanks goes to Pine wizards: Trading view (built-in Indicators), @Rodrigo, @midtownsk8rguy, @Lazybear, @Daveatt and others for their open source codes and contributions
SIMPLE USAGE
1. SETTING: Show Alerts= True (To see your entries and Exists)
2. Define your Indicators (ex: INDICATOR1: ema(close,14), INDICATOR2: ema(close,21), INDICATOR3: ema(close,200)
3. Define Your Combinations for long & Short Conditions
a. For Long: (INDICATOR1 crossover INDICATOR2) AND (INDICATOR3 < close)
b. For Short: (INDICATOR1 crossunder INDICATOR2) AND (INDICATOR3 > close)
4. Select Strategy/template (Import strategy to chart) that you export your signals from the list
5. Analyze the best profit by changing Indicators values
SOME INDICATORS DETAILS
Each Indicator includes:
- Factorization : Converting the selected indicator to Double, triple Quadruple such as EMA to DEMA, TEMA QEMA
- Log : Simple or log10 can be used for calculation on function entries
- Plot Type : You can overlay the indicator on the chart (such ema) or you can use stochastic/Percentrank approach to display in the variable hlines range
- Extended Parametes : You can use default parameters or you can use extended (P1,P2) parameters regarding to indicator type and your choice
- Color : You can define indicator color and line properties
- Smooth : you can enable swma smooth
- indicators : you can select one of the 93 function like ema(),rsi().. to define your indicator
- Source : you can select from already defined indicators (IND1-4), External Indicator (EXT), Custom Indicator (CUST), and other sources (close, open...)
CONDITION DETAILS
- There are are 4 type of conditions, long entry, short entry, long exit, short exit.
- Each condition are built up from 4 combinations that joined with "AND" & "OR" operators
- You can see the results by enabling show alerts check box
- If you only wants to enter long entry and long exit, just fill these conditions
- If "close on opposite" checkbox selected on settings, long entry will be closed on short entry and vice versa
COMBINATIONS DETAILS
- There are 4 combinations that joined with "AND" & "OR" operators for each condition
- combinations are built up from compare 1st entry with 2nd one by using operator
- 1st and 2nd entries includes already defined indicators (IND1-5), External Indicator (EXT), Custom Indicator (CUST), and other sources (close, open...)
- Operators are comparison values such as >,<, crossover,...
- 2nd entry include "VALUE" parameter that will use to compare 1st indicator with value area
- If 2nd indicator selected different than "VALUE", value are will mean previous value of the selection. (ex: value area= 2, 2nd entry=close, means close )
- Selecting "NONE" for the 1st entry will disable calculation of current and following combinations
JOINS DETAILS
- Each combination will join wiht the following one with the JOIN (AND, OR) operator (if the following one is not equal "NONE")
CUSTOM INDICATOR
- Custom Indicator defines harcoded in the source code.
- You can call it with "CUST" in the Indicator definition source or combination entries source
- You can change or implement your custom indicator by updating the source code
EXTERNAL INDICATOR
- You can import an external indicator by selecting it from the ext source.
- External Indicator should be already imported to the chart and it have an plot function to output its signal
EXPORTING SIGNAL
- You can export your result to an already defined strategy template such as Pine coders, Benson, Daveatt Strategy templates
- Or you can define your custom export for other future strategy templates
ALERTS
- By enabling show alerts checkbox, you can see long entry exits on the bottom, and short entry exits aon the top of the chart
ADDITIONAL INFO
- You can see all off the inputs descriptions in the tooltips. (You can also see the previous version for details)
- Availability to set start, end dates
- Minimize repainting by using security function options (Secure, Semi Secure, Repaint)
- Availability of use timeframes
-
Version 3 INDICATORS LIST (More to be added):
▼▼▼ OVERLAY INDICATORS ▼▼▼
alma(src,len,offset=0.85,sigma=6).-------Arnaud Legoux Moving Average
ama(src,len,fast=14,slow=100).-----------Adjusted Moving Average
accdist().-------------------------------Accumulation/distribution index.
cma(src,len).----------------------------Corrective Moving average
dema(src,len).---------------------------Double EMA (Same as EMA with 2 factor)
ema(src,len).----------------------------Exponential Moving Average
gmma(src,len).---------------------------Geometric Mean Moving Average
highest(src,len).------------------------Highest value for a given number of bars back.
hl2ma(src,len).--------------------------higest lowest moving average
hma(src,len).----------------------------Hull Moving Average.
lagAdapt(src,len,perclen=5,fperc=50).----Ehlers Adaptive Laguerre filter
lagAdaptV(src,len,perclen=5,fperc=50).---Ehlers Adaptive Laguerre filter variation
laguerre(src,len).-----------------------Ehlers Laguerre filter
lesrcp(src,len).-------------------------lowest exponential esrcpanding moving line
lexp(src,len).---------------------------lowest exponential expanding moving line
linreg(src,len,loffset=1).---------------Linear regression
lowest(src,len).-------------------------Lovest value for a given number of bars back.
mcginley(src, len.-----------------------McGinley Dynamic adjusts for market speed shifts, which sets it apart from other moving averages, in addition to providing clear moving average lines
percntl(src,len).------------------------percentile nearest rank. Calculates percentile using method of Nearest Rank.
percntli(src,len).-----------------------percentile linear interpolation. Calculates percentile using method of linear interpolation between the two nearest ranks.
previous(src,len).-----------------------Previous n (len) value of the source
pivothigh(src,BarsLeft=len,BarsRight=2).-Previous pivot high. src=src, BarsLeft=len, BarsRight=p1=2
pivotlow(src,BarsLeft=len,BarsRight=2).--Previous pivot low. src=src, BarsLeft=len, BarsRight=p1=2
rema(src,len).---------------------------Range EMA (REMA)
rma(src,len).----------------------------Moving average used in RSI. It is the exponentially weighted moving average with alpha = 1 / length.
sar(start=len, inc=0.02, max=0.02).------Parabolic SAR (parabolic stop and reverse) is a method to find potential reversals in the market price direction of traded goods.start=len, inc=p1, max=p2. ex: sar(0.02, 0.02, 0.02)
sma(src,len).----------------------------Smoothed Moving Average
smma(src,len).---------------------------Smoothed Moving Average
super2(src,len).-------------------------Ehlers super smoother, 2 pole
super3(src,len).-------------------------Ehlers super smoother, 3 pole
supertrend(src,len,period=3).------------Supertrend indicator
swma(src,len).---------------------------Sine-Weighted Moving Average
tema(src,len).---------------------------Triple EMA (Same as EMA with 3 factor)
tma(src,len).----------------------------Triangular Moving Average
vida(src,len).---------------------------Variable Index Dynamic Average
vwma(src,len).---------------------------Volume Weigted Moving Average
volstop(src,len,atrfactor=2).------------Volatility Stop is a technical indicator that is used by traders to help place effective stop-losses. atrfactor=p1
wma(src,len).----------------------------Weigted Moving Average
vwap(src_).------------------------------Volume Weighted Average Price (VWAP) is used to measure the average price weighted by volume
▼▼▼ NON OVERLAY INDICATORS ▼▼
adx(dilen=len, adxlen=14, adxtype=0).----adx. The Average Directional Index (ADX) is a used to determine the strength of a trend. len=>dilen, p1=adxlen (default=14), p2=adxtype 0:ADX, 1:+DI, 2:-DI (def:0)
angle(src,len).--------------------------angle of the series (Use its Input as another indicator output)
aroon(len,dir=0).------------------------aroon indicator. Aroons major function is to identify new trends as they happen.p1 = dir: 0=mid (default), 1=upper, 2=lower
atr(src,len).----------------------------average true range. RMA of true range.
awesome(fast=len=5,slow=34,type=0).------Awesome Oscilator is an indicator used to measure market momentum. defaults : fast=len= 5, p1=slow=34, p2=type: 0=Awesome, 1=difference
bbr(src,len,mult=1).---------------------bollinger %%
bbw(src,len,mult=2).---------------------Bollinger Bands Width. The Bollinger Band Width is the difference between the upper and the lower Bollinger Bands divided by the middle band.
cci(src,len).----------------------------commodity channel index
cctbbo(src,len).-------------------------CCT Bollinger Band Oscilator
change(src,len).-------------------------A.K.A. Momentum. Difference between current value and previous, source - source . is most commonly referred to as a rate and measures the acceleration of the price and/or volume of a security
cmf(len=20).-----------------------------Chaikin Money Flow Indicator used to measure Money Flow Volume over a set period of time. Default use is len=20
cmo(src,len).----------------------------Chande Momentum Oscillator. Calculates the difference between the sum of recent gains and the sum of recent losses and then divides the result by the sum of all price movement over the same period.
cog(src,len).----------------------------The cog (center of gravity) is an indicator based on statistics and the Fibonacci golden ratio.
copcurve(src,len).-----------------------Coppock Curve. was originally developed by Edwin Sedge Coppock (Barrons Magazine, October 1962).
correl(src,len).-------------------------Correlation coefficient. Describes the degree to which two series tend to deviate from their ta.sma values.
count(src,len).--------------------------green avg - red avg
cti(src,len).----------------------------Ehler s Correlation Trend Indicator by
dev(src,len).----------------------------ta.dev() Measure of difference between the series and its ta.sma
dpo(len).--------------------------------Detrended Price OScilator is used to remove trend from price.
efi(len).--------------------------------Elders Force Index (EFI) measures the power behind a price movement using price and volume.
eom(len=14,div=10000).-------------------Ease of Movement.It is designed to measure the relationship between price and volume.p1 = div: 10000= (default)
falling(src,len).------------------------ta.falling() Test if the `source` series is now falling for `length` bars long. (Use its Input as another indicator output)
fisher(len).-----------------------------Fisher Transform is a technical indicator that converts price to Gaussian normal distribution and signals when prices move significantly by referencing recent price data
histvol(len).----------------------------Historical volatility is a statistical measure used to analyze the general dispersion of security or market index returns for a specified period of time.
kcr(src,len,mult=2).---------------------Keltner Channels Range
kcw(src,len,mult=2).---------------------ta.kcw(). Keltner Channels Width. The Keltner Channels Width is the difference between the upper and the lower Keltner Channels divided by the middle channel.
klinger(type=len).-----------------------Klinger oscillator aims to identify money flow’s long-term trend. type=len: 0:Oscilator 1:signal
macd(src,len).---------------------------MACD (Moving Average Convergence/Divergence)
mfi(src,len).----------------------------Money Flow Index s a tool used for measuring buying and selling pressure
msi(len=10).-----------------------------Mass Index (def=10) is used to examine the differences between high and low stock prices over a specific period of time
nvi().-----------------------------------Negative Volume Index
obv().-----------------------------------On Balance Volume
pvi().-----------------------------------Positive Volume Index
pvt().-----------------------------------Price Volume Trend
ranges(src,upper=len, lower=-5).---------ranges of the source. src=src, upper=len, v1:lower=upper . returns: -1 source=upper otherwise 0
rising(src,len).-------------------------ta.rising() Test if the `source` series is now rising for `length` bars long. (Use its Input as another indicator output)
roc(src,len).----------------------------Rate of Change
rsi(src,len).----------------------------Relative strength Index
rvi(src,len).----------------------------The Relative Volatility Index (RVI) is calculated much like the RSI, although it uses high and low price standard deviation instead of the RSI’s method of absolute change in price.
smi_osc(src,len,fast=5, slow=34).--------smi Oscillator
smi_sig(src,len,fast=5, slow=34).--------smi Signal
stc(src,len,fast=23,slow=50).------------Schaff Trend Cycle (STC) detects up and down trends long before the MACD. Code imported from
stdev(src,len).--------------------------Standart deviation
trix(src,len) .--------------------------the rate of change of a triple exponentially smoothed moving average.
tsi(src,len).----------------------------The True Strength Index indicator is a momentum oscillator designed to detect, confirm or visualize the strength of a trend.
ultimateOsc(len.-------------------------Ultimate Oscillator indicator (UO) indicator is a technical analysis tool used to measure momentum across three varying timeframes
variance(src,len).-----------------------ta.variance(). Variance is the expectation of the squared deviation of a series from its mean (ta.sma), and it informally measures how far a set of numbers are spread out from their mean.
willprc(src,len).------------------------Williams %R
wad().-----------------------------------Williams Accumulation/Distribution.
wvad().----------------------------------Williams Variable Accumulation/Distribution.
HISTORY
v3.01
ADD: 23 new indicators added to indicators list from the library. Current Total number of Indicators are 93. (to be continued to adding)
ADD: 2 more Parameters (P1,P2) for indicator calculation added. Par:(Use Defaults) uses only indicator(Source, Length) with library's default parameters. Par:(Use Extra Parameters P1,P2) use indicator(Source,Length,p1,p2) with additional parameters if indicator needs.
ADD: log calculation (simple, log10) option added on indicator function entries
ADD: New Output Signals added for compatibility on exporting condition signals to different Strategy templates.
ADD: Alerts Added according to conditions results
UPD: Indicator source inputs now display with indicators descriptions
UPD: Most off the source code rearranged and some functions moved to the new library. Now system work like a little bit frontend/backend
UPD: Performance improvement made on factorization and other source code
UPD: Input GUI rearranged
UPD: Tooltips corrected
REM: Extended indicators removed
UPD: IND1-IND4 added to indicator data source. Now it is possible to create new indicators with the previously defined indicators value. ex: IND1=ema(close,14) and IND2=rsi(IND1,20) means IND2=rsi(ema(close,14),20)
UPD: Custom Indicator (CUST) added to indicator data source and Combination Indicator source.
UPD: Volume added to indicator data source and Combination Indicator source.
REM: Custom indicators removed and only one custom indicator left
REM: Plot Type "Org. Range (-1,1)" removed
UPD: angle, rising, falling type operators moved to indicator library
Cerca negli script per "indicators"

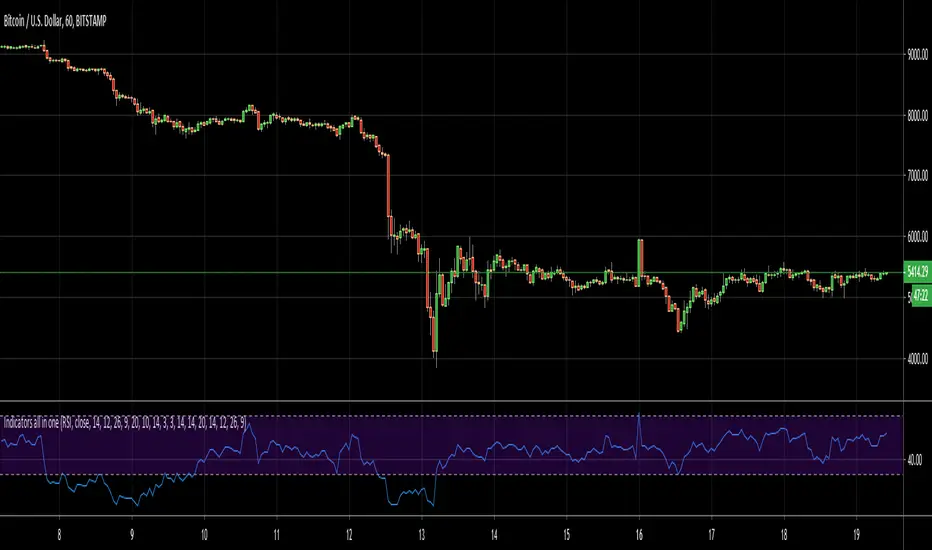
Indicators all in oneHello Everyone . Sometimes we need some indicators and each one needs seperated window. with this tool we can see indicators by choosing it from pull down menu, in the same window.
Currently you can choose RSI, MACD, Commodity Channel Index (CCI), Momentum, Stochastic, Stochastic RSI, Directional Movement Index (DMI), Chaikin Money Flow (CMF), On-Balance Volume (OBV), Average True Range (ATR), Volume Weigthed MACD (VWMACD).
some screen shots:
DMI:
MACD:
Stochastic RSI
Let me know if you need any other indicator in this tool.
Enjoy!
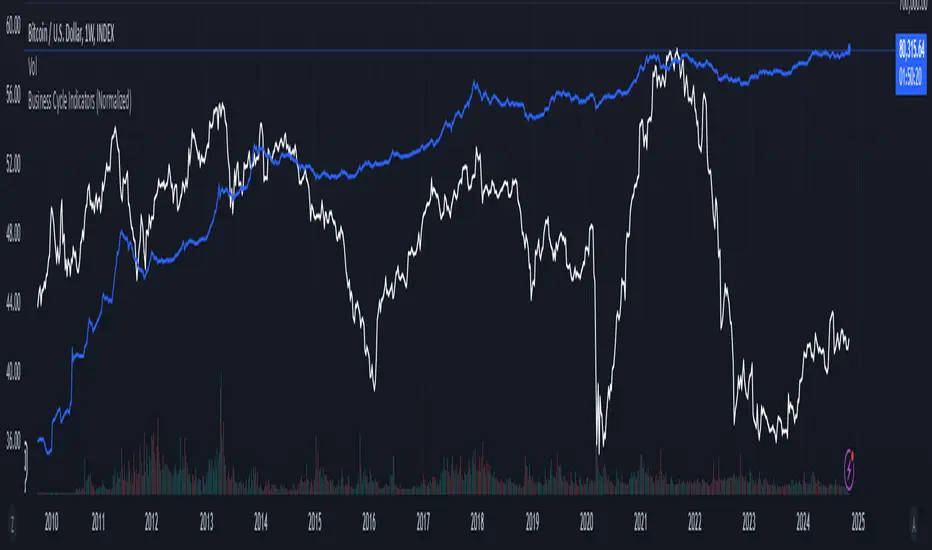
Business Cycle Indicators (Normalized)This script aggregates and normalizes several key economic indicators to provide a comprehensive view of the business cycle and overall market conditions. By combining these indicators into a single, normalized average line, the script helps identify overarching trends and shifts in the economy, aiding in more informed trading and investment decisions.
Included Indicators:
Inverted National Financial Conditions Index (NFCI):
Symbol: FRED:NFCI
Measures financial stress in the markets. An inverted NFCI aligns higher values with positive financial conditions.
Inverted Net Percentage of Banks Tightening Lending Standards (DRTSCIS):
Symbol: FRED:DRTSCIS
Reflects changes in bank lending practices. Inverting this indicator means higher values indicate easing lending standards, which is generally positive for economic growth.
HYG Close Price (iShares High Yield Corporate Bond ETF):
Symbol: AMEX:HYG
Represents the performance of high-yield corporate bonds, providing insight into credit market conditions.
Inverted High-Yield Credit Spread (BAMLH0A0HYM2):
Symbol: FRED:BAMLH0A0HYM2
Measures the spread between high-yield bonds and risk-free securities. A narrower (inverted) spread indicates better market conditions.
Manufacturing/Non-Manufacturing New Orders Ratio:
Symbols: ECONOMICS:USMNO (Manufacturing), ECONOMICS:USNMNO (Non-Manufacturing)
Compares manufacturing to non-manufacturing new orders to gauge shifts in economic activity.
US PMI (Purchasing Managers' Index):
Symbol: ECONOMICS:USBCOI
An indicator of the economic health of the manufacturing sector.
10-Year Inflation Breakeven (T10YIE):
Symbol: FRED:T10YIE
Represents market expectations of inflation over the next ten years.
Inverted 10-Year Real Yield (DFII10):
Symbol: FRED:DFII10
Reflects the real yield on 10-year Treasury Inflation-Protected Securities (TIPS). Inverted to align higher values with positive economic sentiment.
Copper/Gold Ratio:
Symbols: CAPITALCOM:COPPER (Copper), TVC:GOLD (Gold)
Compares the prices of copper and gold, often used as a barometer for global economic activity.
Features:
Normalized Indicators: Each indicator is normalized to a 0-100 scale to facilitate direct comparison, regardless of their original units or scales.
Normalized Average Line: Calculates and plots the average of all available normalized indicators, providing a single line that represents the combined economic signals.
Customizable Display:
Show Individual Indicators: Option to display individual normalized indicators for detailed analysis.
Show Normalized Average Line: Option to display the normalized average line for a consolidated view.
Dynamic Labeling: Displays the latest value of the normalized average directly on the chart for quick reference.
How to Use:
Adding the Script:
Apply the script to a chart in TradingView using a timeframe that aligns with the frequency of the economic data (daily or weekly recommended).
Customization:
Show Normalized Average Line: Enabled by default to display the combined indicator.
Show Individual Indicators: Enable this option in the script settings to display all individual normalized indicators.
Interpretation:
Normalized Scale (0-100): Higher values generally indicate stronger economic conditions, while lower values may suggest weakening conditions.
Trend Analysis: Use the normalized average line to identify trends and potential turning points in the business cycle.
Notes:
Data Availability: Ensure you have access to all the data sources used in the script. Some data feeds may require specific TradingView subscriptions.
Indicator Limitations: Economic indicators are subject to revisions and may not reflect real-time market conditions.
No Investment Advice: This script is a tool for analysis and should not be considered as financial advice. Always conduct your own research before making investment decisions.
Institutional Confluence Mapper [JOAT]Institutional Confluence Mapper (ICM)
Introduction
The Institutional Confluence Mapper is an open-source multi-factor analysis tool that combines five analytical modules into a unified confluence scoring system. It synthesizes institutional trading concepts including Relative Rotation analysis, Smart Money flow detection, Liquidity zone mapping, Session-based timing, and Volatility regime classification.
Rather than relying on a single indicator, ICM evaluates market conditions through multiple lenses simultaneously, presenting a clear confluence score (0-100%) that reflects the alignment of various market factors.
This script is fully open-source under the Mozilla Public License 2.0.
Originality and Purpose
This indicator is NOT a random mashup of existing indicators. It is an original implementation that creates a unified institutional analysis framework:
Why Multiple Modules? Most retail traders struggle because they rely on single indicators that provide conflicting signals. Institutional traders evaluate markets through multiple frameworks simultaneously. ICM bridges this gap by providing a unified view of complementary analysis methods.
The Confluence Scoring System: Each module contributes to a weighted confluence score (0-100%). Scores above 65% indicate bullish confluence; below 35% indicates bearish confluence.
How Components Work Together:
RRG (Relative Rotation) determines macro bias - is this asset outperforming or underperforming its benchmark?
Institutional Flow confirms smart money activity - are institutions accumulating or distributing?
Volatility Regime determines strategy selection - trend-follow or mean-revert?
Liquidity Detection identifies key levels - where are the stop hunts happening?
Session Analysis optimizes timing - when should you trade?
The Five Core Modules
1. Relative Rotation Momentum Matrix (RRG)
Compares the current symbol against a benchmark (default: SPY) using the JdK RS-Ratio methodology with double-smoothed EMA. Assets rotate through four quadrants:
LEADING: Outperforming with positive momentum (strongest bullish)
WEAKENING: Outperforming but losing momentum
LAGGING: Underperforming with negative momentum (strongest bearish)
IMPROVING: Underperforming but gaining momentum
2. Institutional Flow Analysis
Analyzes volume patterns to detect smart money activity:
Volume Z-Score measures how unusual current volume is
Buy/Sell pressure estimation based on candle structure
Unusual volume detection highlights institutional activity
3. Volatility Regime System
Uses ATR percentile ranking to classify market conditions:
COMPRESSION: Low volatility (ATR < 20th percentile) - potential breakout
EXPANSION: High volatility (ATR > 80th percentile) - trending
TRENDING_BULL/BEAR: Directional trends based on EMA alignment
RANGING: Sideways consolidation
4. Liquidity Detection
Identifies institutional liquidity targets using swing point analysis:
Swing highs/lows are tracked and displayed as dashed lines
Purple dashed lines mark resistance/sell-side liquidity
Teal dashed lines mark support/buy-side liquidity
Gold diamonds appear when liquidity sweeps are detected (potential reversals)
5. Session Momentum Profiler
Tracks trading sessions based on your selected timezone:
Asian Session: 7PM - 4AM EST
London Session: 3AM - 12PM EST
New York Session: 9:30AM - 4PM EST
London/NY Overlap: 8AM - 12PM EST (peak liquidity)
Visual Elements
Main Dashboard (Top-Right):
BIAS: Overall direction with confluence percentage
RRG: Current quadrant and momentum
FLOW: Smart money bias and volume status
REGIME: Market condition and volatility percentile
SESSION: Active trading session and current time
LIQUIDITY: Active zones and grab signals
SIGNAL: Actionable recommendation
Chart Elements:
Gold Diamond: Liquidity grab (potential reversal point)
Teal Dashed Line: Support / Buy-side liquidity zone
Purple Dashed Line: Resistance / Sell-side liquidity zone
EMA 21/55/200: Trend structure with cloud fill
Volatility Bands: ATR-based channels
How to Use
Step 1: Check the BIAS row for overall market direction
Step 2: Check REGIME to understand market conditions
Step 3: Identify key levels using liquidity zones and EMAs
Step 4: Wait for confluence above 65% (bullish) or below 35% (bearish)
Step 5: Look for gold diamond signals at key levels
Best Setups
Bullish: Confluence >65%, RRG in LEADING/IMPROVING, bullish flow, price near teal support zone.
Bearish: Confluence <35%, RRG in LAGGING/WEAKENING, bearish flow, price near purple resistance zone.
Reversal: Gold diamond appears after price sweeps a liquidity zone.
Key Input Parameters
Benchmark Symbol: Compare against (default: SPY)
RS-Ratio/Momentum Lookback: RRG calculation periods
Volume Analysis Period: Flow detection lookback
Swing Length: Liquidity zone detection
ATR Period/Rank Period: Regime classification
Timezone: Session detection timezone
Alerts
Liquidity Grab Bull: Bullish sweep detected
Liquidity Grab Bear: Bearish sweep detected
High Confluence Bull: Confluence above 70%
High Confluence Bear: Confluence below 30%
Best Practices
Use on 1H, 4H, or Daily timeframes for reliable signals
Combine with price action for confirmation
Respect the regime - don't fight strong trends
Trade during London/NY overlap for best liquidity
Wait for high confluence scores before entering
Always use proper risk management
Limitations
Works best on liquid markets with sufficient volume
Session features optimized for forex/crypto markets
RRG requires a valid benchmark symbol
No indicator predicts the future - use proper risk management
Disclaimer
This indicator is for educational and informational purposes only. It is not financial advice. Trading involves substantial risk of loss. Past performance does not guarantee future results.
-Made with passion by officialjackofalltrades

Strength of Divergence Across Multiple Indicators (+CMF&VWMACD)Modified Version of Strength of Divergence Across Multiple Indicators by reees
Purpose:
This Pine Script indicator is designed to identify and evaluate the strength of bullish and bearish divergences across multiple technical indicators. Divergences occur when the price of an asset is moving in one direction while a technical indicator is moving in the opposite direction, potentially signaling a trend reversal.
Key Features:
1. Multiple Indicator Support: The script now analyzes divergences for the following indicators:
* RSI (Relative Strength Index)
* OBV (On-Balance Volume)
* MACD (Moving Average Convergence/Divergence)
* STOCH (Stochastic Oscillator)
* CCI (Commodity Channel Index)
* MFI (Money Flow Index)
* AO (Awesome Oscillator)
* CMF (Chaikin Money Flow) - Newly added
* VWMACD (Volume-Weighted MACD) - Newly added
2. Customizable Divergence Parameters:
* Bullish/Bearish: Enable or disable the detection of bullish and bearish divergences independently.
* Regular/Hidden: Detect both regular and hidden divergences (hidden divergences can indicate trend continuation).
* Broken Trendline Exclusion: Optionally ignore divergences where the trendline connecting price pivots is broken by an intermediate pivot.
* Pivot Lookback Periods: Adjust the number of bars used to identify valid pivot highs and lows for divergence calculations.
* Weighting: Assign different weights to regular vs. hidden divergences and to the relative change in price vs. the indicator.
3. Indicator-Specific Settings:
* Weight: Each indicator can be assigned a weight, influencing its contribution to the overall divergence strength calculation.
* Extreme Value: Define a threshold above which an indicator's divergence is considered "extreme," giving it a higher strength rating.
4. Divergence Strength Calculation:
* For each indicator, the script calculates a divergence "degree" based on the magnitude of the divergence and the user-defined weightings.
* The total divergence strength is the sum of the individual indicator divergence degrees.
* Strength is categorized as "Extreme," "Very strong," "Strong," "Moderate," "Weak," or "Very weak."
5. Visualization:
* Divergence Lines: The script draws lines on the chart connecting the price and indicator pivots that form a divergence (optional, with customizable transparency).
* Labels: Labels display the total divergence strength and a breakdown of each indicator's contribution. The size and visibility of labels are based on the strength.
6. Alerts:
* The script can generate alerts when the total divergence strength exceeds a user-defined threshold.
New Indicators (CMF and VWMACD):
* Chaikin Money Flow (CMF):
* Purpose: Measures the buying and selling pressure by analyzing the relationship between price, volume, and the accumulation/distribution line.
* Divergence: A bullish CMF divergence occurs when the price makes a lower low, but the CMF makes a higher low (suggesting increasing buying pressure). A bearish divergence is the opposite.
* Volume-Weighted MACD (VWMACD):
* Purpose: Similar to the standard MACD but uses volume-weighted moving averages instead of simple moving averages, giving more weight to periods with higher volume.
* Divergence: Divergences are interpreted similarly to the standard MACD, but the VWMACD can be more sensitive to volume changes.
How It Works (Simplified):
1. Pivot Detection: The script identifies pivot highs and lows in both price and the selected indicators using the specified lookback periods.
2. Divergence Check: For each indicator:
* It checks if a series of pivots in price and the indicator are diverging (e.g., price makes a lower low, but the indicator makes a higher low for a bullish divergence).
* It calculates the divergence degree based on the difference in price and indicator values, weightings, and whether it's a regular or hidden divergence.
3. Strength Aggregation: The script sums up the divergence degrees of all enabled indicators to get the total divergence strength.
4. Visualization and Alerts: It draws lines and labels on the chart to visualize the divergences and generates alerts if the total strength exceeds the set threshold.
Benefits:
* Comprehensive Divergence Analysis: By considering multiple indicators, the script provides a more robust assessment of potential trend reversals.
* Customization: The many adjustable parameters allow traders to fine-tune the script to their specific trading style and preferences.
* Objective Strength Evaluation: The divergence strength calculation and categorization offer a more objective way to evaluate the significance of divergences.
* Early Warning System: Divergences can often precede significant price movements, making this script a valuable tool for anticipating potential trend changes.
* Volume Confirmation: The inclusion of CMF and VWMACD add volume-based confirmation to the divergence signals, potentially increasing their reliability.
Limitations:
* Lagging Indicators: Most of the indicators used are lagging, meaning they are based on past price data. Divergences may sometimes occur after a significant price move has already begun.
* False Signals: No indicator is perfect, and divergences can sometimes produce false signals, especially in choppy or ranging markets.
* Subjectivity: While the script aims for objectivity, some settings (like weightings and extreme values) still involve a degree of subjective judgment.

Intelle_city - World Cycle - Ath & Atl - Logarithmic - Strategy.Overview
Indicators: Strategy !
INTELLECT_city - World Cycle - ATH & ATL - Timeframe 1D and 1W - Logarithmic - Strategy - The Pi Cycle Top and Bottom Oscillator is an adaptation of the original Pi Cycle Top chart. It compares the 111-Day Moving Average circle and the 2 * 350-Day Moving Average circle of Bitcoin’s Price. These two moving averages were selected as 350 / 111 = 3.153; An approximation of the important mathematical number Pi.
When the 111-Day Moving Average circle reaches the 2 * 350-Day Moving Average circle, it indicates that the market is becoming overheated. That is because the mid time frame momentum reference of the 111-Day Moving Average has caught up with the long timeframe momentum reference of the 2 * 350-Day Moving Average.
Historically this has occurred within 3 days of the very top of each market cycle.
When the 111 Day Moving Average circle falls back beneath the 2 * 350 Day Moving Average circle, it indicates that the market momentum of that cycle is significantly cooling down. The oscillator drops down into the lower green band shown where the 111 Day Moving Average is moving at a 75% discount relative to the 2 * 350 Day Moving Average.
Historically, this has highlighted broad areas of bear market lows.
IMPORTANT: You need to set a LOGARITHMIC graph. (The function is located at the bottom right of the screen)
IMPORTANT: The INTELLECT_city indicator is made for a buy-sell strategy; there is also a signal indicator from INTELLECT_city
IMPORTANT: The Chart shows all cycles, both buying and selling.
IMPORTANT: Suitable timeframes are 1 daily (recommended) and 1 weekly
-----------------------------
Описание на русском:
-----------------------------
Обзор индикатора
INTELLECT_city - World Cycle - ATH & ATL - Timeframe 1D and 1W - Logarithmic - Strategy - Логарифмический - Сигнал - Осциллятор вершины и основания цикла Пи представляет собой адаптацию оригинального графика вершины цикла Пи. Он сравнивает круг 111-дневной скользящей средней и круг 2 * 350-дневной скользящей средней цены Биткойна. Эти две скользящие средние были выбраны как 350/111 = 3,153; Приближение важного математического числа Пи.
Когда круг 111-дневной скользящей средней достигает круга 2 * 350-дневной скользящей средней, это указывает на то, что рынок перегревается. Это происходит потому, что опорный моментум среднего временного интервала 111-дневной скользящей средней догнал опорный момент импульса длинного таймфрейма 2 * 350-дневной скользящей средней.
Исторически это происходило в течение трех дней после вершины каждого рыночного цикла.
Когда круг 111-дневной скользящей средней опускается ниже круга 2 * 350-дневной скользящей средней, это указывает на то, что рыночный импульс этого цикла значительно снижается. Осциллятор опускается в нижнюю зеленую полосу, показанную там, где 111-дневная скользящая средняя движется со скидкой 75% относительно 2 * 350-дневной скользящей средней.
Исторически это высветило широкие области минимумов медвежьего рынка.
ВАЖНО: Выставлять нужно ЛОГАРИФМИЧЕСКИЙ график. (Находиться функция с правой нижней части экрана)
ВАЖНО: Индикатор INTELLECT_city сделан для стратегии покупок продаж, есть также и сигнальный от INTELLECT_сity
ВАЖНО: На Графике видны все циклы, как на покупку так и на продажу.
ВАЖНО: Подходящие таймфреймы 1 дневной (рекомендовано) и 1 недельный
-----------------------------
Beschreibung - Deutsch
-----------------------------
Indikatorübersicht
INTELLECT_city – Weltzyklus – ATH & ATL – Zeitrahmen 1T und 1W – Logarithmisch – Strategy – Der Pi-Zyklus-Top- und Bottom-Oszillator ist eine Anpassung des ursprünglichen Pi-Zyklus-Top-Diagramms. Er vergleicht den 111-Tage-Gleitenden-Durchschnittskreis und den 2 * 350-Tage-Gleitenden-Durchschnittskreis des Bitcoin-Preises. Diese beiden gleitenden Durchschnitte wurden als 350 / 111 = 3,153 ausgewählt; eine Annäherung an die wichtige mathematische Zahl Pi.
Wenn der 111-Tage-Gleitenden-Durchschnittskreis den 2 * 350-Tage-Gleitenden-Durchschnittskreis erreicht, deutet dies darauf hin, dass der Markt überhitzt. Das liegt daran, dass der Momentum-Referenzwert des 111-Tage-Gleitenden-Durchschnitts im mittleren Zeitrahmen den Momentum-Referenzwert des 2 * 350-Tage-Gleitenden-Durchschnitts im langen Zeitrahmen eingeholt hat.
Historisch gesehen geschah dies innerhalb von 3 Tagen nach dem Höhepunkt jedes Marktzyklus.
Wenn der Kreis des 111-Tage-Durchschnitts wieder unter den Kreis des 2 x 350-Tage-Durchschnitts fällt, deutet dies darauf hin, dass die Marktdynamik dieses Zyklus deutlich nachlässt. Der Oszillator fällt in das untere grüne Band, in dem der 111-Tage-Durchschnitt mit einem Abschlag von 75 % gegenüber dem 2 x 350-Tage-Durchschnitt verläuft.
Historisch hat dies breite Bereiche mit Tiefstständen in der Baisse hervorgehoben.
WICHTIG: Sie müssen ein logarithmisches Diagramm festlegen. (Die Funktion befindet sich unten rechts auf dem Bildschirm)
WICHTIG: Der INTELLECT_city-Indikator ist für eine Kauf-Verkaufs-Strategie konzipiert; es gibt auch einen Signalindikator von INTELLECT_city
WICHTIG: Das Diagramm zeigt alle Zyklen, sowohl Kauf- als auch Verkaufszyklen.
WICHTIG: Geeignete Zeitrahmen sind 1 täglich (empfohlen) und 1 wöchentlich

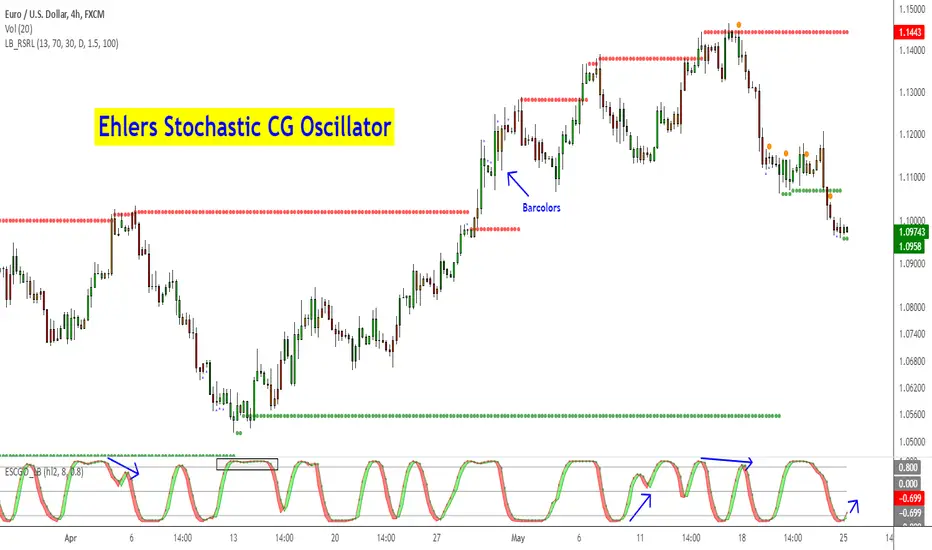
Ehlers Stochastic CG Oscillator [LazyBear]Another one from Ehlers.
Ehlers likes the idea behind StochRSI so much, he dedicated a full chapter in his book (linked below) on how stoch works with his "superlative" (his words, not mine) indicators. This is stoch of his CG oscillator.
Standard stochastic oscillator uses fixed period for calculations and does not adjust to the constantly changing market cycle length. Stochastic CG Oscillator does not have such a drawback.
Use this like normal stochRSI osc (Uncheck "Fill Osc/Trigger" option, sample chart below)
More info:
- CG oscillator:
- Cybernetic Analysis for Stocks and Futures (Ehlers)
List of my public indicators: bit.ly
List of my app-store indicators: blog.tradingview.com
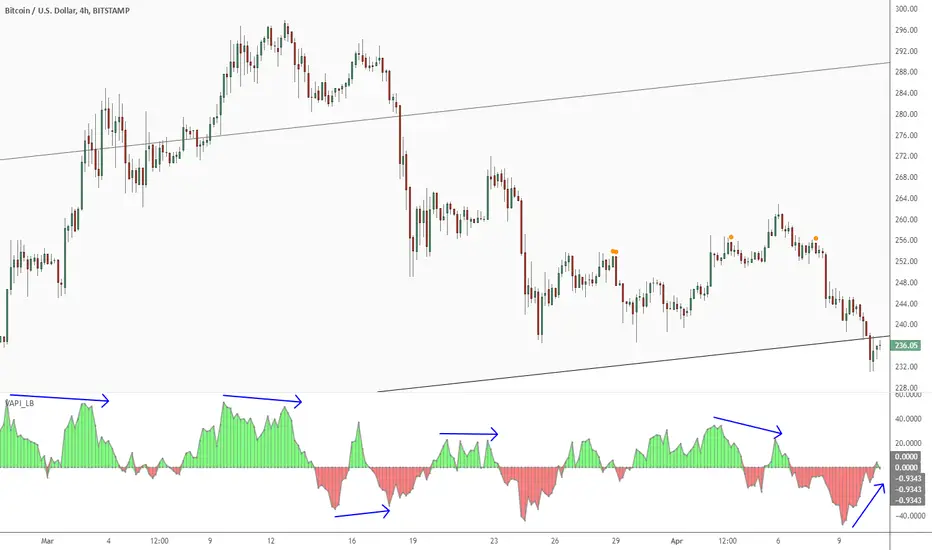
Volume Accumulation Percentage Indicator [LazyBear]Volume Accumulation Percentage Indicator (VAPI) is a variation of the classic volume-accumulation indicators. It uses volume the same way as OBV except that it assigns volume weights based on intraday volatility.
In a positive trend, if the stock price is close to a (local) new high, the VAPI should be at its maximum as well (and vice versa for a negative trend). If the market is looking for a direction, if the price is in the bottom side of his current trading range and if, at the same moment the VAPI osc slopes up, there is accumulation on the stock and that the prices should start to climb. The SELL signal is given when the VAPI decreases (distribution). Divergences are usually very effective too.
Tuning the "length" parameter may be needed for your instrument (default is 10), do let me know if you find a different value to be optimal for majority of instruments.
List of my public indicators: bit.ly
List of my app-store indicators: blog.tradingview.com
Divergence for Many Indicators v4Hello Traders,
Here is my new year gift for the community, Digergence for Many Indicators v4 . I tried to make it modular and readable as much as I can. Thanks to Pine Team for improving Pine Platform all the time!
How it works?
- On each candle it checks divergences between current and any of last 16 Pivot Points for the indicators.
- it search divergence on choisen indicators => RSI , MACD , MACD Histogram, Stochastic , CCI , Momentum, OBV, VWMACD, CMF and any External Indicator !
- it checks following divergences for 16 pivot points that is in last 100 bars for each Indicator.
--> Regular Positive Digergences
--> Regular Negative Digergences
--> Hidden Positive Digergences
--> Hidden Negative Digergences
- for positive divergences first it checks if closing price is higher than last closing price and indicator value is higher than perious value, then start searching divergence
- for negative divergences first it checks if closing price is lower than last closing price and indicator value is lower than perious value, then start searching divergence
Some Options:
Pivot Period: you set Pivot Period as you wish. you can see Pivot Points using "Show Pivot Points" option
Source for Pivot Points: you can use Close or High/Low as source
Divergence Type: you can choose Divergence type to be shown => "Regular", "Hidden", "Regular/Hidden"
Show Indicator Names: you have different options to show indicator names => "Full", "First Letter", "Don't Show"
Show Divergence Number: option to see number of indicators which has Divergence
Show Only Last Divergence : if you enable this option then it shows only last Positive and Negative Divergences
you can include any External Indicator to see if there is divergence
- enable "Check External Indicator"
- and then choose External indicator name in the list, "External Indicator"
- External indicator name is shown as Extrn
- related external indicator must be added before enabling this option
Coloring, line width and line style options for different type of divergences.
Following Alerts added:
- Positive Regular Divergence Detected
- Negative Regular Divergence Detected
- Positive Hidden Divergence Detected
- Negative Hidden Divergence Detected
Now lets see some examples:
Hidden Divergences:
Regular and Hidden Divergences together:
Showing first letters of indicators:
You can see only the number of indicators which has divergence:
You can see only divergence lines without indicators names and numbers:
option to used different label/line/text colors:
You have option to see only last divergences:
You can change Pivot Period, in following example Pivot Period = 15:
You can use Close or High/Low as Source for Divergence
You can include external indicators and get divergences on it:
Wish you all a happy new year!
Enjoy!

Multiple Indicators Screener v2After taking the approval of Mr. QuantNomad
Multiple Indicators Screener by QuantNomad
New lists have been modified and added
Built-in indicators:
RSI (Relative Strength Index): Provides trading opportunities based on overbought or oversold market conditions.
MFI (Cash Flow Index): Measures the flow of cash into or from assets, which helps in identifying buying and selling areas.
Williams Percent Range (WPR): Measures how high or low the price has been in the last time period, giving signals of periods of saturation.
Supertrend: Used to determine market direction and potential entry and exit locations.
Volume Change Percentage: Provides an analysis of the volume change percentage, which helps in identifying demand and supply changes for assets.
How to use:
Users can choose which symbols they want to monitor and analyze using a variety of built-in indicators.
The indicator provides visual signals that help traders identify potential trading opportunities based on the selected settings.
RSI in purple = buy weak liquidity (safe entry).
MFI in yellow = Liquidity
WPR in blue = RSI, MFI and WPR in oversold areas for all.
Allows users to customize the display locations and appearance of the cursor to their personal preferences.
Disclaimer
Please remember that past performance may not be indicative of future results.
Due to various factors, including changing market conditions, the strategy may no longer perform as well as in historical backtesting.
This post and the script don’t provide any financial advice.
=========================================================================
فاحص لمؤشرات متعددة مع مخرجات جدول شاملة لتسهيل مراقبة الكثير من العملات تصل الى 99 في وقت واحد
بختصر الشرح
ظهور اللون البنفسجي يعني كمية الشراء ضعف السيولة .
ظهور اللون الازرق جميع المؤشرات وصلة الى مرحلة التشبع البيعي ( دخول آمن )
ظهور اللون الاصفر يعني السيولة ضعفين الشراء ( عكس اتجاه قريب ) == ركزو على هاللون خصوصا مع عملات الخفيفة

3 more indicators: Inverse Fisher on RSI/MFI and CyberCycleSuggested by John Ehlers, IFT helps you to determine the exact oversold/overbought points in any oscillator-type indicators.
The 3 IFT based indicators in this chart are:
- Inverse Fisher on RSI (IFTRSI)
- Inverse Fisher on MFI (IFTMFI)
- Inverse Fisher on CyberCycle (IFTCC)
Suggested method to use any IFT indicator is to buy when the indicator crosses over –0.5 or crosses over +0.5 if it has not previously crossed over –0.5 and to sell short when the indicators crosses under +0.5 or crosses under –0.5 if it has not previously crossed under +0.5.
More info: www.mesasoftware.com
You can use these indicators by doing "Make it mine" (Click on "Share" to open the dialog box with this button).
Let me know what you think, would love to hear how these indicators are used and how effective these are for other instruments.

Stock ETF Tracker 2.0The Stock Sector ETF tracker with Indicators is a versatile tool designed to track the performance of sector-specific ETFs relative to the current asset. It automatically identifies the sector of the underlying symbol and displays the corresponding ETF’s price action alongside key technical indicators. This helps traders analyze sector trends and correlations in real time.
---
Key Features
Automatic Sector Detection:
Fetches the sector of the current asset (e.g., "Technology" for AAPL).
Maps the sector to a user-defined ETF (default: SPDR sector ETFs) .
Technical Indicators:
Simple Moving Average (SMA): Tracks the ETF’s trend.
Bollinger Bands: Highlights volatility and potential reversals.
Donchian High (52-Week High): Identifies long-term resistance levels.
SPY Regime Filter: Red background color if SP500 is below 200 day SMA.
Customizable Inputs:
Adjust indicator parameters (length, visibility).
Override default ETFs for specific sectors.
Informative Table:
Displays the current sector and ETF symbol in the bottom-right corner.
---
Input Settings
SMA Settings
SMA Length: Period for calculating the Simple Moving Average (default: 200).
Show SMA: Toggle visibility of the SMA line.
Bollinger Bands Settings
BB Length: Period for Bollinger Bands calculation (default: 20).
BB Multiplier: Standard deviation multiplier (default: 2.0).
Show Bollinger Bands: Toggle visibility of the bands.
Donchian High (52-Week High)
Daily High Length: Days used to calculate the high (default: 252, approx. 1 year).
Show High: Toggle visibility of the 52-week high line.
Sector Selections
Customize ETFs for each sector (e.g., replace XLU with another utilities ETF).
---
Example Use Cases
Trend Analysis: Compare a stock’s price action to its sector ETF’s SMA for trend confirmation.
Volatility Signals: Use Bollinger Bands to spot ETF price squeezes or breakouts.
Sector Strength: Monitor if the ETF is approaching its 52-week high to gauge sector momentum.
Enjoy tracking sector trends with ease! 🚀

Stock Sector ETF with IndicatorsThe Stock Sector ETF with Indicators is a versatile tool designed to track the performance of sector-specific ETFs relative to the current asset. It automatically identifies the sector of the underlying symbol and displays the corresponding ETF’s price action alongside key technical indicators. This helps traders analyze sector trends and correlations in real time.
---
Key Features
Automatic Sector Detection:
Fetches the sector of the current asset (e.g., "Technology" for AAPL).
Maps the sector to a user-defined ETF (default: SPDR sector ETFs) .
Technical Indicators:
Simple Moving Average (SMA): Tracks the ETF’s trend.
Bollinger Bands: Highlights volatility and potential reversals.
Donchian High (52-Week High): Identifies long-term resistance levels.
Customizable Inputs:
Adjust indicator parameters (length, visibility).
Override default ETFs for specific sectors.
Informative Table:
Displays the current sector and ETF symbol in the bottom-right corner.
---
Input Settings
SMA Settings
SMA Length: Period for calculating the Simple Moving Average (default: 200).
Show SMA: Toggle visibility of the SMA line.
Bollinger Bands Settings
BB Length: Period for Bollinger Bands calculation (default: 20).
BB Multiplier: Standard deviation multiplier (default: 2.0).
Show Bollinger Bands: Toggle visibility of the bands.
Donchian High (52-Week High)
Daily High Length: Days used to calculate the high (default: 252, approx. 1 year).
Show High: Toggle visibility of the 52-week high line.
Sector Selections
Customize ETFs for each sector (e.g., replace XLU with another utilities ETF).
---
Example Use Cases
Trend Analysis: Compare a stock’s price action to its sector ETF’s SMA for trend confirmation.
Volatility Signals: Use Bollinger Bands to spot ETF price squeezes or breakouts.
Sector Strength: Monitor if the ETF is approaching its 52-week high to gauge sector momentum.
Enjoy tracking sector trends with ease! 🚀

Koby's 3 trend indicators AIOAll in one my indicators.
Includes 3 indicators: "KobaMA'ndicator", "MAT_K" and "KFBB".

Linear Momentum and Performance IndicatorsThis a porting to Trading View of the 12 new indicators introduced in IFTA Journal (January Edition) by Akram El Sherbini, MFTA, CFTe, CETA.
Indicators are available in "Linear Momentum and Performance Indicators" at page four.
IFTA Journal is available below:
ifta.org
Indicators implemented herein:
Linear Force Index: The linear force index LFI measures the force of buyers and sellers during rallies and declines, respectively. It combines two important pieces of market information—the price acceleration
and volumes.
Pressure Index: The pressure index PRI measures the buying and selling pressure over a certain range within a time interval by moving around its zero line. The index indicates a rise in buying pressure when it crosses above the zero line and a rise in selling pressure
when it crosses below the zero line level. The buying and selling force moves the last price during the session to form a range with low and high boundaries.
Strength Index Index: The strength index SI is a leading indicator to the pressure index. It measures the ability of buyers to resist sellers and vice versa. SI of today is the ratio of the latest pressure index value to the strain of today.
Power Index: It measures the buying and selling power within a time interval by moving around its zero line.
Intensity Index: The intensity index II measures the buying and selling intensity within a time interval by moving around its zero line.
Dynamic Strength Index: The sole purpose of the dynamic strength index DSI and the integral dynamic strength index IDSI is to lead their intensity indicator peers.
Integral Force Index
Integral Pressure Index
Integral Strength Index
Integral Power Index
Integral Intensity Index
Integral Dynamic Strength Index
The following example shows a trade following the signal while several indicators are crossing the zero line:
Integral performance indicators have a fewer number of trades than the performance indicators. This result is normal, as the integral indicators are less sensitive than their peers. Moreover, the power, intensity, and dynamic strength are less sensitive than the force, pressure, and strength indicators. The same applies for their integrals. Therefore, the integrals of power, intensity, and dynamic strength indicators are more inclined to be medium-term indicators.
As the paper is suggesting "the linear momentum and the new performance indicators should make a significant change in categorizing several indicators in technical analysis."
Technical indicators are using biased mathematical implementations. For example Momentum Index is in reality a velocity indicator, Force index a Momentum indicator and so on. From a Physical perspective correct momentum, force, velocity etc. needs to be corrected and re-categorized.
The author also gives important insights in how these indicators can be used "simultaneously to identify price turning points and filter irrelevant divergences."
"This paper will attempt to adjust the price momentum and force concepts introduced by Welles Wilder and Alexander Elder, respectively. By introducing the concept of linear momentum, new indicators will emerge to dissect the market performance into six main elements: market’s force, pressure, strength, power, intensity, and dynamic strength. This will lead to a deeper insight about market action. The leading performance indicators can be used simultaneously to identify price turning points and filter irrelevant divergences. The linear momentum and the new performance indicators should make a significant change in categorizing several indicators in technical analysis."
Suggestions and feedbacks are welcome
Hope you enjoy this,
CryptoStatistical

Price Volume Rank [LazyBear]Price-Volume Rank, designed by Anthony J. Macek, compares the direction of the change in price (up or down) to the direction of the change in volume and assigns a number to that specific relationship. By quantifying price/volume interaction, P-V rank seeks to determine our position within a typical market cycle.
The various modes shown on the chart above or explained below. Also, read on for a little trick using the new Pine feature that you can use in your script.
How to read the PVR?
-------------------
The most desirable market condition occurs when both price and volume are moving up, that phenomenon is assigned a PVR of 1.
The next most desirable condition, when prices are still moving up but volume is diminishing, is given a PVR of 2. Although still technically healthy, this relationship between price and volume issues a warning that market momentum is weakening.
The worst-case scenario, seen when selling pressure is greatest with prices dropping and volume
increasing, is given PVR's weakest designation, 4.
Finally, even though prices are still moving down, volume begins to diminish as selling pressure abates. This price/volume relationship is assigned a PVR of 3, often alerting us to a potential buying opportunity ahead.
What do the modes mean?
----------------------
1) Histogram Mode: This plots PVR along with helpful ranges. Be careful when PVR is trending at turn-around points.
2) MA Crossover Mode: This plots a slow/fast MA of PVR. Default is 5/10 SMA. Buy is signalled when slow MA falls below fast MA. Sell is signalled when slow MA crosses up fast MA. There is a warning line at 2.5 that can be used for more confirmation.
3) Double Smoothed Crossover Mode: Same as MA crossover, but PVR is smoothed more. Warning line (2.5 level) is very useful in this mode. Use slow MA as the signal and fast MA of PVR for tracking the market.
Misc notes:
-----------
This won't work for Forex and other instruments for which TradingView doesn't expose volume. Thanks to the new Text rendering feature of PlotShape(), I can actually let users know of that :) Good use-case, eh? I will post a sample chart below in the comments.
Feel free to use any part of this code in your indicators.
More info:
--------
Stocks & Commodities V. 12:6 (235-239): Price-Volume Rank by Anthony J. Macek
Complete list of my indicators:
-----------------------------
docs.google.com

Indicator: Intrady Momentum IndexThe Intraday Momentum Index (IMI), developed by Tushar Chande, is a cross-breed between RSI and candlestick analysis. IMI determines the candle type that dominated the recent price action, using that to pinpoint the extremes in intraday momentum.
As the market tries to bottom after a sell off, there are gradually more candles with green bodies, even though prices remain in a narrow range. IMI can be used to detect this shift, because its values will increase towards 70. Similarly, as the market begins to top, there will be more red candles, causing IMI to decline towards 20. When the market is in trading range, IMI values will be in the neutral range of 40 to 60.
Usually intraday momentum leads interday momentum. QStick can show interday momentum, it complements IMI. You will find it in my published indicators.
I have added volatility bands based OB/OS, in addition to static OB/OS levels. You can also turn on IMI Ehlers smoothing. BTW, all parameters are configurable, so do check out the options page.
List of my other indicators:
-
- Google doc: docs.google.com

Strength of Divergence Across Multiple IndicatorsOverview:
One-stop shop for all your divergence needs, including:
(1) A single metric for divergence strength across multiple indicators.
(2) Labels that make it easy to spot where the truly strong divergence is by showing the overall divergence strength value along with the number of divergent indicators. Hovering over the label shows a breakdown of each divergent indicator and its individual divergence strength value.
(3) Fully customizable, including inputs for pivot lengths, divergence types, and weights for every component of the divergence strength calculation. This allows you to quickly and easily optimize the output for any chart. Don't worry, the default settings will have you covered if you're not interested in what's going on under the hood.
The Divergence Strength Calculation:
The total divergence strength value is the sum of the divergence strengths of all indicators for which divergence was detected at a given bar. Each indicator's individual divergence strength is comprised of two basic components: (1) |ΔPrice| - the magnitude of the change in price over the divergence period (pivot-to-pivot), and (2) |ΔIndicator| - the magnitude of the change in indicator value over the divergence period.
Because different indicators' scales and volatility can vary greatly, the Δ values are expressed in terms of standard deviation to ensure that the values are meaningful and equitable across all indicators and assets/instruments/currency pairs, etc:
|ΔIndicator| = |indicator_value_1 - indicator_value_2| / 2 * StDev(indicator_series,100)
Calculation Weights:
All components of the calculation are weighted and can be modified on the Inputs page in settings (weights are simply multipliers). For example, if you think hidden divergence should carry less weight than regular divergence, you can assign it a lesser weight. Or if you think RSI divergence is worth more than OBV divergence, you can adjust their weights accordingly. List of weights:
Regular divergence weight - default = 1
Hidden divergence weight - default = 1
ΔPrice weight - default = 0.5 (multiplied by the ΔPrice component)
ΔIndicator weight - default = 1.5 (multiplied by the ΔIndicator component)
RSI weight - default = 1.1
OBV weight - default = 0.8
MACD weight - default = 0.9
STOCH weight - default = 0.9
Development for additional indicators is ongoing, as is research into the optimal weight configuration(s).
Other Inputs:
Pivot lengths - specify the number of bars before and after each pivot high/low to consider it a valid candidate for divergence.
Lookback bars and Lookback pivots - specify the number of bars or the number of pivots to look back across.
Price sources - specify separate price sources for bullish and bearish divergence
Display settings - specify how lines and labels should display, including which divergence strength values should show the largest labels. Include/exclude specific divergence types and indicators.
Please report any bugs, or let me know if you have any enhancement suggestions or requests for additional indicators.
@reees

Crypto Indicators #u9tusA set of low timeframe (LTF), medium timeframe (MTF), and high timeframe (HTF) indicators for use in crypto currencies / bitcoin.
Traditionally the 10, 20, 50, 100, and 200 SMAs are used in TA. With cryptos, I've found that the 8 EMA, 21, 55, and 128 SMAs backtest better, while no change in length was necessary for the 200. I wanted to combine all these into one indicator to easily add them to a chart layout, hence this script.
You can customize the length of each MA to your liking in the settings, or accept the defaults.
LTF Indicators:
8 EMA in blue hues, medium line stroke.
MTF Indicators:
21, 55 SMA in purple hues, medium line stroke.
HTF Indicators:
128, 200 SMA in yellow hues, thick line stroke.
Defaults are for daily timeframes and lower; suggest changing up the intervals for weekly and monthly to:
21 -> 30
55 -> 50
128 -> 100
$BTC, $ETH, #ALTS
twitter.com
(c) @jhaurawachsman 20190515

Performance IndicatorsDescription:
The Performance Indicators tool provides traders with a comprehensive overview of both fundamental and technical performance metrics of a security. This dual approach helps traders make informed decisions by evaluating the security's intrinsic value as well as its market behavior.
Fundamental Performance Indicators:
EPS Year Over Year % Growth : Measures the percentage growth in earnings per share (EPS) compared to the same quarter in the previous year. This helps in understanding the company's profitability trends.
EPS 3 Quarters Year Over Year % Growth : Analyzes the percentage growth in EPS over the last three quarters compared to the same quarters in the previous year, providing insight into the company's recent earnings performance.
Sales Year Over Year % Growth : Tracks the percentage growth in sales compared to the same quarter in the previous year, offering a view of the company's revenue trends.
Sales 3 Quarters Year Over Year % Growth : Evaluates the percentage growth in sales over the last three quarters compared to the same quarters in the previous year, helping to assess the company's recent revenue performance.
Return On Equity (ROE) : Measures the company's profitability by comparing net income to shareholder equity. This indicates how effectively the company is using its equity base to generate profits.
Market Capitalization : Represents the total market value of the company's outstanding shares, providing a sense of the company's size and market presence.
Float Shares Outstanding : Refers to the number of shares available for trading by the public, excluding restricted shares. This metric helps in understanding the liquidity and volatility of the stock.
Technical Performance Indicators:
Average Daily Range (ADR) %: Calculates the average range between the high and low prices over a specific period, expressed as a percentage. This helps in understanding the stock's daily volatility.
Average True Range (ATR) $ : Measures market volatility by calculating the average range between the high and low prices, taking into account any gaps in the price. It is expressed in dollar terms.
% Off 52-Week High : Indicates how far the current price is from the highest price achieved over the last 52 weeks, helping to assess the stock's current performance relative to its yearly peak.
Relative Price Strength (RPS) : Compares the stock's price performance to a benchmark index, helping to identify how the stock is performing relative to the broader market.
How it Works:
The fundamental performance indicators provide insights into the company's financial health and growth trends by analyzing key metrics such as EPS, sales growth, ROE, market capitalization, and float shares outstanding.
The technical performance indicators offer a view of the stock's market behavior and volatility through metrics like ADR, ATR, % off 52-week high, and RPS.
By combining these fundamental and technical metrics, traders can gain a well-rounded perspective on the security's overall performance.
How to Use:
Add the Performance Indicators tool to your chart.
Evaluate the fundamental indicators to assess the company's financial health and growth trends.
Analyze the technical indicators to understand the stock's market behavior and volatility.
Use the combined insights from both fundamental and technical indicators to make informed trading decisions.
This tool is particularly useful for traders who want to integrate both fundamental analysis and technical analysis into their trading strategy, providing a holistic view of a security's performance.
Targets For Many Indicators [LuxAlgo]The Targets For Many Indicators is a useful utility tool able to display targets for many built-in indicators as well as external indicators. Targets can be set for specific user-set conditions between two series of values, with the script being able to display targets for two different user-set conditions.
Alerts are included for the occurrence of a new target as well as for reached targets.
🔶 USAGE
Targets can help users determine the price limit where the price might start deviating from an indication given by one or multiple indicators. In the context of trading, targets can help secure profits/reduce losses of a trade, as such this tool can be useful to evaluate/determine user take profits/stop losses.
Due to these essentially being horizontal levels, they can also serve as potential support/resistances, with breakouts potentially confirming new trends.
In the above example, we set targets 3 ATR's away from the closing price when the price crosses over the script built-in SuperTrend indicator using ATR period 10 and factor 3. Using "Long Position Target" allows setting a target above the price, disabling this setting will place targets below the price.
Users might be interested in obtaining new targets once one is reached, this can be done by enabling "New Target When Reached" in the target logic setting section, resulting in more frequent targets.
Lastly, users can restrict new target creation until current ones are reached. This can result in fewer and longer-term targets, with a higher reach rate.
🔹 Dashboard
A dashboard is displayed on the top right of the chart, displaying the amount, reach rate of targets 1/2, and total amount.
This dashboard can be useful to evaluate the selected target distances relative to the selected conditions, with a higher reach rate suggesting the distance of the targets from the price allows them to be reached.
🔶 DETAILS
🔹 Indicators
Besides 'External' sources, each source can be set at 1 of the following Build-In Indicators :
ACCDIST : Accumulation/distribution index
ATR : Average True Range
BB (Middle, Upper or Lower): Bollinger Bands
CCI : Commodity Channel Index
CMO : Chande Momentum Oscillator
COG : Center Of Gravity
DC (High, Mid or Low): Donchian Channels
DEMA : Double Exponential Moving Average
EMA : Exponentially weighted Moving Average
HMA : Hull Moving Average
III : Intraday Intensity Index
KC (Middle, Upper or Lower): Keltner Channels
LINREG : Linear regression curve
MACD (macd, signal or histogram): Moving Average Convergence/Divergence
MEDIAN : median of the series
MFI : Money Flow Index
MODE : the mode of the series
MOM : Momentum
NVI : Negative Volume Index
OBV : On Balance Volume
PVI : Positive Volume Index
PVT : Price-Volume Trend
RMA : Relative Moving Average
ROC : Rate Of Change
RSI : Relative Strength Index
SMA : Simple Moving Average
STOCH : Stochastic
Supertrend
TEMA : Triple EMA or Triple Exponential Moving Average
VWAP : Volume Weighted Average Price
VWMA : Volume-Weighted Moving Average
WAD : Williams Accumulation/Distribution
WMA : Weighted Moving Average
WVAD : Williams Variable Accumulation/Distribution
%R : Williams %R
Each indicator is provided with a link to the Reference Manual or to the Build-In Indicators page.
The latter contains more information about each indicator.
Note that when "Show Source Values" is enabled, only values that can be logically found around the price will be shown. For example, Supertrend , SMA , EMA , BB , ... will be made visible. Values like RSI , OBV , %R , ... will not be visible since they will deviate too much from the price.
🔹 Interaction with settings
This publication contains input fields, where you can enter the necessary inputs per indicator.
Some indicators need only 1 value, others 2 or 3.
When several input values are needed, you need to separate them with a comma.
You can use 0 to 4 spaces between without a problem. Even an extra comma doesn't give issues.
The red colored help text will guide you further along (Only when Target is enabled)
Some examples that work without issues:
Some examples that work with issues:
As mentioned, the errors won't be visible when the concerning target is disabled
🔶 SETTINGS
Show Target Labels: Display target labels on the chart.
Candle Coloring: Apply candle coloring based on the most recent active target.
Target 1 and Target 2 use the same settings below:
Enable Target: Display the targets on the chart.
Long Position Target: Display targets above the price a user selected condition is true. If disabled will display the targets below the price.
New Target Condition: Conditional operator used to compare "Source A" and "Source B", options include CrossOver, CrossUnder, Cross, and Equal.
🔹 Sources
Source A: Source A input series, can be an indicator or external source.
External: External source if 'External" is selected in "Source A".
Settings: Settings of the selected indicator in "Source A", entered settings of indicators requiring multiple ones must be comma separated, for example, "10, 3".
Source B: Source B input series, can be an indicator or external source.
External: External source if 'External" is selected in "Source B".
Settings: Settings of the selected indicator in "Source B", entered settings of indicators requiring multiple ones must be comma separated, for example, "10, 3".
Source B Value: User-defined numerical value if "value" is selected in "Source B".
Show Source Values: Display "Source A" and "Source B" on the chart.
🔹 Logic
Wait Until Reached: When enabled will not create a new target until an existing one is reached.
New Target When Reached: Will create a new target when an existing one is reached.
Evaluate Wicks: Will use high/low prices to determine if a target is reached. Unselecting this setting will use the closing price.
Target Distance From Price: Controls the distance of a target from the price. Can be determined in currencies/points, percentages, ATR multiples, ticks, or using multiple of external values.
External Distance Value: External distance value when "External Value" is selected in "Target Distance From Price".

Vortex Trend Matrix [JOAT]Vortex Trend Matrix - Multi-Factor Trend Confluence System
Introduction and Purpose
Vortex Trend Matrix is an open-source overlay indicator that combines Ichimoku-style equilibrium analysis with the Vortex Indicator to create a comprehensive trend confluence system. The core problem this indicator solves is that single trend indicators often give conflicting signals. Price might be above a moving average but momentum might be weakening.
This indicator addresses that by combining five different trend factors into a single composite score, making it easy to identify when multiple factors align for high-probability trend trades.
Why These Components Work Together
Each component measures trend from a different perspective:
1. Cloud Position - Price above/below the equilibrium cloud indicates overall trend bias. The cloud acts as dynamic support/resistance.
2. TK Relationship - Conversion line vs Base line (like Tenkan/Kijun in Ichimoku). Conversion above Base = bullish momentum.
3. Lagging Span - Current price compared to price N bars ago. Confirms whether current move has follow-through.
4. Vortex Indicator - VI+ vs VI- measures directional movement strength. Provides momentum confirmation.
5. Base Direction - Whether the base line is rising or falling. Indicates medium-term trend direction.
How the Trend Score Works
float trendScore = 0.0
// Cloud position (+2/-2)
trendScore += aboveCloud ? 2.0 : belowCloud ? -2.0 : 0.0
// TK relationship (+1/-1)
trendScore += conversionLine > baseLine ? 1.0 : conversionLine < baseLine ? -1.0 : 0.0
// Lagging span (+1/-1)
trendScore += laggingBull ? 1.0 : laggingBear ? -1.0 : 0.0
// Vortex (+1.5/-1.5)
trendScore += vortexBull ? 1.5 : vortexBear ? -1.5 : 0.0
// Base direction (+0.5/-0.5)
trendScore += baseDirection * 0.5
Score ranges from approximately -6 to +6:
- +4 or higher = STRONG BULL
- +2 to +4 = BULL
- -2 to +2 = NEUTRAL
- -4 to -2 = BEAR
- -4 or lower = STRONG BEAR
Signal Types
TK Cross Up/Down - Conversion line crosses Base line (momentum shift)
Base Direction Change - Base line changes direction (medium-term shift)
Strong Bull/Bear Trend - Score reaches +4/-4 (high confluence)
Dashboard Information
Trend - Overall status with composite score
Cloud - Price position (ABOVE/BELOW/INSIDE)
TK Cross - Conversion vs Base relationship
Lagging - Lagging span bias
Vortex - VI+/VI- relationship
VI+/VI- - Individual vortex values
How to Use This Indicator
For Trend Following:
1. Enter long when trend score reaches +4 or higher (STRONG BULL)
2. Enter short when trend score reaches -4 or lower (STRONG BEAR)
3. Use cloud as dynamic support/resistance for entries
For Momentum Timing:
1. Watch for TK Cross signals for entry timing
2. Base direction changes indicate medium-term shifts
3. Vortex confirmation adds conviction
For Risk Management:
1. Exit when trend score drops to neutral
2. Use cloud edges as stop-loss references
3. Reduce position when score weakens
Input Parameters
Conversion Period (9) - Fast equilibrium line
Base Period (26) - Slow equilibrium line
Lead Span Period (52) - Cloud projection period
Displacement (26) - Cloud and lagging span offset
Vortex Period (14) - Period for vortex calculation
VI+ Strength (1.10) - Threshold for strong bullish vortex
VI- Strength (0.90) - Threshold for strong bearish vortex
Timeframe Recommendations
4H-Daily: Best for equilibrium-based analysis
1H: Good for intraday trend following
Lower timeframes may require adjusted periods
Limitations
Equilibrium calculations have inherent lag
Cloud displacement means signals are delayed
Works best in trending markets
May whipsaw in ranging conditions
Open-Source and Disclaimer
This script is published as open-source under the Mozilla Public License 2.0 for educational purposes.
This indicator does not constitute financial advice. Trend analysis does not guarantee profitable trades. Always use proper risk management.
- Made with passion by officialjackofalltrades

Pulse Volume Commitment [JOAT]
Pulse Volume Commitment - Three-Dimensional Momentum Analysis
Introduction and Purpose
Pulse Volume Commitment is an open-source oscillator indicator that analyzes price action through three distinct dimensions: Quantity (candle count), Quality (body structure), and Commitment (volume-weighted quality). The core problem this indicator solves is that simple bullish/bearish candle counts miss important context. A market can have more green candles but still be weak if those candles have small bodies and low volume.
This indicator addresses that by requiring all three dimensions to align before generating strong signals, filtering out weak moves that lack conviction.
Why These Three Dimensions Work Together
Each dimension measures a different aspect of market conviction:
1. Quantity - Counts bullish vs bearish candles over the lookback period. Tells you WHO is winning the candle count battle.
2. Quality - Scores candles by body size relative to total range. Full-bodied candles (small wicks) indicate stronger conviction than doji-like candles. Tells you HOW decisively price is moving.
3. Commitment - Weights quality scores by volume. High-quality candles on high volume indicate institutional participation. Tells you WHETHER smart money is involved.
When all three align (e.g., more bullish candles + bullish quality + bullish commitment), the signal is significantly more reliable.
How the Calculations Work
Quantity Analysis:
int greenCount = 0
int redCount = 0
for i = 0 to lookbackPeriod - 1
if close > open
greenCount += 1
if close < open
redCount += 1
bool quantityBull = greenCount > redCount
Quality Analysis (body-to-range scoring):
for i = 0 to lookbackPeriod - 1
float candleBody = close - open // Signed (positive = bull)
float candleRange = high - low
float bodyQuality = candleRange > 0 ? (candleBody / candleRange * 100) * candleRange : 0.0
sumBodyQuality += bodyQuality
bool qualityBull = sumBodyQuality > 0
Signal Types
FULL BULL - All three dimensions bullish (Quantity + Quality + Commitment)
FULL BEAR - All three dimensions bearish
LEAN BULL/BEAR - 2 of 3 dimensions agree
MIXED - No clear consensus
STRONG BUY/SELL - Full confluence + ADX confirms trending market
ADX Integration
The indicator includes ADX (Average Directional Index) to filter signals:
- ADX >= 20 = TRENDING market (signals more reliable)
- ADX < 20 = RANGING market (signals may whipsaw)
Strong signals only trigger when full confluence occurs in a trending environment.
Dashboard Information
Quantity - BULL/BEAR/FLAT with green/red candle ratio
Quality - Directional bias based on body quality scoring
Commit - Volume-weighted commitment reading
ADX - Trend strength (TRENDING/RANGING)
Signal - Confluence status (FULL BULL/FULL BEAR/LEAN/MIXED)
Action - STRONG BUY/STRONG SELL/WAIT
How to Use This Indicator
For High-Conviction Entries:
1. Wait for FULL BULL or FULL BEAR confluence
2. Confirm ADX shows TRENDING
3. Enter when Action shows STRONG BUY or STRONG SELL
For Filtering Weak Setups:
1. Avoid entries when signal shows MIXED
2. Be cautious when ADX shows RANGING
3. Require at least 2 of 3 dimensions to agree
For Divergence Analysis:
1. Watch for Quantity bullish but Commitment bearish (distribution)
2. Watch for Quantity bearish but Commitment bullish (accumulation)
Input Parameters
Lookback Period (9) - Bars to analyze for all three dimensions
ADX Smoothing (14) - Period for ADX calculation
ADX DI Length (14) - Period for directional indicators
Timeframe Recommendations
15m-1H: Good for intraday momentum analysis
4H-Daily: Best for swing trading confluence
Lookback period may need adjustment for different timeframes
Limitations
Lookback period affects signal responsiveness vs reliability tradeoff
Volume data quality varies by exchange
ADX filter may cause missed entries in early trends
Works best on liquid instruments with consistent volume
Open-Source and Disclaimer
This script is published as open-source under the Mozilla Public License 2.0 for educational purposes.
This indicator does not constitute financial advice. Confluence signals do not guarantee profitable trades. Always use proper risk management.
- Made with passion by officialjackofalltrades
