[JRL] Murrey Math LinesMurrey Math Lines are support and resistance lines based on geometric mathematical formulas developed by T.
H. Murrey. MM lines are a derivation of the observations of W.D. Gann. Murrey's geometry facilitate the use of Gann's theories in a somewhat easier application. According to Gann's theory, price tends to trend and retrace in 1/8th intervals. The most important MM line levels are the 0/8, 4/8 and 8/8 levels, which typically provide strong support and resistance points. The 3/8 and 5/8 levels represent the low and high of the typical trading range. When price is above the typical trading range, it is considered overbought, and when it is below it is considered oversold. The 2/8 and 6/8 levels provide strong pivot points.
Some of the other Murrey Math indicators on TradingView use different formulas and therefore produce varying results. I've checked my indicator against MM indicators on other platforms and it is consistent with those indicators.
This indicator also allows users to switch to alternative timeframes for analysis and it includes labels for the MM lines. If you have any suggestions or comments, please leave them below.
Cheers!
Cerca negli script per "indicators"

Easy System 420In this strategy, 15 indicators are used, each giving its results as a numerical value, which then is added or subtracted from the total points, gathered from all 15 indicators.
Many thanks to RafaelZioni for his great work making the EasySys1 script which i modified to create this script.
Onchart is drawn some of the indicators, but not all, a info panel is drawn showing the value each indicator has calculated. The info panel can be turned on or off.
Many of the indicator settings can be changed by user, and this is recommended, to tune the strategy to users chosen pair/timeframe.
Therefore any pair or timeframe can be used, the strategy tester results showing possible results, remember to set commission to match your broker. example chart settings here have common crypto exchange commission value: 0.25%
indicator list : SAR + STT + ZigZag + ROC + DMI + CCI + Weis + SMA + AO + MOM + Hist + BB + Ichimoku + HMA

Profit Maximizer PMaxPMax is a brand new indicator developed by KivancOzbilgic in earlier 2020.
It's a combination of two trailing stop loss indicators;
One is Anıl Özekşi's MOST (Moving Stop Loss) Indicator
and the other one is well known ATR based SuperTrend.
Both MOST and SuperTrend Indicators are very good at trend following systems but conversely their performance is not bright in sideways market conditions like most of the other indicators.
Profit Maximizer - PMax tries to solve this problem. PMax combines the powerful sides of MOST (Moving Average Trend Changer) and SuperTrend (ATR price detection) in one indicator.
Backtest and optimization results of PMax are far better when compared to its ancestors MOST and SuperTrend. It reduces the number of false signals in sideways and give more reliable trade signals.
PMax is easy to determine the trend and can be used in any type of markets and instruments. It does not repaint.
The first parameter in the PMax indicator set by the three parameters is the period/length of ATR.
The second Parameter is the Multiplier of ATR which would be useful to set the value of distance from the built in Moving Average.
I personally think the most important parameter is the Moving Average Length and type.
PMax will be much sensitive to trend movements if Moving Average Length is smaller. And vice versa, will be less sensitive when it is longer.
As the period increases it will become less sensitive to little trends and price actions.
In this way, your choice of period, will be closely related to which of the sort of trends you are interested in.
We are under the effect of the uptrend in cases where the Moving Average is above PMax;
conversely under the influence of a downward trend, when the Moving Average is below PMax.
Built in Moving Average type defaultly set as EMA but users can choose from 8 different Moving Average types like:
SMA : Simple Moving Average
EMA : Exponential Movin Average
WMA : Weighted Moving Average
TMA : Triangular Moving Average
VAR : Variable Index Dynamic Moving Average aka VIDYA
WWMA : Welles Wilder's Moving Average
ZLEMA : Zero Lag Exponential Moving Average
TSF : True Strength Force
Tip: In sideways VAR would be a good choice
You can use PMax default alarms and Buy Sell signals like:
1-
BUY when Moving Average crosses above PMax
SELL when Moving Average crosses under PMax
2-
BUY when prices jumps over PMax line.
SELL when prices go under PMax line.

Combo Backtest 123 Reversal & Finite Volume Elements (FVE) This is combo strategies for get a cumulative signal.
First strategy
This System was created from the Book "How I Tripled My Money In The
Futures Market" by Ulf Jensen, Page 183. This is reverse type of strategies.
The strategy buys at market, if close price is higher than the previous close
during 2 days and the meaning of 9-days Stochastic Slow Oscillator is lower than 50.
The strategy sells at market, if close price is lower than the previous close price
during 2 days and the meaning of 9-days Stochastic Fast Oscillator is higher than 50.
Second strategy
The FVE is a pure volume indicator. Unlike most of the other indicators
(except OBV), price change doesn?t come into the equation for the FVE (price
is not multiplied by volume), but is only used to determine whether money is
flowing in or out of the stock. This is contrary to the current trend in the
design of modern money flow indicators. The author decided against a price-volume
indicator for the following reasons:
- A pure volume indicator has more power to contradict.
- The number of buyers or sellers (which is assessed by volume) will be the same,
regardless of the price fluctuation.
- Price-volume indicators tend to spike excessively at breakouts or breakdowns.
WARNING:
- For purpose educate only
- This script to change bars colors.

Combo Strategy 123 Reversal & Finite Volume Elements (FVE) This is combo strategies for get a cumulative signal.
First strategy
This System was created from the Book "How I Tripled My Money In The
Futures Market" by Ulf Jensen, Page 183. This is reverse type of strategies.
The strategy buys at market, if close price is higher than the previous close
during 2 days and the meaning of 9-days Stochastic Slow Oscillator is lower than 50.
The strategy sells at market, if close price is lower than the previous close price
during 2 days and the meaning of 9-days Stochastic Fast Oscillator is higher than 50.
Second strategy
The FVE is a pure volume indicator. Unlike most of the other indicators
(except OBV), price change doesn`t come into the equation for the FVE (price
is not multiplied by volume), but is only used to determine whether money is
flowing in or out of the stock. This is contrary to the current trend in the
design of modern money flow indicators. The author decided against a price-volume
indicator for the following reasons:
- A pure volume indicator has more power to contradict.
- The number of buyers or sellers (which is assessed by volume) will be the same,
regardless of the price fluctuation.
- Price-volume indicators tend to spike excessively at breakouts or breakdowns.
WARNING:
- For purpose educate only
- This script to change bars colors.

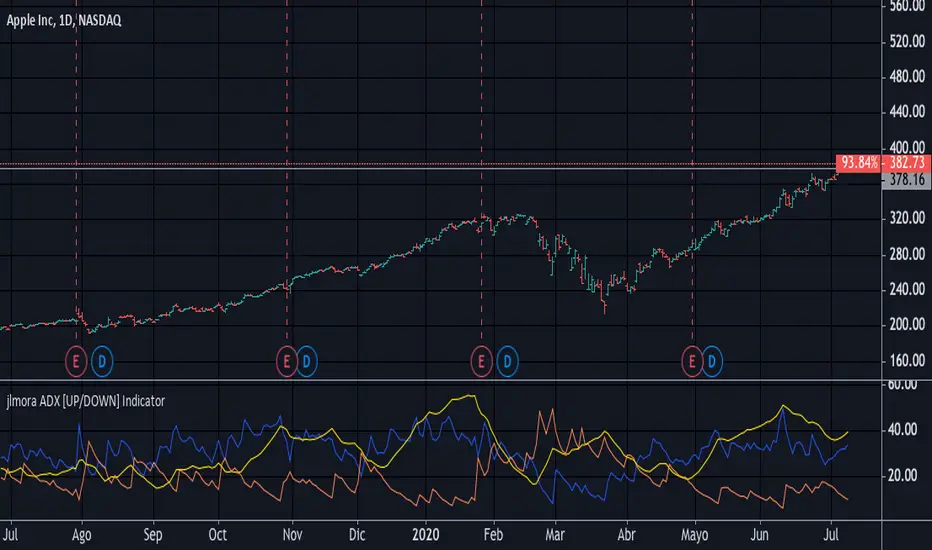
jlmora ADX IndicatorThe ADX also informs us of the prevailing market trend through the positive / negative movement indicators. Being able to determine the existence of a trend in the market and its strength is fundamental, since not all indicators or systems work correctly in different types of markets.
1. Operate only from long positions when the positive directional line is above the negative. Trade only from short positions when the negative directional line is above the positive. The best time to trade is when the ADX is on the rise, showing that the dominant group is strengthening.
2. When the ADX falls, it shows that the market is becoming less discretionary. There are likely to be a few unexpected turns. When the ADX points down, it is preferable not to use trend tracking methods.
3. When the ADX falls below both directional lines, this identifies a flat and sleepy market. Do not use a trend tracking system, but be prepared to trade as major trends emerge from such calm periods.
4. The best individual directional signal is given after the ADX falls below both directional lines. The longer it stays there, the stronger the base of the next move will be. When the ADX rebounds from below both directional lines, it shows that the market is waking up from a calm period. When the ADX grows four or more steps (for example, 9 to 13) from its lowest point below both directional lines, it is "ringing the bell" on a new trend. It shows that a new bull or bear market is emerging, depending on which directional line is above it. When the ADX rebounds above both directional lines, it is identifying an overheated market. When the ADX crosses both directional lines down, it shows that a major trend has entered. It is a good time to collect benefits in a directional operation. If you trade from long positions, you will definitely want to pick up partial gains. Market indicators give strong signals and weak signals. For example, when a moving average changes direction, it is a strong signal. A downward inflection of the ADX is a weak signal. Once you see that the ADX has been turned down, you should be very careful adding to open positions. You should start to collect profits, reduce positions and try to exit.
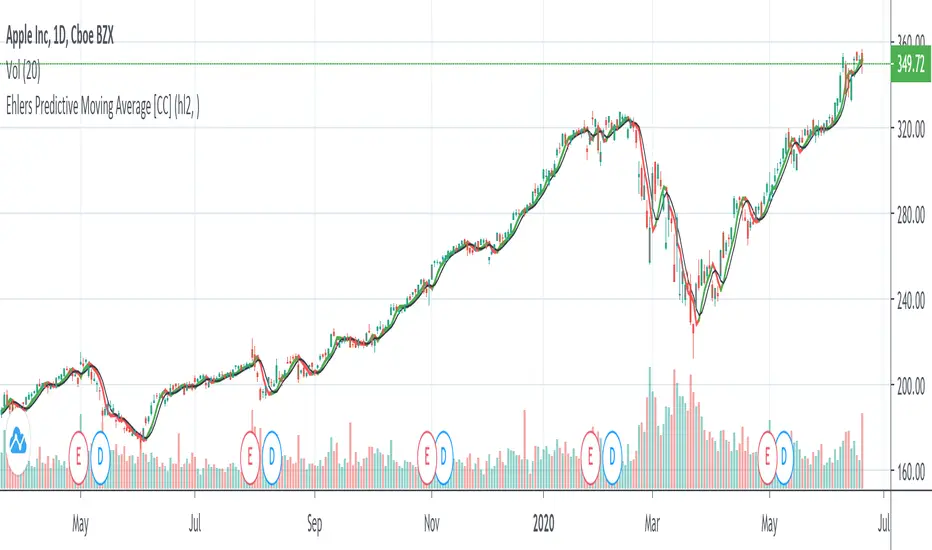
Ehlers Predictive Moving Average [CC]The Predictive Moving Average was created by John Ehlers (Rocket Science For Traders pg 212) and this is one of his first leading indicators. I have been asked by many people for more leading indicators so this one is for you all! Buy when the indicator line is green and sell when it is red.
Let me know if there are other indicators you would like to see me publish or if you want something custom done!
PowerX Strategy Bar Coloring [OFFICIAL VERSION]This script colors the bars according to the PowerX Strategy by Markus Heitkoetter:
The PowerX Strategy uses 3 indicators:
- RSI (7)
- Stochastics (14, 3, 3)
- MACD (12, 26 , 9)
The bars are colored GREEN if...
1.) The RSI (7) is above 50 AND
2.) The Stochastic (14, 3, 3) is above 50 AND
3.) The MACD (12, 26, 9) is above its Moving Average, i.e. MACD Histogram is positive.
The bars are colored RED if...
1.) The RSI (7) is below 50 AND
2.) The Stochastic (14, 3, 3) is below 50 AND
3.) The MACD (12, 26, 9) is below its Moving Average, i.e. MACD Histogram is negative.
If only 2 of these 3 conditions are met, then the bars are black (default color)
We highly recommend plotting the indicators mentioned above on your chart, too, so that you can see when bars are getting close to being "RED" or "GREEN", e.g. RSI is getting close to the 50 line.

Delta Volume Columns Pro [LucF]█ OVERVIEW
This indicator displays volume delta information calculated with intrabar inspection on historical bars, and feed updates when running in realtime. It is designed to run in a pane and can display either stacked buy/sell volume columns or a signal line which can be calculated and displayed in many different ways.
Five different models are offered to reveal different characteristics of the calculated volume delta information. Many options are offered to visualize the calculations, giving you much leeway in morphing the indicator's visuals to suit your needs. If you value delta volume information, I hope you will find the time required to master Delta Volume Columns Pro well worth the investment. I am confident that if you combine a proper understanding of the indicator's information with an intimate knowledge of the volume idiosyncrasies on the markets you trade, you can extract useful market intelligence using this tool.
█ WARNINGS
1. The indicator only works on markets where volume information is available,
Please validate that your symbol's feed carries volume information before asking me why the indicator doesn't plot values.
2. When you refresh your chart or re-execute the script on the chart, the indicator will repaint because elapsed realtime bars will then recalculate as historical bars.
3. Because the indicator uses different modes of calculation on historical and realtime bars, it's critical that you understand the differences between them. Details are provided further down.
4. Calculations using intrabar inspection on historical bars can only be done from some chart timeframes. See further down for a list of supported timeframes.
If the chart's timeframe is not supported, no historical volume delta will display.
█ CONCEPTS
Chart bars
Three different types of bars are used in charts:
1. Historical bars are bars that have already closed when the script executes on them.
2. The realtime bar is the current, incomplete bar where a script is running on an open market. There is only one active realtime bar on your chart at any given time.
The realtime bar is where alerts trigger.
3. Elapsed realtime bars are bars that were calculated when they were realtime bars but have since closed.
When a script re-executes on a chart because the browser tab is refreshed or some of its inputs are changed, elapsed realtime bars are recalculated as historical bars.
Why does this indicator use two modes of calculation?
Historical bars on TradingView charts contain OHLCV data only, which is insufficient to calculate volume delta on them with any level of precision. To mine more detailed information from those bars we look at intrabars , i.e., bars from a smaller timeframe (we call it the intrabar timeframe ) that are contained in one chart bar. If your chart Is running at 1D on a 24x7 market for example, most 1D chart bars will contain 24 underlying 1H bars in their dilation. On historical bars, this indicator looks at those intrabars to amass volume delta information. If the intrabar is up, its volume goes in the Buy bin, and inversely for the Sell bin. When price does not move on an intrabar, the polarity of the last known movement is used to determine in which bin its volume goes.
In realtime, we have access to price and volume change for each update of the chart. Because a 1D chart bar can be updated tens of thousands of times during the day, volume delta calculations on those updates is much more precise. This precision, however, comes at a price:
— The script must be running on the chart for it to keep calculating in realtime.
— If you refresh your chart you will lose all accumulated realtime calculations on elapsed realtime bars, and the realtime bar.
Elapsed realtime bars will recalculate as historical bars, i.e., using intrabar inspection, and the realtime bar's calculations will reset.
When the script recalculates elapsed realtime bars as historical bars, the values on those bars will change, which means the script repaints in those conditions.
— When the indicator first calculates on a chart containing an incomplete realtime bar, it will count ALL the existing volume on the bar as Buy or Sell volume,
depending on the polarity of the bar at that point. This will skew calculations for that first bar. Scripts have no access to the history of a realtime bar's previous updates,
and intrabar inspection cannot be used on realtime bars, so this is the only to go about this.
— Even if alerts only trigger upon confirmation of their conditions after the realtime bar closes, they are repainting alerts
because they would perhaps not have calculated the same way using intrabar inspection.
— On markets like stocks that often have different EOD and intraday feeds and volume information,
the volume's scale may not be the same for the realtime bar if your chart is at 1D, for example,
and the indicator is using an intraday timeframe to calculate on historical bars.
— Any chart timeframe can be used in realtime mode, but plots that include moving averages in their calculations may require many elapsed realtime bars before they can calculate.
You might prefer drastically reducing the periods of the moving averages, or using the volume columns mode, which displays instant values, instead of the line.
Volume Delta Balances
This indicator uses a variety of methods to evaluate five volume delta balances and derive other values from those balances. The five balances are:
1 — On Bar Balance : This is the only balance using instant values; it is simply the subtraction of the Sell volume from the Buy volume on the bar.
2 — Average Balance : Calculates a distinct EMA for both the Buy and Sell volumes, and subtracts the Sell EMA from the Buy EMA.
3 — Momentum Balance : Starts by calculating, separately for both Buy and Sell volumes, the difference between the same EMAs used in "Average Balance" and
an SMA of double the period used for the "Average Balance" EMAs. The difference for the Sell side is subtracted from the difference for the Buy side,
and an RSI of that value is calculated and brought over the −50/+50 scale.
4 — Relative Balance : The reference values used in the calculation are the Buy and Sell EMAs used in the "Average Balance".
From those, we calculate two intermediate values using how much the instant Buy and Sell volumes on the bar exceed their respective EMA — but with a twist.
If the bar's Buy volume does not exceed the EMA of Buy volume, a zero value is used. The same goes for the Sell volume with the EMA of Sell volume.
Once we have our two intermediate values for the Buy and Sell volumes exceeding their respective MA, we subtract them. The final "Relative Balance" value is an ALMA of that subtraction.
The rationale behind using zero values when the bar's Buy/Sell volume does not exceed its EMA is to only take into account the more significant volume.
If both instant volume values exceed their MA, then the difference between the two is the signal's value.
The signal is called "relative" because the intermediate values are the difference between the instant Buy/Sell volumes and their respective MA.
This balance flatlines when the bar's Buy/Sell volumes do not exceed their EMAs, which makes it useful to spot areas where trader interest dwindles, such as consolidations.
The smaller the period of the final value's ALMA, the more easily you will see the balance flatline. These flat zones should be considered no-trade zones.
5 — Percent Balance : This balance is the ALMA of the ratio of the "On Bar Balance" value, i.e., the volume delta balance on the bar (which can be positive or negative),
over the total volume for that bar.
From the balances and marker conditions, two more values are calculated:
1 — Marker Bias : It sums the up/down (+1/‒1) occurrences of the markers 1 to 4 over a period you define, so it ranges from −4 to +4, times the period.
Its calculation will depend on the modes used to calculate markers 3 and 4.
2 — Combined Balances : This is the sum of the bull/bear (+1/−1) states of each of the five balances, so it ranges from −5 to +5.
█ FEATURES
The indicator has two main modes of operation: Columns and Line .
Columns
• In Columns mode you can display stacked Buy/Sell volume columns.
• The buy section always appears above the centerline, the sell section below.
• The top and bottom sections can be colored independently using eight different methods.
• The EMAs of the Buy/Sell values can be displayed (these are the same EMAs used to calculate the "Average Balance").
Line
• Displays one of seven signals: the five balances or one of two complementary values, i.e., the "Marker Bias" or the "Combined Balances".
• You can color the line and its fill using independent calculation modes to pack more information in the display.
You can thus appraise the state of 3 different values using the line itself, its color and the color of its fill.
• A "Divergence Levels" feature will use the line to automatically draw expanding levels on divergence events.
Default settings
Using the indicator's default settings, this is the information displayed:
• The line is calculated on the "Average Balance".
• The line's color is determined by the bull/bear state of the "Percent Balance".
• The line's fill gradient is determined by the advances/declines of the "Momentum Balance".
• The orange divergence dots are calculated using discrepancies between the polarity of the "On Bar Balance" and the chart's bar.
• The divergence levels are determined using the line's level when a divergence occurs.
• The background's fill gradient is calculated on advances/declines of the "Marker Bias".
• The chart bars are colored using advances/declines of the "Relative Balance". Divergences are shown in orange.
• The intrabar timeframe is automatically determined from the chart's timeframe so that a minimum of 50 intrabars are used to calculate volume delta on historical bars.
Alerts
The configuration of the marker conditions explained further is what determines the conditions that will trigger alerts created from this script. Note that simply selecting the display of markers does not create alerts. To create an alert on this script, you must use ALT-A from the chart. You can create multiple alerts triggering on different conditions from this same script; simply configure the markers so they define the trigger conditions for each alert before creating the alert. The configuration of the script's inputs is saved with the alert, so from then on you can change them without affecting the alert. Alert messages will mention the marker(s) that triggered the specific alert event. Keep in mind, when creating alerts on small chart timeframes, that discrepancies between alert triggers and markers displayed on your chart are to be expected. This is because the alert and your chart are running two distinct instances of the indicator on different servers and different feeds. Also keep in mind that while alerts only trigger on confirmed conditions, they are calculated using realtime calculation mode, which entails that if you refresh your chart and elapsed realtime bars recalculate as historical bars using intrabar inspection, markers will not appear in the same places they appeared in realtime. So it's important to understand that even though the alert conditions are confirmed when they trigger, these alerts will repaint.
Let's go through the sections of the script's inputs.
Columns
The size of the Buy/Sell columns always represents their respective importance on the bar, but the coloring mode for tops and bottoms is independent. The default setup uses a standard coloring mode where the Buy/Sell columns are always in the bull/bear color with a higher intensity for the winning side. Seven other coloring modes allow you to pack more information in the columns. When choosing to color the top columns using a bull/bear gradient on "Average Balance", for example, you will have bull/bear colored tops. In order for the color of the bottom columns to continue to show the instant bar balance, you can then choose the "On Bar Balance — Dual Solid Colors" coloring mode to make those bars the color of the winning side for that bar. You can display the averages of the Buy and Sell columns. If you do, its coloring is controlled through the "Line" and "Line fill" sections below.
Line and Line fill
You can select the calculation mode and the thickness of the line, and independent calculations to determine the line's color and fill.
Zero Line
The zero line can display dots when all five balances are bull/bear.
Divergences
You first select the detection mode. Divergences occur whenever the up/down direction of the signal does not match the up/down polarity of the bar. Divergences are used in three components of the indicator's visuals: the orange dot, colored chart bars, and to calculate the divergence levels on the line. The divergence levels are dynamic levels that automatically build from the line's values on divergence events. On consecutive divergences, the levels will expand, creating a channel. This implementation of the divergence levels corresponds to my view that divergences indicate anomalies, hesitations, points of uncertainty if you will. It precludes any attempt to identify a directional bias to divergences. Accordingly, the levels merely take note of divergence events and mark those points in time with levels. Traders then have a reference point from which they can evaluate further movement. The bull/bear/neutral colors used to plot the levels are also congruent with this view in that they are determined by the line's position relative to the levels, which is how I think divergences can be put to the most effective use. One of the coloring modes for the line's fill uses advances/declines in the line after divergence events.
Background
The background can show a bull/bear gradient on six different calculations. As with other gradients, you can adjust its brightness to make its importance proportional to how you use it in your analysis.
Chart bars
Chart bars can be colored using seven different methods. You have the option of emptying the body of bars where volume does not increase, as does my TLD indicator, and you can choose whether you want to show divergences.
Intrabar Timeframe
This is the intrabar timeframe that will be used to calculate volume delta using intrabar inspection on historical bars. You can choose between four modes. The three "Auto-steps" modes calculate, from the chart's timeframe, the intrabar timeframe where the said number of intrabars will make up the dilation of chart bars. Adjustments are made for non-24x7 markets. "Fixed" mode allows you to select the intrabar timeframe you want. Checking the "Show TF" box will display in the lower-right corner the intrabar timeframe used at any given moment. The proper selection of the intrabar timeframe is important. It must achieve maximal granularity to produce precise results while not unduly slowing down calculations, or worse, causing runtime errors. Note that historical depth will vary with the intrabar timeframe. The smaller the timeframe, the shallower historical plots you will be.
Markers
Markers appear when the required condition has been confirmed on a closed bar. The configuration of the markers when you create an alert is what determines when the alert will trigger. Five markers are available:
• Balances Agreement : All five balances are either bullish or bearish.
• Double Bumps : A double bump is two consecutive up/down bars with +/‒ volume delta, and rising Buy/Sell volume above its average.
• Divergence confirmations : A divergence is confirmed up/down when the chosen balance is up/down on the previous bar when that bar was down/up, and this bar is up/down.
• Balance Shifts : These are bull/bear transitions of the selected signal.
• Marker Bias Shifts : Marker bias shifts occur when it crosses into bull/bear territory.
Periods
Allows control over the periods of the different moving averages used to calculate the balances.
Volume Discrepancies
Stock exchanges do not report the same volume for intraday and daily (or higher) resolutions. Other variations in how volume information is reported can also occur in other markets, namely Forex, where volume irregularities can even occur between different intraday timeframes. This will cause discrepancies between the total volume on the bar at the chart's timeframe, and the total volume calculated by adding the volume of the intrabars in that bar's dilation. This does not necessarily invalidate the volume delta information calculated from intrabars, but it tells us that we are using partial volume data. A mechanism to detect chart vs intrabar timeframe volume discrepancies is provided. It allows you to define a threshold percentage above which the background will indicate a difference has been detected.
Other Settings
You can control here the display of the gray dot reminder on realtime bars, and the display of error messages if you are using a chart timeframe that is not greater than the fixed intrabar timeframe, when you use that mode. Disabling the message can be useful if you only use realtime mode at chart timeframes that do not support intrabar inspection.
█ RAMBLINGS
On Volume Delta
Volume is arguably the best complement to interpret price action, and I consider volume delta to be the most effective way of processing volume information. In periods of low-volatility price consolidations, volume will typically also be lower than normal, but slight imbalances in the trend of the buy/sell volume balance can sometimes help put early odds on the direction of the break from consolidation. Additionally, the progression of the volume imbalance can help determine the proximity of the breakout. I also find volume delta and the number of divergences very useful to evaluate the strength of trends. In trends, I am looking for "slow and steady", i.e., relatively low volatility and pauses where price action doesn't look like world affairs are being reassessed. In my personal mythology, this type of trend is often more resilient than high-volatility breakouts, especially when volume balance confirms the general agreement of traders signaled by the low-volatility usually accompanying this type of trend. The volume action on pauses will often help me decide between aggressively taking profits, tightening a stop or going for a longer-term movement. As for reversals, they generally occur in high-volatility areas where entering trades is more expensive and riskier. While the identification of counter-trend reversals fascinates many traders to no end, they represent poor opportunities in my view. Volume imbalances often precede reversals, but I prefer to use volume delta information to identify the areas following reversals where I can confirm them and make relatively low-cost entries with better odds.
On "Buy/Sell" Volume
Buying or selling volume are misnomers, as every unit of volume transacted is both bought and sold by two different traders. While this does not keep me from using the terms, there is no such thing as “buy only” or “sell only” volume. Trader lingo is riddled with peculiarities.
Divergences
The divergence detection method used here relies on a difference between the direction of a signal and the polarity (up/down) of a chart bar. When using the default "On Bar Balance" to detect divergences, however, only the bar's volume delta is used. You may wonder how there can be divergences between buying/selling volume information and price movement on one bar. This will sometimes be due to the calculation's shortcomings, but divergences may also occur in instances where because of order book structure, it takes less volume to increase the price of an asset than it takes to decrease it. As usual, divergences are points of interest because they reveal imbalances, which may or may not become turning points. To your pattern-hungry brain, the divergences displayed by this indicator will — as they do on other indicators — appear to often indicate turnarounds. My opinion is that reality is generally quite sobering and I have no reliable information that would tend to prove otherwise. Exercise caution when using them. Consequently, I do not share the overwhelming enthusiasm of traders in identifying bullish/bearish divergences. For me, the best course of action when a divergence occurs is to wait and see what happens from there. That is the rationale underlying how my divergence levels work; they take note of a signal's level when a divergence occurs, and it's the signal's behavior from that point on that determines if the post-divergence action is bullish/bearish.
Superfluity
In "The Bed of Procrustes", Nassim Nicholas Taleb writes: To bankrupt a fool, give him information . This indicator can display lots of information. While learning to use a new indicator inevitably requires an adaptation period where we put it through its paces and try out all its options, once you have become used to it and decide to adopt it, rigorously eliminate the components you don't use and configure the remaining ones so their visual prominence reflects their relative importance in your analysis. I tried to provide flexible options for traders to control this indicator's visuals for that exact reason — not for window dressing.
█ LIMITATIONS
• This script uses a special characteristic of the `security()` function allowing the inspection of intrabars — which is not officially supported by TradingView.
It has the advantage of permitting a more robust calculation of volume delta than other methods on historical bars, but also has its limits.
• Intrabar inspection only works on some chart timeframes: 3, 5, 10, 15 and 30 minutes, 1, 2, 3, 4, 6, and 12 hours, 1 day, 1 week and 1 month.
The script’s code can be modified to run on other resolutions.
• When the difference between the chart’s timeframe and the intrabar timeframe is too great, runtime errors will occur. The Auto-Steps selection mechanisms should avoid this.
• All volume is not created equally. Its source, components, quality and reliability will vary considerably with sectors and instruments.
The higher the quality, the more reliably volume delta information can be used to guide your decisions.
You should make it your responsibility to understand the volume information provided in the data feeds you use. It will help you make the most of volume delta.
█ NOTES
For traders
• The Data Window shows key values for the indicator.
• While this indicator displays some of the same information calculated in my Delta Volume Columns ,
I have elected to make it a separate publication so that traders continue to have a simpler alternative available to them. Both code bases will continue to evolve separately.
• All gradients used in this indicator determine their brightness intensities using advances/declines in the signal—not their relative position in a pre-determined scale.
• Volume delta being relative, by nature, it is particularly well-suited to Forex markets, as it filters out quite elegantly the cyclical volume data characterizing the sector.
If you are interested in volume delta, consider having a look at my other "Delta Volume" indicators:
• Delta Volume Realtime Action displays realtime volume delta and tick information on the chart.
• Delta Volume Candles builds volume delta candles on the chart.
• Delta Volume Columns is a simpler version of this indicator.
For coders
• I use the `f_c_gradientRelativePro()` from the PineCoders Color Gradient Framework to build my gradients.
This function has the advantage of allowing begin/end colors for both the bull and bear colors. It also allows us to define the number of steps allowed for each gradient.
I use this to modulate the gradients so they perform optimally on the combination of the signal used to calculate advances/declines,
but also the nature of the visual component the gradient applies to. I use fewer steps for choppy signals and when the gradient is used on discrete visual components
such as volume columns or chart bars.
• I use the PineCoders Coding Conventions for Pine to write my scripts.
• I used functions modified from the PineCoders MTF Selection Framework for the selection of timeframes.
█ THANKS TO:
— The devs from TradingView's Pine and other teams, and the PineCoders who collaborate with them. They are doing amazing work,
and much of what this indicator does could not be done without their recent improvements to Pine.
— A guy called Kuan who commented on a Backtest Rookies presentation of their Volume Profile indicator using a `for` loop.
This indicator started from the intrabar inspection technique illustrated in Kuan's snippet.
— theheirophant , my partner in the exploration of the sometimes weird abysses of `security()`’s behavior at intrabar timeframes.
— midtownsk8rguy , my brilliant companion in mining the depths of Pine graphics.

Trend Lines for RSI, CCI, Momentum, OBVHello Traders!
After publishing Trend Lines for RSI yesterday, I realized that Trend Lines for more indicators needed by the traders. so I decided to make it for four different indicators: RSI, CCI, OBV, Momentum
In the indicator options you can choose the indicator from pull-down menu.
How it works?
- On each bar it finds last 10 higher and lower Pivot Points (PP) for the indicator.
- from first bar to 10. Pivot Point it searchs if a trend line is possible
- for each PP it starts searching from the last PP .
- it checks if drawing a trend line possible or not and also it's broken or not
- if it's broken then optionally it shows broken trend lines as dotted (or you can option not to see broken lines)
- if it finds a continues trend line then it stops searhing more and draw trend line, this is done by checking angles (I did this to make the script faster, otherwise you may get error because of it needs time more than .2sec)
- the script makes this process for each PP
- then shows the trend lines
P.S. it may need 3-10 seconds when you added the script to the chart at first (because of calculations)
Trend lines for CCI:
Trend Lines for OBV
Trend Lines for Momentum:
You may want to watch how Trend Lines script works (that was made for RSI)
s3.tradingview.com
If you still didn't see Trend Lines v2 then visit:
All Comments are welcome..
Enjoy!

SMU Quantum Thermo BallsThis script is the enhanced version of Market Thermometer with one difference. This one has Quantum Thermo balls shooting out of the thermometer tube when overheated. Quantum psychology, Quantum observation, call it what you like
My scripts are designed to beat ALGO, so the behavior of indicators is not like traditional indicators. Don't try to overthink it and compare it to other established functions.
If you knew ALGo as much as I do, then you would also ditch old indicators and design your own weird scripts to match the ALGO's personality. Oh yes, each AlGo for each stock has its own programming personality. Most my scripts are tuned to beat SPX ALGO meniac
Enjoy and think outside the box, the only way to beat the ALGO

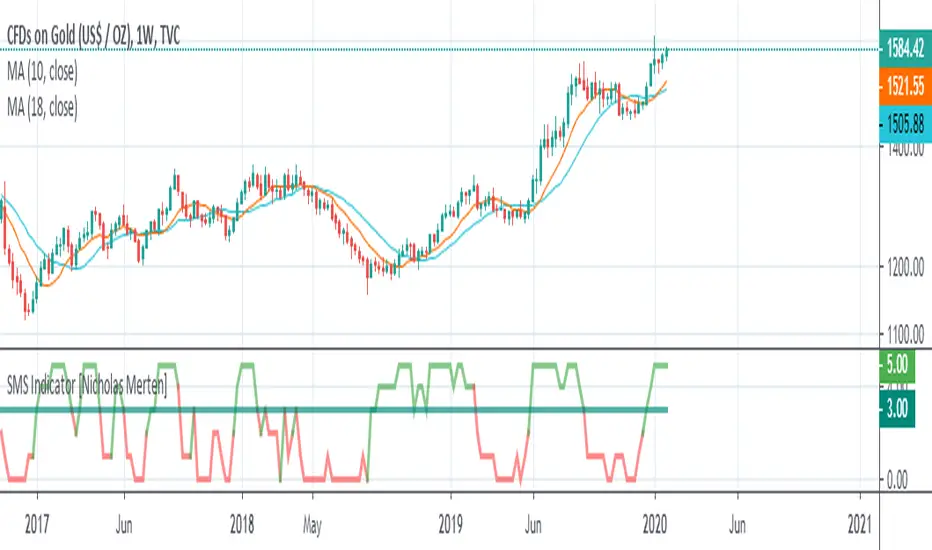
SMS Indicator [Nicholas Merten]SMS is the acronym for the combination of the three prominent indicators; the squeeze momentum, MACD and Stochastic RSI indicator. It aggregates all of three lagging indicators to derive the trend of an underlying instrument. The script outcome works best when applied on weekly, standard charts (i.e. candles stick charts).
In general terms, these are the rules that define the indicator. But bear in mind, there are other miscellaneous factors that can determine the SMS indicator. (Feel free to review the pine code if you'd like):
"If the squeeze momentum is setting a higher weekly candle, add a point"
"If the MACD is closing its divergence from a descending movement, add a point"
"If the MACD crosses to the upside, add a point"
"If the blue line crosses the orange at the bottom of the Stochastic RSI , add one point"
"If the two lines have entered the purple channel from the bottom of the Stochastic RSI , add one point"
If the score is 3/5 or more, the indicator is flashing a bullish signal . If it's 2/5 or below, the indicator is flashing a bearish signal.
You can easily create an alert to trigger when there's a 3/5 point cross or a cross below 2/5, gearing up for a potential reversal in trend.
Finally, don't just trade on this indicator alone. This indicator is not meant to be used alone, rather, it can be a useful guide to understand the generic trend of an instrument by merging together a lot of leading indicators.
MacD (Future Known or Unknown) StrategyThis indicator/strategy is to be used as a way to baseline the top potential any strategy could have with other strategies and indicators.
What I have created literally shows the BEST moves possible you could have made in my opinion for SHORTING or LONGING using only the MacD values of the 4 hour while on the 30 minute chart.
To use this, try checking out XBTUSD on the 30 minute chart . It will work under different time frames but works best on the 30 minute chart in my opinion. It WILL NOT WORK Above 2 hours time frame.
DO NOT TRADE WITH THIS indicator . I can't emphasize this enough. These results only work because of the lookahead_on parameter. A lot of scam indicators and strategies use this to trick people on tradingView into buying their scripts.
This code is OPEN SOURCE and as such there is nothing to hide and no scam!
I like to use this as a comparison tool for how good I 'could' have traded and at what points those were. By knowing where the perfect trading positions are, you can create real indicators and scripts that try to find patterns in those positions.
This also shows that IF you could know the direction the MacD was going what amazing results you could get ^_~.
This is meant purely for entertainment purposes and for comparing against your own scripts.
I've included the options in the settings to allow ONLY LONG or ONLY SHORTS. By default it attempts both buy attempts. You can also change your starting ($) amount and commission percentage that is taken per trade as well.
Also included in the options is the ability to set the back testing time frame to see how it performs during just certain time periods.
Finally a color explanation
Red - MacD 4 hour going down
Green - MacD 4 hour going up
Purple - MacD 4 hour going down (from an up position)
Yellow - MacD 4 hour going up (from a down position)
Notice the program will always buy right before it turns into a yellow color since it knows the future.
In the options you can turn off 'use the future' to see the horrible results if you trade the moment you know which direction the MacD 4 hour is actually going. I will revise this script in the future with attempts to work without knowing the future as play options to get better results.
If you have any questions or comments, please do not hesitate to ask!

Leavitt Convolutions Multicator - Jay Leavitt, Ph.D.Hot off the press, I present this next generation "Leavitt Convolutions Multicator" employing PSv4.0, originally formulated by Jay Leavitt, Ph.D. for TASC - January 2020 Traders Tips. Basically it's an all-in-one combination of three Leavitt indicators. This triplet indicator, being less than a 60 line implementation at initial release, is a heavily modified version of the original indicator using novel techniques, surpassing Leavitt's original intended design.
Utilizing the "Power of Pine", I included the maximum amount of features I could surmise in an ultra small yet powerful package. Configurations are displayed above in multiple scenarios that should be suitable for most traders.
Features List Includes:
Dark Background - Easily disabled in indicator Settings->Style for "Light" charts or with Pine commenting
AND much, much more... You have the source!
For those of you who are new to Pine Script, this script may also help you understand advanced programming techniques in Pine and how they may be utilized in a most effective manner. Most notably, the script shows how to potentially combine three indicators in one with Pine. This is commonly what my dense intricate code looks like behind the veil, and if you are wondering why there is no notes, that's because the notation is in the variable naming.
The comments section below is solely just for commenting and other remarks, ideas, compliments, etc... regarding only this indicator, not others. When available time provides itself, I will consider your inquiries, thoughts, and concepts presented below in the comments section, should you have any questions or comments regarding this indicator. When my indicators achieve more prevalent use by TV members, I may implement more ideas when they present themselves as worthy additions. As always, "Like" it if you simply just like it with a proper thumbs up, and also return to my scripts list occasionally for additional postings. Have a profitable future everyone!

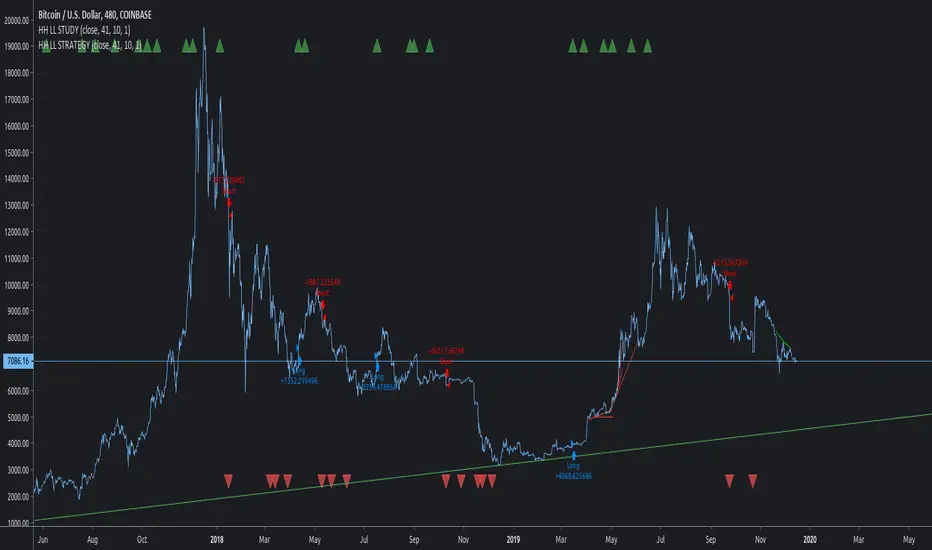
HIGHER HIGH LOWER LOW STRATEGYThis is my favorite for Tradingview.
Please use other indicators to find good entry and good exit. This is why this publication has so many indicators. A good indicator will find good results even on line chart. Feel free to try on "Heiken Ashi" but understand that "line" chart is much more realistic
Due to tradingview's crappy auto resize, the best way to view this script is to click on the share button and "Make it Mine".
Then you can see why my other indicators are "PRESENT"
Cheers!!!
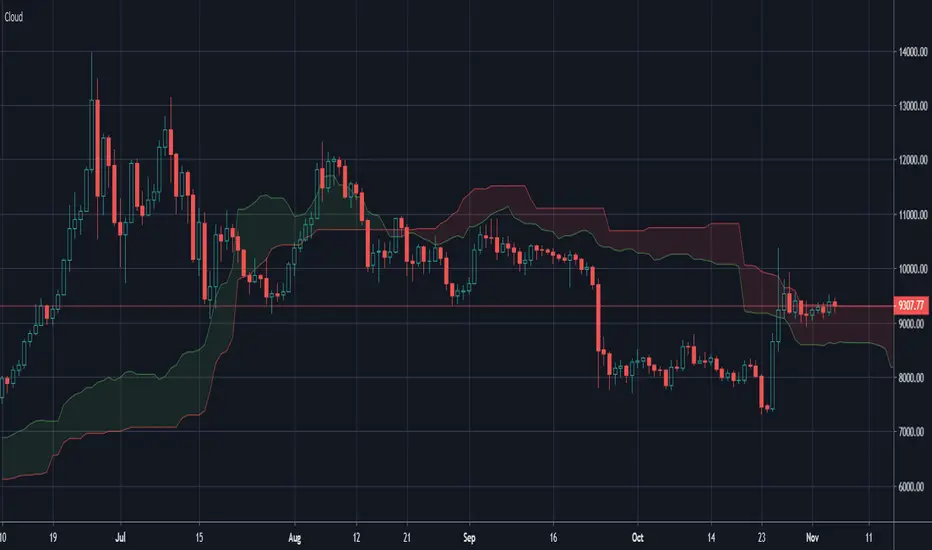
Ichimoku Cloud OnlyPurpose: Makes your chart easier to read by removing some features displayed in the default Ichimoku Cloud
Benefit: Frees up space for other indicators that do the same or similar things. (like MAs and EMAs)
Removed Indicators: Conversion Line, Base Line, and Lagging Span.
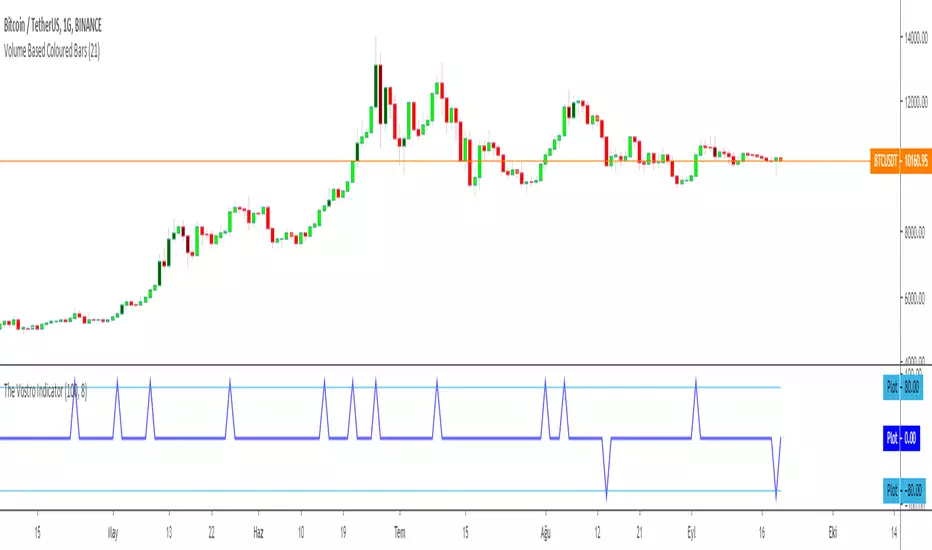
The Vostro Indicator by KIVANÇ fr3762The VOSTRO indicator is a trend indicator that automatically provides buying and selling signals. The indicator marks in a window the potential turning points. The indicator is recommended for scalping.
The Vostro indicator determines the overbought zones (value greater than +80) and the oversold zones (less than the -80 level)
BUY signal: The Vostro curve moves below the -80 level and forms a trough – Turnaround of the upward trend
SELL signal: The Vostro curve moves above the +80 level and forms a peak – Downward trend
further info:
www.prorealcode.com
Here's the link to a complete list of all my indicators:
t.co
Yazar: KıvanÇ @fr3762 twitter
Şimdiye kadar paylaştığım indikatörlerin tam listesi için: t.co
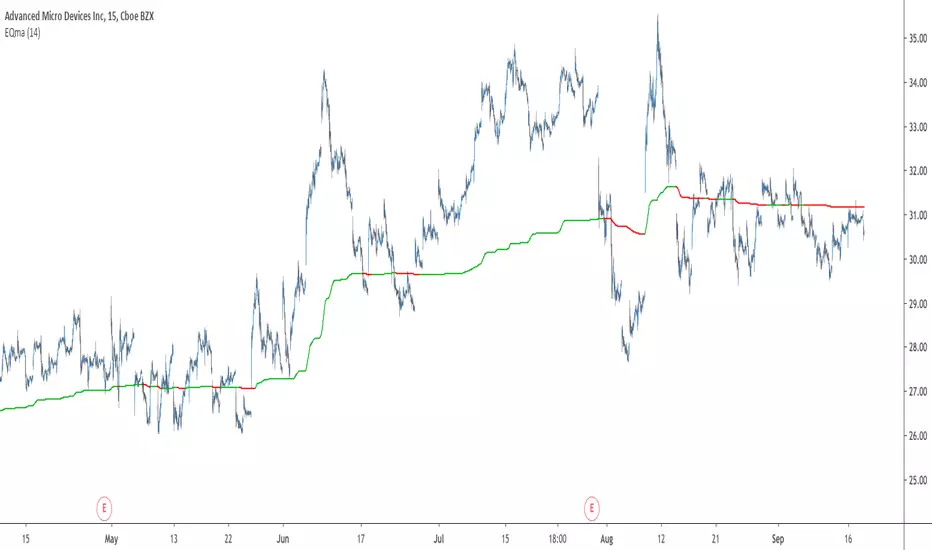
EQma - Adaptive Smoothing Based On Optimal Markets DetectionIntroduction
"You don’t put sunscreen when there is no sun, you don’t use an umbrella when there is no rain, you don’t use a kite when there is no wind, so why would you use a trend following strategy when there is no trend ?"
This is how i start my 4th paper "A New Technical Indicator For Optimal Markets Detection" where i present two new technical indicators. We talked about the first one, running equity, which aim to detect the best moment to enter trades, based on this new metric i made an adaptive moving average.
You can see the full paper here figshare.com
The Indicator
The moving average is based on exponential averaging and use a smoothing variable alpha based on the running equity metric, in order to calculate alpha the running equity is divided by the optimal equity which show the best returns possible for the conditions used. Basically the indicator work as follow :
When the running equity is close to the optimal equity it means that the price need no/little filtering since it does not contain information that need to be filtered, therefore alpha is high, however when the running equity is far from the optimal equity this mean that the price posses malign information that need to be removed.
This is why the indicator will be closer to the price when length is high :
See the full paper for an explanation on how this work.
I added various options for the indicator, one will reduce the lag by squaring alpha, thus giving for length = 14 :
The efficient option will make use of recursion to provide a more efficient indicator :
In green the efficient version, note how this option can allow a better fit with the price.
Conclusion
This is an indicator but at its core its rather a framework, if you have read the paper you'll see that the conditions are just 1 and -1 that changes with time, basically its like making a strategy with :
Condition = if buy then 1 else if sell then -1 else Precedent value of condition.
So those two indicators allow to give useful and usable information about your strategy. I hope it can be of use for anyone here, if so don't hesitate to send me what you made using the proposed indicator (and with all my indicators in general). If you are writing a paper and you think this indicator could fit in your work then let me know so i can be aware of it :)
Thanks for reading !
Acknowledgement
My papers are quite ridiculous but they still manage to get some views, some researchers don't even reach those number in so little time which is quite unfortunate but also really motivating for me, so thanks to those who take time to read them and give me some feedback :)
BTC 1D Alerts V1This script contains a variety of key indicator for bitcoin all-in-one and they can be activated individually in the menu. These are meant to be used on the 1D chart for Bitcoin.
1457 Day Moving Average: the bottom of the bitcoin price and arguably the rock bottom price target.
Ichimoku Cloud: a common useful indicator for bitcoin support and resistance.
350ma fibs (21 8 5 3 2 and 1.6) : Signify the tops of each logarthmic rise in bitcoin price. They are generally curving higher over the long term. For halvening #3, the predicted market crash would be after hitting the 350ma x3 fib. Also the 350 ma / 111 ma cross signifies bull market top within about 3 days as well. Using the combination of the 350ma fibs and the 350/111 crosses, reasonably identify when market top is about to occur.
50,120,200 ma: Common moving averages that bitcoin retests during bull market runs. Also, the 50/200 golden and death crosses.
1D EMA Superguppy Ribbons: green = bull market, gray is indeterminate, red = bear market. Very high specificity indicator of bull runs, especially for bitcoin. You can change to 3D candle for even more specificity for a bull market start. Use the 1W for even more specificity. 1D Superguppy is recommended for decisionmaking.
1W EMA21: a very good moving average programmed to be shown on both the daily and weekly candle time. Bitcoin commonly corrects to this repeatedly during past bull runs. Acts as support during bull run and resistance during a bear market.
Steps to identifying a bull market:
1. 50/200 golden cross
2. 1D EMA superguppy green
3. 3D EMA superguppy green (if you prefer more certainty than step 2).
4. Hitting the 1W EMA21 and bouncing off during the bull run signifies corrections.
Once a bull market is identified,
Additional recommended buying and selling techniques:
Indicators:
- Fiblines - to determine retracements from peaks (such as all time high or recent highs)
- Stochastic RSI - 1d, 3d, and 1W SRSI are great time to buy, especially the 1W SRSI which comes much less frequently.
- volumen consolidado - for multi exchange volumes compiled into a single line. I prefer buying on the lowest volume days which generally coincide with dips.
- MACD - somewhat dubious utility but many algorithms are programmed to buy or sell based on this.
Check out the Alerts for golden crosses and 350ma Fib crosses which are invaluable for long term buying planning.
I left this open source so that all the formulas can be understood and verified. Much of it hacked together from other sources but all indicators that are fundamental to bitcoin. I apologize in advance for not attributing all the articles and references... but then again I am making no money off of this anyway.

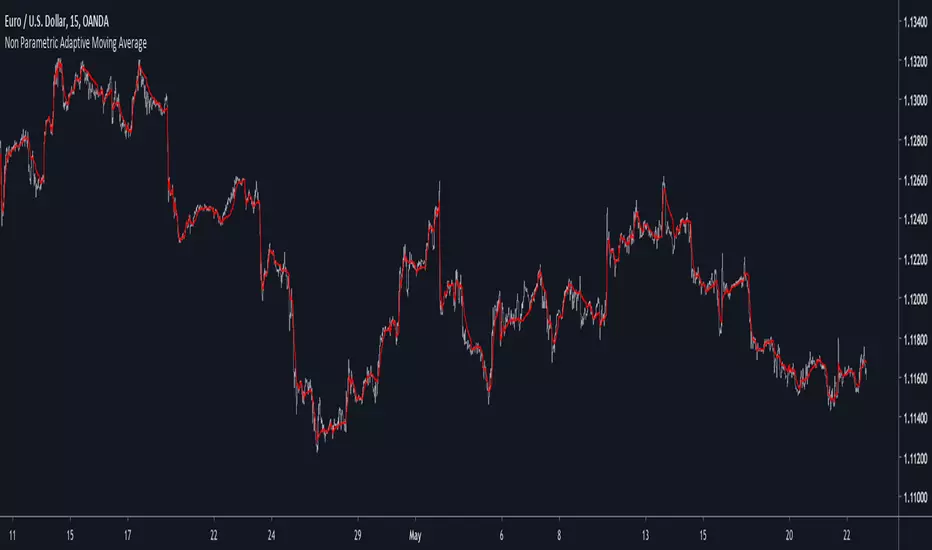
Non Parametric Adaptive Moving AverageIntroduction
Not be confused with non-parametric statistics, i define a "non-parametric" indicator as an indicator who does not have any parameter input. Such indicators can be useful since they don't need to go through parameter optimization. I present here a non parametric adaptive moving average based on exponential averaging using a modified ratio of open-close to high-low range indicator as smoothing variable.
The Indicator
The ratio of open-close to high-low range is a measurement involving calculating the ratio between the absolute close/open price difference and the range (high - low) , now the relationship between high/low and open/close price has been studied in econometrics for some time but there are no reason that the ohlc range ratio may be an indicator of volatility, however we can make the hypothesis that trending markets contain less indecision than ranging market and that indecision is measured by the high/low movements, this is an idea that i've heard various time.
Since the range is always greater than the absolute close/open difference we have a scaled smoothing variable in a range of 0/1, this allow to perform exponential averaging. The ratio of open-close to high-low range is calculated using the vwap of the close/high/low/open price in order to increase the smoothing effect. The vwap tend to smooth more with low time frames than higher ones, since the indicator use vwap for the calculation of its smoothing variable, smoothing may differ depending on the time frame you are in.
1 minute tf
1 hour tf
Conclusion
Making non parametric indicators is quite efficient, but they wont necessarily outperform classical parametric indicators. I also presented a modified version of the ratio of open-close to high-low range who can provide a smoothing variable for exponential averaging. I hope the indicator can help you in any way.
Thanks for reading !
Fisher Combo indicatorWhatsUp traders &&
I would like to share with you this script that I created long time ago. Basically, it is the combination of four indicators: VWAP bands, AO, RSI and Fisher transform. The indicator will rank each of the four indicator and only trigger a long or short signal when certain points are achieved.
I created this indicator because I felt that if certain indicators give the same signal then there is a higher win rate. You may want to modify a bit into strategy script and test it with your stock. Recommended 1 minute.
This is not a very good strategy, it can miss many opportunities. It may give wrong signal because it does not consider price action and volume movement or balabala reason.
Hope this script can inspire you and maybe you can create some awesome strategy that makes you $$$$$$

ICHIMOKU MTFMultiple Time Frame Version of Ichimoku Kinko Hyo Indicator.
Created in 1940's by Goichi Hosoda withe the help of University students in Japan.
Ichimoku is one of the best trend following indicators that works nearly perfect in all markets and time frames.
Ichimoku is originally an built in indicator in Tradingview but there are some problems like:
the indicator hast 5 lines but you can change only 4 parameters in the settings menu of Tradingview Charts which you could only control 3 of the lines effectively. A second problem is that Tradingview preferred to use English titles for the ICHIMOKU lines instead of giving them the most common original Japanese ones. (So I rewrite the indicator)
Kijun Sen (blue line): Also called standard line or base line, this is calculated by averaging the highest high and the lowest low for the past 26 periods.
Tenkan Sen (red line): This is also known as the turning line and is derived by averaging the highest high and the lowest low for the past nine periods.
Chikou Span (Plum line): This is called the lagging line. It is today’s closing price plotted 26 periods behind.
Senkou SpanA (green line): The first Senkou line is calculated by averaging the Tenkan Sen and the Kijun Sen and plotted 26 periods ahead.
Senkou SpanB (purple line):
The second Senkou line is determined by averaging the highest high and the lowest low for the past 52 periods and plotted 26 periods ahead.
PERSONALLY I ADVISE YOU TO USE ICHIMOKU WITH DEAFULT LENGTHS (9,26,26,52,26) IN ORDER FOR STOCK MARKETS AND FOREX MARKETS
FOR CRYPTO YOU'D BETTER USE:
10,30,30,60,30 OR 20,60,60,120,60
THE TRICKY THING IS THAT KEEPING THE 1-3-3-6-3 RATIO CONSTANT IS NECESSARY
Here's a link of my Youtube video explaining ICHIMOKU but unfortunately only in TURKISH:
www.youtube.com
Developed by: Goichi Hosoda
Here's the link to a complete list of all my indicators:
tr.tradingview.com
Ichimoku kullanımı anlattığım detaylı video serisini linkten izleyebilirsiniz:
www.youtube.com
İndikatörü geliştiren: Goichi Hosoda

Accumulation/Distribution Money Flow [Cyrus c|:D]This indicator should be more accurate than other indicators in its class (including MFI, CMF, ADL, and OBV) for measuring buy/sell pressure, identifying trend change through divergence and calculating Accumulation/Distribution (A/D) level (I will explain why in a separate TA).
This indicator is based on my previous indicator "Accumulation/Distribution Volume". It does not include the volume bars. The volume effect is adjustable as well.
Application:
- Buy/sell pressure: above 0 shows buy pressure, below 0 shows sell pressure.
- Divergence: as shown in the chart above, this indicator diverged from BTC price during swing lows and highs in the shown period.
- Accumulation/distribution: set Aggregation=Sum, Volume Exponent=10 and uncheck Price Factor.
Recommendations:
- Never use SMA
- Use larger length EMA for confirmation of divergence or buy/sell pressure (EMA 27 is equal to RMA 14 which is used in RSI).
. A/D mode is not recommended for hidden divergence.
My Setup:
- I use one instances of this indicator with default settings for buy/sell pressure
- A second instance for A/D level overlaid on the main chart
- One instance of "Accumulation/Distribution Volume" as a replacement for volume indicator
This indicator can also replicate Accumulation/Distribution Line (improved by True Range), On Balance Volume, and Price Volume Trend. Read more details on the description of the previous indicator:
I strongly recommend reading about similar indicators for potential uses e.g. www.tradingview.com(MFI) and www.tradingview.com(PVT)
I will publish a TA about correctly measuring divergence and using these indicators.
Please report any problems you find in the comments.
