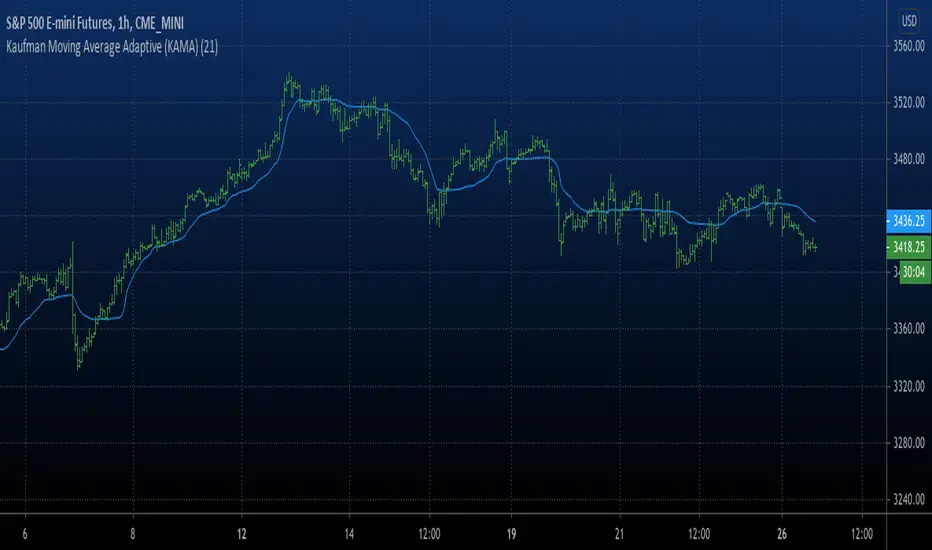
Kaufman Adaptive Moving AverageFrom Stockcharts.com:
"Developed by Perry Kaufman, Kaufman's Adaptive Moving Average (KAMA) is a moving average designed to account for market noise or volatility. KAMA will closely follow prices when the price swings are relatively small and the noise is low. KAMA will adjust when the price swings widen and follow prices from a greater distance. This trend-following indicator can be used to identify the overall trend, time turning points and filter price movements."
This is different from other users' KAMA's because it allows the user to adjust more parameters that can adjust the indicator in more precise ways without needing to change the source code.
Cerca negli script per "kama"

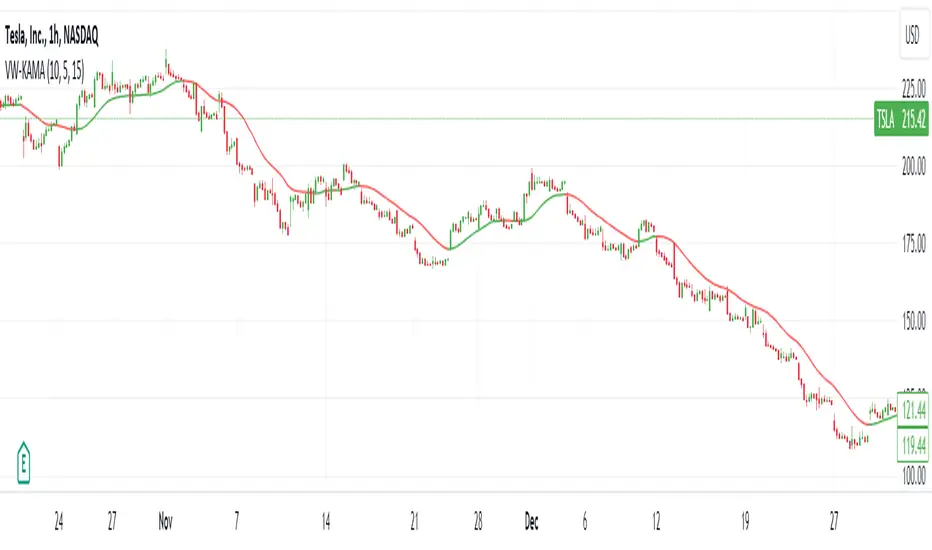
Volume-Weighted Kaufman's Adaptive Moving AverageThe Volume-Weighted Kaufman's Adaptive Moving Average (VW-KAMA) is a technical indicator that combines the Volume-Weighted Moving Average (VWMA) and the Kaufman's Adaptive Moving Average (KAMA) to create a more responsive and adaptable moving average.
Advantages:
Volume-Weighted: It takes into account the volume of trades, giving more weight to periods with higher trading volume, which can help filter out periods of low activity.
Adaptive: The indicator adjusts its smoothing constant based on market conditions, becoming more sensitive in trending markets and less sensitive in choppy or sideways markets.
Versatility: VW-KAMA can be used for various purposes, including trend identification, trend following, and determining potential reversal points and act as dynamic support and resistance level.
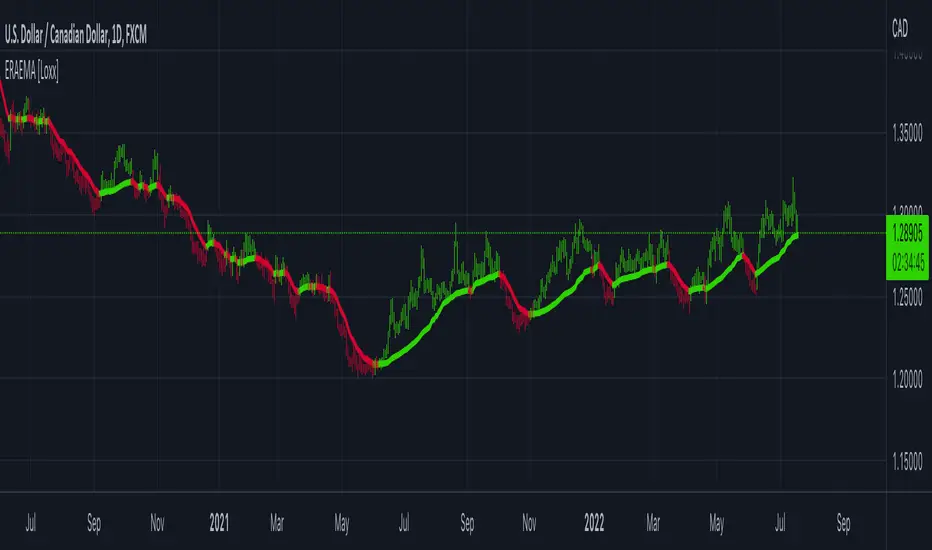
Efficiency-Ratio-Adaptive EMA [Loxx]Efficiency ratio was invented by Perry Kaufman as a measure of volatility and as a way of making some calculations adaptive. In his adaptive moving average he uses 3 periods for calculation which makes it a bit "cryptic" and, by all means, not so simple to use. This version is simplifying the whole thing without an intention to clone the KAMA indicator--but with the intention to use the efficiency ratio for adapting the average calculations and to use only two parameters for that:
period
price
Included:
Bar coloring
KAMA Baseline + atrThis script displays a KAMA (Kaufman adaptative moving average) baseline on the chart (default = 14, 2, 30)
There is an option for display an ATR channel around it, with a *factor (default = 1)
Supports both dark and light mode

Adaptive ChannelThis indicator uses KAMA to adjust the length of a channel according to volatility.
A set up is generated when a candle closes below/above the mid point line; this is indicated via the background color.
Buy/sell on the break of the high/low of the signal candle.
Use the channel top/bottom as a stop (or a close above/below the mid pint line)


Golden Cross KAMAThe usage is very easy. When the line is green you can open long position, when the line is red you can open short position and when it's black just check by yourself.
Usually I use it with RSI and Bollinger Bands , in order to determine when the signal is strong or weak.
Just play with fastest and slowest SC to adjust the smoothness.

Kaufman Moving Average Adaptive (KAMA) Everyone wants a short-term, fast trading trend that works without large
losses. That combination does not exist. But it is possible to have fast
trading trends in which one must get in or out of the market quickly, but
these have the distinct disadvantage of being whipsawed by market noise
when the market is volatile in a sideways trending market. During these
periods, the trader is jumping in and out of positions with no profit-making
trend in sight. In an attempt to overcome the problem of noise and still be
able to get closer to the actual change of the trend, Kaufman developed an
indicator that adapts to market movement. This indicator, an adaptive moving
average (AMA), moves very slowly when markets are moving sideways but moves
swiftly when the markets also move swiftly, change directions or break out of
a trading range.
ALP AT + KAMA Crossover This indicator is a powerful combination of two adaptive trend-following concepts: the AlphaTrend by Kivanc Ozbilgic and the Kaufman's Adaptive Moving Average (KAMA), often credited to Perry Kaufman (with the specific implementation based on HPotter's interpretation of KAMA).
The primary goal of this indicator is to provide a robust trend detection and dynamic support/resistance system, adapting to market volatility.
How it Works:
AlphaTrend Component: The green/red line is the AlphaTrend. It dynamically adjusts to market volatility (using ATR) and momentum (using MFI or RSI, configurable). It provides faster signals for trend changes.
KAMA Component: The black line is the Kaufman's Adaptive Moving Average. KAMA is designed to filter out market noise during choppy periods and follow the price closely during trending periods, making it a smoother and more reliable long-term trend indicator.
Color-Coded Trend Zones: The AlphaTrend line is color-coded to visually represent the current market condition based on the price's position relative to both AlphaTrend and KAMA:
Strong Uptrend (Lime Green): Price is above both AlphaTrend and KAMA.
Strong Downtrend (Red): Price is below both AlphaTrend and KAMA.
Uptrend Uncertainty (Orange): Price is above KAMA but below AlphaTrend (suggests consolidation or weakening uptrend).
Downtrend Uncertainty (Blue): Price is below KAMA but above AlphaTrend (suggests consolidation or strengthening downtrend within a downtrend).
Gray: Default/unclassified state.
The underlying logic is based on:
Bullish Crossover (Potential Buy Signal): When the AlphaTrend line crosses above the KAMA line.
Bearish Crossover (Potential Sell Signal): When the AlphaTrend line crosses below the KAMA line.
These crossovers indicate a shift in the adaptive trend momentum.
Customization:
Users can customize various parameters in the indicator's settings, including:
AlphaTrend Multiplier and Common Period.
KAMA Lengths and Alpha values.
All the color codes for different trend zones and lines, allowing for full personalization of the visual output.
Disclaimer:
This indicator is for informational and educational purposes only and should not be considered as financial advice. Trading involves substantial risk, and past performance is not indicative of future results. Always conduct your own thorough research and analysis before making any trading or investment decisions. This indicator is NOT a buy/sell/hold recommendation. Use it as a tool to aid your analysis, not as a sole basis for your trades.

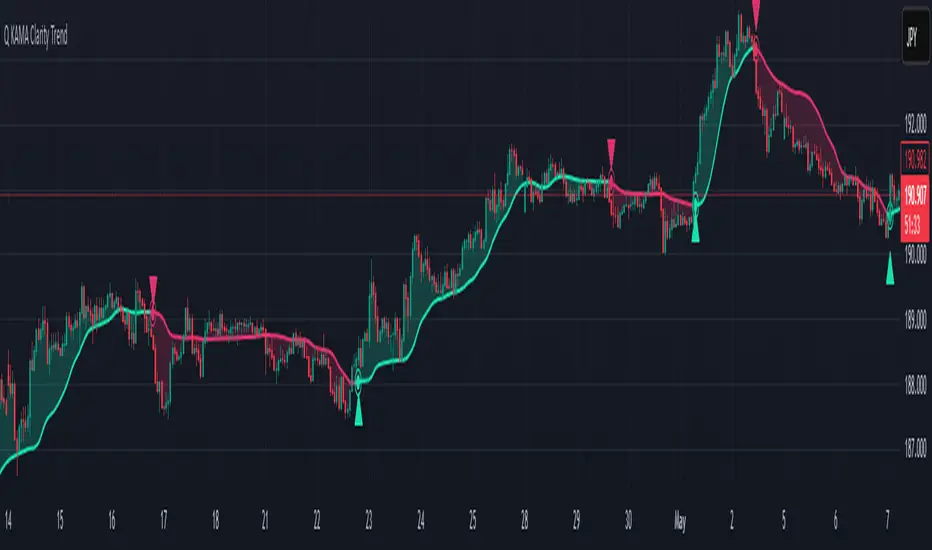
Q KAMA Clarity Trend Q KAMA Clarity Trend
A minimalistic yet versatile trend-following tool that combines **Kaufman’s Adaptive Moving Average (KAMA) with Gaussian smoothing and ATR-based breakout logic. Built for traders who value clarity, responsiveness, and visual simplicity.
🔧 Core Features
1. Adaptive KAMA Trend Line
• Dynamically adjusts to market volatility using Kaufman’s KAMA.
• Gaussian filter pre-smooths price to reduce noise before calculating KAMA.
2. Dual Trend Logic (toggle)
• Default: Trend shifts on price breakouts above/below KAMA ± ATR channel.
• Alternative: Faster signals based on price crossing KAMA directly.
3. Visual Feedback
• Auto-colored KAMA line based on trend direction (up/down/neutral).
• Arrows on trend reversals (up = green, down = red).
• Optional shadow fill below line for regime clarity.
• Optional dot marker ("⦿") on the KAMA line to show trend shifts.
4. Alerts
• Real-time alerts when a new uptrend or downtrend begins.
• Compatible with manual or automated strategies.
⚙️ Configurable Inputs
• Source: Price input (default: close)
• KAMA Length: Adjusts sensitivity (longer = smoother)
• ATR Length & Multiplier: Defines channel width for breakout detection
• Gaussian Filter (Length & Sigma): Controls smoothing strength
• Trend Logic Mode: ATR channel breakout vs. price-KAMA cross
• Style: Custom colors, background fill, marker visibility
📈 How to Use
• Follow trend arrows for directional confirmation
• Use ATR breakout mode for cleaner, filtered signals
• Switch to price-KAMA crossover mode for earlier entries
• Works well with structure, momentum, and volume confirmation
savitzkyGolay, KAMA, HPOverview
This trading indicator integrates three distinct analytical tools: the Savitzky-Golay Filter, Kaufman Adaptive Moving Average (KAMA), and Hodrick-Prescott (HP) Filter. It is designed to provide a comprehensive analysis of market trends and potential trading signals.
Components
Hodrick-Prescott (HP) Filter
Purpose: Smooths out the price data to identify the underlying trend.
Parameters: Lambda: Controls the smoothness. Range: 50 to 1600.
Impact of Parameters:
Increasing Lambda: This makes the trend line more responsive to short-term market fluctuations, suitable for short-term analysis. A higher Lambda value decreases the degree of smoothing, making the trend line follow recent market movements more closely.
Decreasing Lambda: A lower Lambda value makes the trend line smoother and less responsive to short-term market fluctuations, ideal for longer-term trend analysis. Decreasing Lambda increases the degree of smoothing, thereby filtering out minor market movements and focusing more on the long-term trend.
Kaufman Adaptive Moving Average (KAMA):
Purpose: An adaptive moving average that adjusts to price volatility.
Parameters: Length, Fast Length, Slow Length: Define the sensitivity and adaptiveness of KAMA.
Impact of Parameters:
Adjusting Length affects the base period for efficiency ratio, altering the overall sensitivity.
Fast Length and Slow Length control the speed of KAMA’s adaptation. A smaller Fast Length makes KAMA more sensitive to price changes, while a larger Slow Length makes it less sensitive.
Savitzky-Golay Filter:
Purpose: Smooths the price data using polynomial regression.
Parameters: Window Size: Determines the size of the moving window (7, 9, 11, 15, 21).
Impact of Parameters:
A larger Window Size results in a smoother curve, which is more effective for identifying long-term trends but can delay reaction to recent market changes.
A smaller Window Size makes the curve more responsive to short-term price movements, suitable for short-term trading strategies.
General Impact of Parameters
Adjusting these parameters can significantly alter the signals generated by the indicator. Users should fine-tune these settings based on their trading style, the characteristics of the traded asset, and market conditions to optimize the indicator's performance.
Signal Logic
Buy Signal: The trend from the HP filter is below both the KAMA and the Savitzky-Golay SMA, and none of these indicators are flat.
Sell Signal: The trend from the HP filter is above both the KAMA and the Savitzky-Golay SMA, and none of these indicators are flat.
Usage
Due to the combination of smoothing algorithms and adaptability, this indicator is highly effective at identifying emerging trends for both initiating long and short positions.
IMPORTANT : Although the code and user settings incorporate measures to limit false signals due to lateral (sideways) movement, they do not completely eliminate such occurrences. Users are strongly advised to avoid signals that emerge during simultaneous lateral movements of all three indicators.
Despite the indicator's success in historical data analysis using its signals alone, it is highly recommended to use this code in combination with other indicators, patterns, and zones. This is particularly important for determining exit points from positions, which can significantly enhance trading results.
Limitations and Recommendations
The indicator has shown excellent performance on the weekly time frame (TF) with the following settings:
Savitzky-Golay (SG): 11
Hodrick-Prescott (HP): 100
Kaufman Adaptive Moving Average (KAMA): 20, 2, 30
For the monthly TF, the recommended settings are:
SG: 15
HP: 100
KAMA: 30, 2, 35
Note: The monthly TF is quite variable. With these settings, there may be fewer signals, but they tend to be more relevant for long-term investors. Based on a sample of 40 different stocks from various countries and sectors, most exhibited an average trade return in the thousands of percent.
It's important to note that while these settings have been successful in past performance, market conditions vary and past performance is not indicative of future results. Users are encouraged to experiment with these settings and adjust them according to their individual needs and market analysis.
As this is my first developed trading indicator, I am very open to and appreciative of any suggestions or comments. Your feedback is invaluable in helping me refine and improve this tool. Please feel free to share your experiences, insights, or any recommendations you may have.

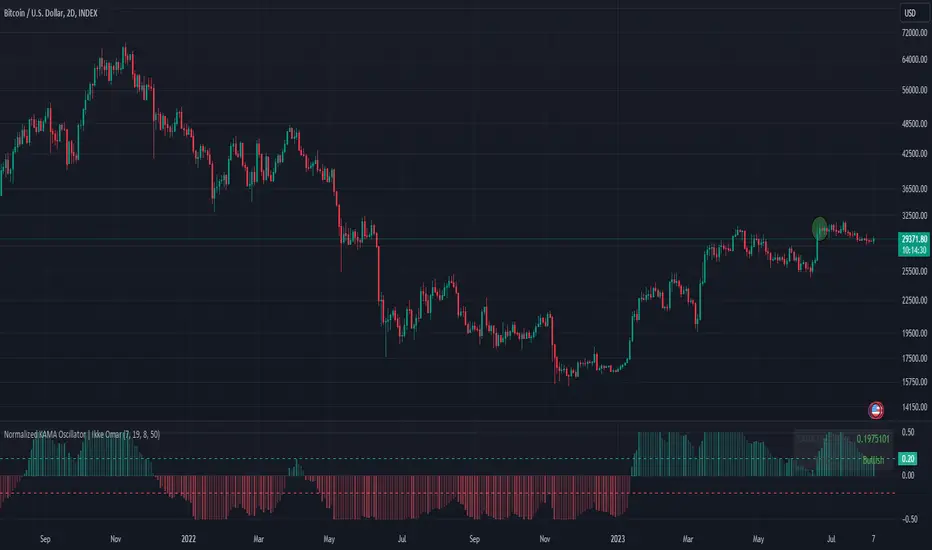
Normalized KAMA Oscillator | Ikke OmarThis indicator demonstrates the creation of a normalized KAMA (Kaufman Adaptive Moving Average) oscillator with a table display. I will explain how the code works, providing a step-by-step breakdown. This is personally made by me:)
Input Parameters:
fast_period and slow_period: Define the periods for calculating the KAMA.
er_period: Specifies the period for calculating the Efficiency Ratio.
norm_period: Determines the lookback period for normalizing the oscillator.
Efficiency Ratio (ER) Calculation:
Measures the efficiency of price changes over a specified period.
Calculated as the ratio of the absolute price change to the total price volatility.
Smoothing Constant Calculation:
Determines the smoothing constant (sc) based on the Efficiency Ratio (ER) and the fast and slow periods.
The formula accounts for the different periods to calculate an appropriate smoothing factor.
KAMA Calculation:
Uses the Exponential Moving Average (EMA) and the smoothing constant to compute the KAMA.
Combines the fast EMA and the adjusted price change to adapt to market conditions.
Oscillator Normalization:
Normalizes the oscillator values to a range between -0.5 and 0.5 for better visualization and comparison.
Determines the highest and lowest values of the KAMA within the specified normalization period.
Transforms the KAMA values into a normalized range.
By incorporating the Efficiency Ratio, smoothing constant, and normalization techniques, the indicator actually allows for the identification of trends on different timeframes, even in extreme market conditions.
The normalization makes it much more adaptive than if you were to just use a normal KAMA line. This way you actually get a lot more data by looking at the histogram, rather than just the KAMA line.
I essentially made the KAMA into an oscillator! Please ask if you want me to code another indicator
I hope you enjoyed this.
Please ask if you have any questions<3
Adaptive MA Scalping StrategyAdaptive MA Scalping Strategy
The Adaptive MA Scalping Strategy is an innovative trading approach that merges the strengths of the Kaufman's Adaptive Moving Average (KAMA) with the Moving Average Convergence Divergence (MACD) histogram. This combination results in a momentum-adaptive moving average that dynamically adjusts to market conditions, providing traders with timely and reliable signals.
How It Works
Kaufman's Adaptive Moving Average (KAMA): Unlike traditional moving averages, KAMA adjusts its sensitivity based on market volatility. It becomes more responsive during trending markets and less sensitive during periods of consolidation, effectively filtering out market noise.
MACD Histogram Integration: The strategy incorporates the MACD histogram, a momentum indicator that measures the difference between a fast and a slow exponential moving average (EMA). By adding the MACD histogram values to the KAMA, the strategy creates a new line—the momentum-adaptive moving average (MOMA)—which captures both trend direction and momentum.
Signal Generation:
Long Entry: The strategy enters a long position when the closing price crosses above the MOMA. This indicates a potential upward momentum shift.
Exit Position: The position is closed when the closing price crosses below the MOMA, signaling a potential decline in momentum.
Cloud Calculation Detail
The MOMA is calculated by adding the MACD histogram value to the KAMA of the price. This addition effectively adjusts the KAMA based on the momentum indicated by the MACD histogram. When momentum is strong, the MACD histogram will have higher values, causing the MOMA to adjust accordingly and provide earlier entry or exit signals.
Performance on Stocks
This strategy has demonstrated excellent performance on stocks when applied to the 1-hour timeframe. Its adaptive nature allows it to respond swiftly to market changes, capturing profitable trends while minimizing the impact of false signals caused by market noise. The combination of KAMA's adaptability and MACD's momentum detection makes it particularly effective in volatile market conditions commonly seen in stock trading.
Key Parameters
KAMA Length (malen): Determines the sensitivity of the KAMA. A length of 100 is used to balance responsiveness with noise reduction.
MACD Fast Length (fast): Sets the period for the fast EMA in the MACD calculation. A value of 24 helps in capturing short-term momentum changes.
MACD Slow Length (slow): Sets the period for the slow EMA in the MACD calculation. A value of 52 smooths out longer-term trends.
MACD Signal Length (signal): Determines the period for the signal line in the MACD calculation. An 18-period signal line is used for timely crossovers.
Advantages of the Strategy
Adaptive to Market Conditions: By adjusting to both volatility and momentum, the strategy remains effective across different market phases.
Enhanced Signal Accuracy: The fusion of KAMA and MACD reduces false signals, improving the accuracy of trade entries and exits.
Simplicity in Execution: With straightforward entry and exit rules based on price crossovers, the strategy is user-friendly for traders at all experience levels

T3 JMA KAMA VWMAEnhancing Trading Performance with T3 JMA KAMA VWMA Indicator
Introduction
In the dynamic world of trading, staying ahead of market trends and capitalizing on volume-driven opportunities can greatly influence trading performance. To address this, we have developed the T3 JMA KAMA VWMA Indicator, an innovative tool that modifies the traditional Volume Weighted Moving Average (VWMA) formula to increase responsiveness and exploit high-volume market conditions for optimal position entry. This article delves into the idea behind this modification and how it can benefit traders seeking to gain an edge in the market.
The Idea Behind the Modification
The core concept behind modifying the VWMA formula is to leverage more responsive moving averages (MAs) that align with high-volume market activity. Traditional VWMA utilizes the Simple Moving Average (SMA) as the basis for calculating the weighted average. While the SMA is effective in providing a smoothed perspective of price movements, it may lack the desired responsiveness to capitalize on short-term volume-driven opportunities.
To address this limitation, our T3 JMA KAMA VWMA Indicator incorporates three advanced moving averages: T3, JMA, and KAMA. These MAs offer enhanced responsiveness, allowing traders to react swiftly to changing market conditions influenced by volume.
T3 (T3 New and T3 Normal):
The T3 moving average, one of the components of our indicator, applies a proprietary algorithm that provides smoother and more responsive trend signals. By utilizing T3, we ensure that the VWMA calculation aligns with the dynamic nature of high-volume markets, enabling traders to capture price movements accurately.
JMA (Jurik Moving Average):
The JMA component further enhances the indicator's responsiveness by incorporating phase shifting and power adjustment. This adaptive approach ensures that the moving average remains sensitive to changes in volume and price dynamics. As a result, traders can identify turning points and anticipate potential trend reversals, precisely timing their position entries.
KAMA (Kaufman's Adaptive Moving Average):
KAMA is an adaptive moving average designed to dynamically adjust its sensitivity based on market conditions. By incorporating KAMA into our VWMA modification, we ensure that the moving average adapts to varying volume levels and captures the essence of volume-driven price movements. Traders can confidently enter positions during periods of high trading volume, aligning their strategies with market activity.
Benefits and Usage
The modified T3 JMA KAMA VWMA Indicator offers several advantages to traders looking to exploit high-volume market conditions for position entry:
Increased Responsiveness: By incorporating more responsive moving averages, the indicator enables traders to react quickly to changes in volume and capture short-term opportunities more effectively.
Enhanced Entry Timing: The modified VWMA aligns with high-volume periods, allowing traders to enter positions precisely during price movements influenced by significant trading activity.
Improved Accuracy: The combination of T3, JMA, and KAMA within the VWMA formula enhances the accuracy of trend identification, reversals, and overall market analysis.
Comprehensive Market Insights: The T3 JMA KAMA VWMA Indicator provides a holistic view of market conditions by considering both price and volume dynamics. This comprehensive perspective helps traders make informed decisions.
Analysis and Interpretation
The modified VWMA formula with T3, JMA, and KAMA offers traders a valuable tool for analyzing volume-driven market conditions. By incorporating these advanced moving averages into the VWMA calculation, the indicator becomes more responsive to changes in volume, potentially providing deeper insights into price movements.
When analyzing the modified VWMA, it is essential to consider the following points:
Identifying High-Volume Periods:
The modified VWMA is designed to capture price movements during high-volume periods. Traders can use this indicator to identify potential market trends and determine whether significant trading activity is driving price action. By focusing on these periods, traders may gain a better understanding of the market sentiment and adjust their strategies accordingly.
Confirmation of Trend Strength:
The modified VWMA can serve as a confirmation tool for assessing the strength of a trend. When the VWMA line aligns with the overall trend direction, it suggests that the current price movement is supported by volume. This confirmation can provide traders with additional confidence in their analysis and help them make more informed trading decisions.
Potential Entry and Exit Points:
One of the primary purposes of the modified VWMA is to assist traders in identifying potential entry and exit points. By capturing volume-driven price movements, the indicator can highlight areas where market participants are actively participating, indicating potential opportunities for opening or closing positions. Traders can use this information in conjunction with other technical analysis tools to develop comprehensive trading strategies.
Interpretation of Angle and Gradient:
The modified VWMA incorporates an angle calculation and color gradient to further enhance interpretation. The angle of the VWMA line represents the slope of the indicator, providing insights into the momentum of price movements. A steep angle indicates strong momentum, while a shallow angle suggests a slowdown. The color gradient helps visualize this angle, with green indicating bullish momentum and purple indicating bearish momentum.
Conclusion
By modifying the VWMA formula to incorporate the T3, JMA, and KAMA moving averages, the T3 JMA KAMA VWMA Indicator offers traders an innovative tool to exploit high-volume market conditions for optimal position entry. This modification enhances responsiveness, improves timing, and provides comprehensive market insights.
Enjoy checking it out!
---
Credits to:
◾ @cheatcountry – Hann Window Smoothing
◾ @loxx – T3
◾ @everget – JMA

Powered Kaufman Adaptive Moving AverageIntroduction
The ability the Kaufman adaptive moving average (KAMA) has to be flat during ranging markets and close to the price during trending markets is what make this moving average one of the most useful in technical analysis. KAMA is calculated by using exponential averaging using the efficiency ratio (ER) as smoothing variable where 1 > ER > 0 . An increasing efficiency ratio indicate a trending market. Based on one of my latest indicator (see Kaufman Adaptive Bands) i propose this modified KAMA that allow to emphasis the abilities of KAMA by powering the efficiency ratio. I also added a new option that allow for even more adaptivity.
The Indicator
The indicator is a simple KAMA of period length that use a powered ER with exponent factor .
When factor = 1 the indicator is a simple KAMA, however when factor > 1 there can be more emphasis on the flattening effect of KAMA.
You can also restrain this effect by using 1 > factor > 0
Note that when the exponent is lower than 1 and greater than 0 you are basically applying a nth square root to the value, for example pow(2,0.5) = sqrt(2) because 1/0.5 = 2, in our case :
pow(ER,factor > 1) < ER and pow(ER,1 > factor > 0) > ER
Self Powered P-KAMA
When the self powered option is checked you are basically powering ER with the reciprocal of ER as exponent, however factor does no longer change anything. This can give interesting results since the exponent depend on the market trend strength.
In orange the self powered KAMA of period length = 50 and in blue a basic powered KAMA with a factor of 3 and a period of length = 50.
Conclusion
Applying basic math to indicators is always fun and easy to do, if you have adaptive moving averages using exponential averaging try powering your smoothing variable in order to see interesting results. I hope you like this indicator. Thanks for reading !

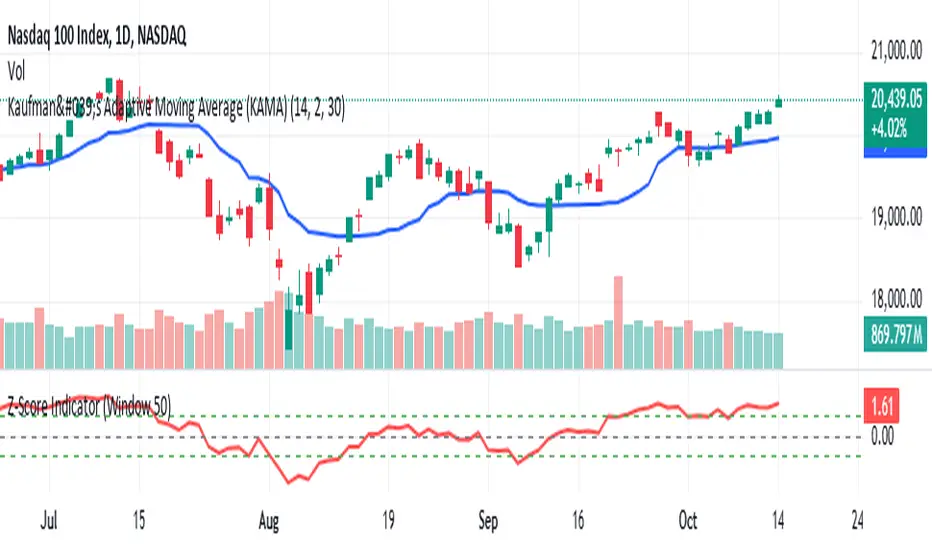
Kaufman's Adaptive Moving Average (KAMA)Another simple easy to use indicator that incorporates mean reversion and trend following.
Kaufman's Adaptive Moving Average (KAMA) is an indicator developed by Perry Kaufman that adjusts its sensitivity based on market volatility. It is designed to react more quickly during trending markets and slow down in sideways or volatile markets. The primary idea is that in a trending market, the moving average should be more sensitive to price changes, while in a non-trending market, it should be less responsive to noise.
KAMA Formula
The formula for the Kaufman Adaptive Moving Average is:
Efficiency Ratio (ER): Measures the efficiency of price movement over a given period.
ER
=
Smoothing Factor
Volatility
=
Sum of absolute price change
Sum of absolute price movement
ER=
Volatility
Smoothing Factor
=
Sum of absolute price movement
Sum of absolute price change
The Efficiency Ratio is calculated by taking the price change over a defined period and dividing it by the total price movement (which is the sum of absolute price changes).
Smoothing Constant (SC): This is a factor used to adjust the moving average's responsiveness:
SC
=
ER
×
(
2
/
(
𝑛
+
1
)
)
+
(
1
−
ER
)
×
(
2
/
(
𝑛
+
1
)
)
SC=ER×(2/(n+1))+(1−ER)×(2/(n+1))
where n is the length of the moving average period.
Steps to Calculate KAMA:
Efficiency Ratio (ER):
Calculate the sum of absolute price changes over the chosen period.
Calculate the sum of absolute price movements over the same period.
Smoothing Constant (SC):
Use the Efficiency Ratio to adjust the smoothing factor.
KAMA Calculation:
The initial KAMA is the simple moving average (SMA) of the first n periods.
For subsequent periods, KAMA is calculated using a formula based on the smoothing constant and previous KAMA values.
experiment with the variables as you like!!
Kaufman Adaptive BandsIntroduction
Bands are quite efficient in technical analysis, they can provide support and resistance levels, provide breakouts points, trailing stop loss/take profits positions and can show the current market volatility to the user. Most of the time bands are made from a central tendency estimator like a moving average plus/minus a volatility indicator. Therefore bands can be made out of pretty much everything thus allowing for any kind of flavors.
So i propose a band indicator made from a Kaufman adaptive moving average using an estimate of the standard deviation.
Construction
The Kaufman moving average is an exponential averager using the efficiency ratio as smoothing variable, length control the period of kama and in order to provide more smoothness a power parameter has been introduced, higher values of power will return smoother results.
The volatility indicator is made from a biased estimation of the standard deviation by using the square root of the mean of the square minus the square of the mean method, except that we use kama instead of a mean.
The bands are made by adding/subtracting this volatility indicator with kama.
How To Use
The ability of the indicator to adapt to the current market state is what makes him a great tool for avoiding major exposition during ranging market, therefore the indicator will have a greater motion during trending market, or more simply the bands will move during trending markets while staying "flat" during ranging ones. Therefore the indicator might be more suited to breakouts, even if some cases will return what where turning points, this is particularly true during ranging markets.
Of course the efficiency ratio is not an "unbiased" trend metric indicator, it can consider high volatility markets as trending markets. Its one of his downsides.
High values of power will create smoother bands.
When using a low power parameter use an higher mult. In general using a low power value will make the bands move more freely as well as making them closer to each others.
Conclusion
At least the indicator is really nice to the eyes when using high power values, its ability to adapt to the market is a great addition to other more classical bands indicators, i also introduced a volatility estimator based on kama, some might have used the following estimation : kama(abs(price - kama)) which would have created a slower result. A trailing stop might be made from it if i see request about such addition.
If you are curious here are some more images of the indicator performing on different markets. Thanks for reading !

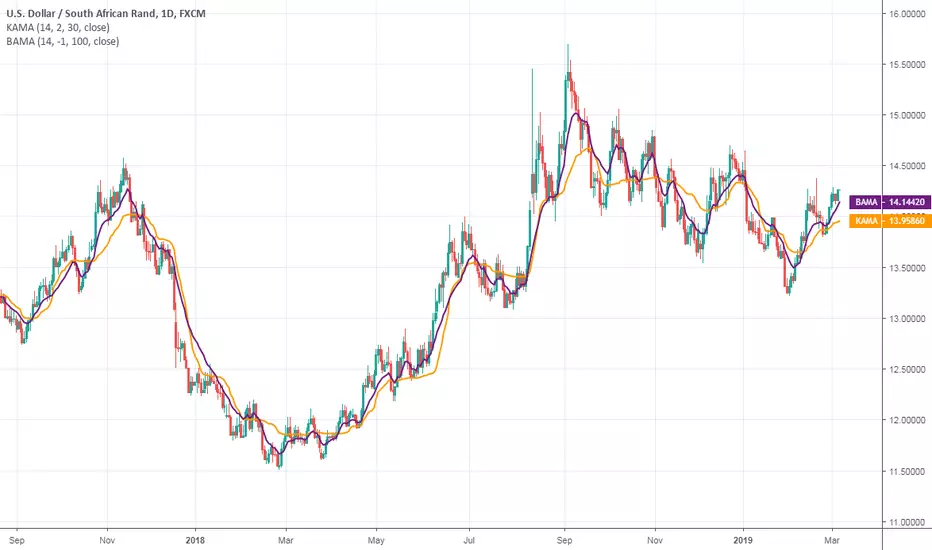
Bryant Adaptive Moving Average@ChartArt got my attention to this idea.
This type of moving average was originally developed by Michael R. Bryant (Adaptrade Software newsletter, April 2014). Mr. Bryant suggested a new approach, so called Variable Efficiency Ratio (VER), to obtain adaptive behaviour for the moving average. This approach is based on Perry Kaufman' idea with Efficiency Ratio (ER) which was used by Mr. Kaufman to create KAMA.
As result Mr. Bryant got a moving average with adaptive lookback period. This moving average has 3 parameters:
Initial lookback
Trend Parameter
Maximum lookback
The 2nd parameter, Trend Parameter can take any positive or negative value and determines whether the lookback length will increase or decrease with increasing ER.
Changing Trend Parameter we can obtain KAMA' behaviour
To learn more see www.adaptrade.com
MA Study: Different Types and More [NeoButane]A study of moving averages that utilizes different tricks I've learned to optimize them. Included is Bollinger Bands, Guppy (GMMA) and Super Guppy.
The method used to make it MtF should be more precise and smoother than regular MtF methods that use the security function. For intraday timeframes, each number represents each hour, with 24 equal to 1 day. For daily, 3 is 3 day, for weekly, 4 is the 4 weekly, etc. If you're on a higher timeframe than the one selected, the length will not change.
Log-space is used to make calculations work on many cryptos. The rules for color changing Guppy is changed to make it not as choppy on MAs other than EMA. Note that length does not affect SWMA and VWAP and source does not affect VWAP.
A short summary of each moving average can be found here: medium.com
List of included MAs:
ALMA: Arnaud Legoux
Double EMA
EMA: Exponential
Hull MA
KAMA: Kaufman Adaptive
Linear Regression Curve
LSMA: Least Squares
SMA: Simple
SMMA/RMA: Smoothed/Running
SWMA: Symm. Weighted
TMA: Triangular
Triple EMA
VWMA: Volume Weighted
WMA: Weighted
ZLEMA: Zero Lag
VWAP: Vol Weighted Average
Welles Wilder MA

Adaptive Rebound Line (ARL)The Adaptive Rebound Line (ARL) focuses on the rebound of price action according to the trend.
While it does not focus on showing the trend, it does help in anticipating price rebounds.
It achieves this by adapting quickly and by reducing lag.
It is recommended to use this with a trend-identifying indicator.
It was inspired by the Hull Moving Average and the KAMA.
Additional indicator show in the chart is Tide Finder Plus .

Anchored Powered KAMA [LuxAlgo]The Anchored Powered KAMA tool is a new flavor of the famous Kaufman's Adaptive Moving Average (KAMA).
It adds 5 different anchoring periods, a power exponent to the original KAMA calculation to increase the degree of filtering during ranging trends, and standard deviation bands calculated against the KAMA itself.
🔶 USAGE
In the image above we can see the different parts of the tool, it displays the Anchored Powered KAMA surrounded by standard deviation bands at 2x (solid) and 1x (dashed) by default.
This tool provides a simple and easy way to determine if the current market is ranging or trending and where the market extremes are in the current period.
As a rule of thumb, traders may want to trade extremes in ranges and pullbacks in trends.
When the KAMA is flat, a range is in place, so traders may want to wait for the price to reach an extreme before opening a trade in the other direction.
Conversely, if the KAMA is moving up or down, a trend is in place and traders may want to wait for the price to pull back to the KAMA before opening a trade in the direction of the trend.
🔹 Anchor Period
On the above chart, we can see different anchor periods on different chart timeframes.
This option is very useful for those traders who use multi-timeframe analysis, allowing them to see how the market behaves over different timeframes.
The valid values for this parameter are:
Hourly
Daily
Weekly
Monthly
Yearly
The tool has a built-in Auto feature for traders convenience, it automatically selects the optimal Anchor Period in function of the chart timeframe.
timeframes up to 2m: Hourly
timeframes up to 15m: Daily
timeframes up to 1H: Weekly
timeframes up to 4H: Monthly
larger timeframes: Yearly
🔹 Choosing the Right Anchor Period
In the chart above we can see the custom error message that the tool displays when the Auto feature is disabled and the Anchor Period is too large for the current chart timeframe.
Traders can select a smaller Anchor Period or a larger chart timeframe for the tool to display correctly.
🔶 DETAILS
The tool uses Welford's algorithm to calculate the KAMA's standard deviation, then plots the outer bands at the multiplier specified in the settings panel, and the inner bands at the multiplier specified minus 1.
🔹 Power Exponent
The graph above shows how different values of this parameter can affect the output.
To display the original KAMA a value of 1 must be set, by default this parameter is set to 2.
The higher the value, the better the tool's ability to detect ranges.
🔶 SETTINGS
Anchor Period: Select up to 5 different time periods from Hourly, Daily, Weekly, Monthly, and Yearly.
Source: Choose the source for all calculations.
Power Exponent: Fine-tune the KAMA calculation, a value of 1 will output the original KAMA, and is set to 2 by default.
Band Multiplier: Select the multiplier for the standard deviation bands.

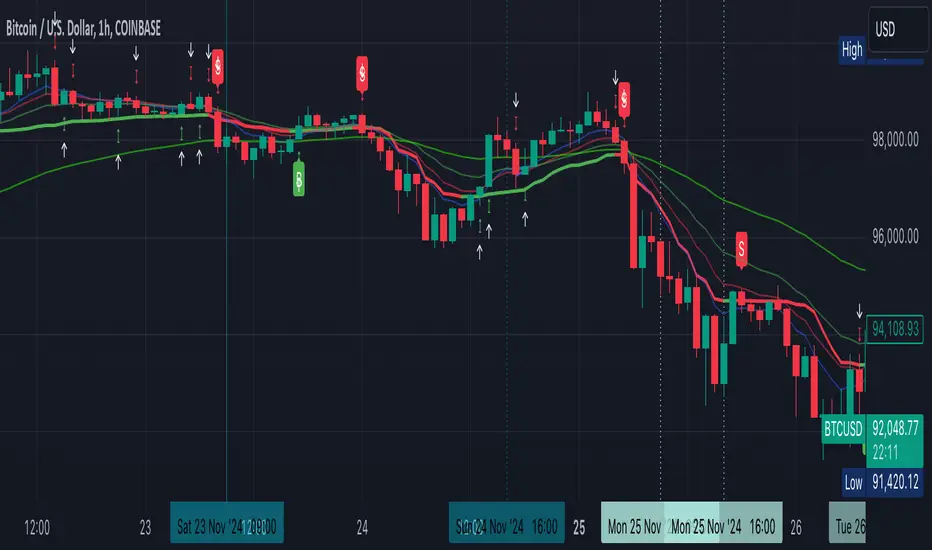
Enhanced Kaufman Adaptive Moving Average (KAMA) with Bollinger B# Enhanced Kaufman Adaptive Moving Average (KAMA) with Bollinger Bands
## Overview
This indicator combines the Kaufman Adaptive Moving Average (KAMA) with Bollinger Bands to create a comprehensive trading system. It provides adaptive trend following capabilities while measuring market volatility and potential reversal points.
## Key Features
- Adaptive moving average that adjusts to market conditions
- Dynamic Bollinger Bands for volatility measurement
- Color-coded KAMA line indicating trend direction
- Integrated buy/sell signals based on multiple confirmations
- Customizable parameters for both KAMA and Bollinger Bands
- Optional bar confirmation wait feature
- Built-in alert conditions for trade signals
## Main Components
### 1. Kaufman Adaptive Moving Average (KAMA)
- Adapts to market volatility using an efficiency ratio
- Changes color based on trend direction (green for uptrend, red for downtrend)
- Adjustable parameters for fine-tuning:
- Base Length: Controls the main calculation period (default: 10)
- Fast EMA Length: For rapid market response (default: 2)
- Slow EMA Length: For stable market conditions (default: 30)
### 2. Bollinger Bands
- Standard deviation-based volatility bands
- Customizable length and standard deviation multiplier
- Includes expansion threshold for volatility measurement
- Components:
- Upper Band: Upper volatility threshold
- Middle Band: Simple moving average
- Lower Band: Lower volatility threshold
## Signal Generation
### Buy Signals
Generated when:
1. KAMA color changes from red to green
2. Price closes above KAMA
3. Price closes above the middle Bollinger Band
4. Signals are marked with:
- Green triangles below the candles
- "B" labels for easy identification
### Sell Signals
Generated when:
1. KAMA color changes from green to red
2. Price closes below KAMA
3. Price closes below the middle Bollinger Band
4. Signals are marked with:
- Red triangles above the candles
- "S" labels for easy identification
## Customizable Parameters
### KAMA Settings
- Base Length (1-50)
- Fast EMA Length (1-10)
- Slow EMA Length (10-50)
- Source Price Selection
- Direction Highlight Toggle
- Bar Confirmation Option
### Bollinger Bands Settings
- Length (default: 20)
- Standard Deviation Multiplier (default: 2.0)
- Expansion Threshold (0.1-3.0)
## Alert Functionality
Built-in alerts for:
- Buy signals with customizable messages
- Sell signals with customizable messages
## Best Practices
### Timeframe Selection
- Works well on multiple timeframes
- Recommended for 15m to 4h charts for optimal signal generation
- Higher timeframes provide more reliable trend signals
### Parameter Optimization
- Adjust KAMA lengths based on trading style:
- Shorter lengths for day trading
- Longer lengths for swing trading
- Fine-tune BB multiplier based on market volatility
- Consider waiting for bar confirmation in volatile markets
### Risk Management
- Use in conjunction with other indicators for confirmation
- Consider market conditions and volatility when trading signals
- Implement proper position sizing and stop-loss levels
## Technical Notes
- Written in Pine Script™ v6
- Overlay indicator (displays on price chart)
- Compatible with all TradingView-supported markets
- Resource-efficient implementation for smooth performance
## Disclaimer
This indicator is provided under the Mozilla Public License 2.0. While it can be a valuable tool for technical analysis, it should not be used as the sole basis for trading decisions. Always combine with proper risk management and additional analysis methods.
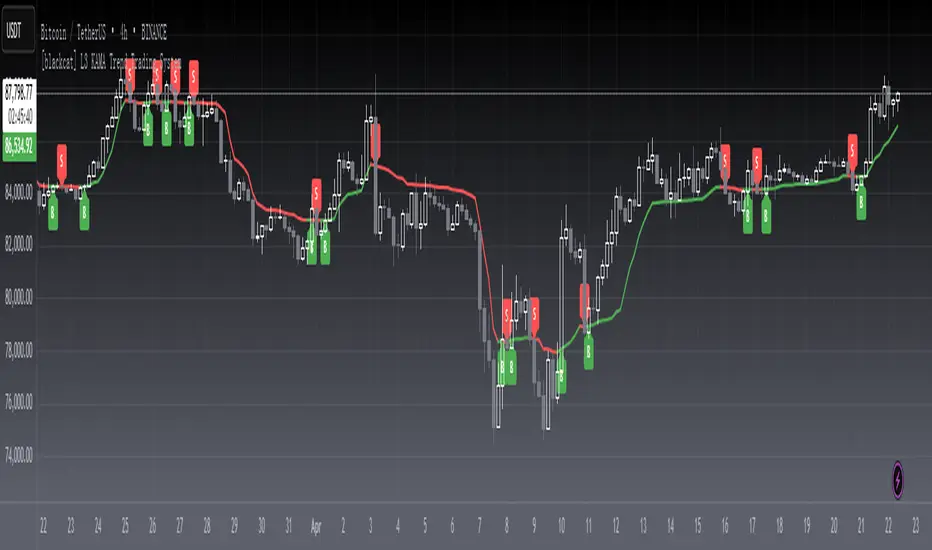
[blackcat] L3 KAMA Trend Trading SystemLevel: 3
Background
Kaufman’s Adaptive Moving Average ( KAMA ) was developed by American quantitative financial theorist Perry J. Kaufman in 1998.
Function
This is an improved KAMA trading system with my customized algorithm.You can use KAMA like any other trend-following indicator, such as a moving average. You can look for price crosses, directional changes and filtered signals. First, a cross above or below KAMA indicates directional changes in prices. As with any moving average, a simple crossover system will generate lots of signals and lots of whipsaws. Second, You can use the direction of KAMA to define the overall trend for a security. This may require a parameter adjustment to smooth the indicator further. You can change the fastline and slowline parameters to smooth KAMA and look for directional changes. The trend is down as long as KAMA is falling and forging lower lows. The trend is up as long as KAMA is rising and forging higher highs. Finally, You can combine signals and techniques. You can use a longer-term KAMA to define the bigger trend and a shorter-term KAMA for trading signals.
I have included in the indicator an input named "EnableSmooth" that allows you to determine if the KAMA line should be smoothed or not. A "True" as the input value smoothes the calculation. An "False" simply plots the raw KAMA line. When market volatility is low, Kaufman’s Adaptive Moving Average remains near the current market price, but when volatility increases, it will lag behind. What the KAMA indicator aims to do is filter out “market noise” – insignificant, temporary surges in price action. One of the primary weaknesses of traditional moving averages is that when used for trading signals, they tend to generate many false signals. The KAMA indicator seeks to lessen this tendency – generate fewer false signals – by not responding to short-term, insignificant price movements. Traders generally use the moving average indicator to identify market trends and reversals.
Remarks
Feedbacks are appreciated.