Trailing Monster StrategyTrailing Monster Strategy
This is an experimental trend-following strategy that incorporates a custom adaptive moving average (PKAMA), RSI-based momentum filtering, and dynamic trailing stop-loss logic. It is designed for educational and research purposes only, and may require further optimization or risk management considerations prior to live deployment.
Strategy Logic
The strategy attempts to participate in sustained price trends by combining:
- A Power Kaufman Adaptive Moving Average (PKAMA) for dynamic trend detection,
- RSI and Simple Moving Average (SMA) filters for market condition confirmation,
- A delayed trailing stop-loss to manage exits once a trade is in profit.
Entry Conditions
Long Entry:
- RSI exceeds the overbought threshold (default: 70),
- Price is trading above the 200-period SMA,
- PKAMA slope is positive (indicating upward momentum),
- A minimum number of bars have passed since the last entry.
Short Entry:
- RSI falls below the oversold threshold (default: 30),
- Price is trading below the 200-period SMA,
- PKAMA slope is negative (indicating downward momentum),
-A minimum number of bars have passed since the last entry.
Exit Conditions
- A trailing stop-loss is applied once the position has been open for a user-defined number of bars.
- The trailing distance is calculated as a fixed percentage of the average entry price.
Technical Notes
This script implements a custom version of the Power Kaufman Adaptive Moving Average (PKAMA), conceptually inspired by alexgrover’s public implementation on TradingView .
Unlike traditional moving averages, PKAMA dynamically adjusts its responsiveness based on recent market volatility, allowing it to better capture trend changes in fast-moving assets like altcoins.
Disclaimer
This strategy is provided for educational purposes only.
It is not financial advice, and no guarantee of profitability is implied.
Always conduct thorough backtesting and forward testing before using any strategy in a live environment.
Adjust inputs based on your individual risk tolerance, asset class, and trading style.
Feedback is encouraged. You are welcome to fork and modify this script to suit your own preferences and market approach.
Cerca negli script per "kama"

Litecoin Trailing-Stop StrategyAltcoins Trailing-Stop Strategy
This strategy is based on a momentum breakout approach using PKAMA (Powered Kaufman Adaptive Moving Average) as a trend filter, and a delayed trailing stop mechanism to manage risk effectively.
It has been designed and fine-tuned Altcoins, which historically shows consistent volatility patterns and clean trend structures, especially on intraday timeframes like 15m and 30m.
Strategy Logic:
Entry Conditions:
Long when PKAMA indicates an upward move
Short when PKAMA detects a downward trend
Minimum spacing of 30 bars between trades to avoid overtrading
Trailing Stop:
Activated only after a customizable delay (delayBars)
User can set trailing stop % and delay independently
Helps avoid premature exits due to short-term volatility
Customizable Parameters:
This strategy uses a custom implementation of PKAMA (Powered Kaufman Adaptive Moving Average), inspired by the work of alexgrover
PKAMA is a volatility-aware moving average that adjusts dynamically to market conditions, making it ideal for altcoins where trend strength and direction change frequently.
This script is for educational and experimental purposes only. It is not financial advice. Please test thoroughly before using it in live conditions, and always adapt parameters to your specific asset and time frame.
Feedback is welcome! Feel free to clone and adapt it for your own trading style.

twisted SMA strategy [4h] Hello
I would like to introduce a very simple strategy that uses a combination of 3 simple moving averages ( SMA 4 , SMA 9 , SMA 18 )
this is a classic combination showing the most probable trend directions
Crosses were marked on the basis of the color of the candles (bulish cross - blue / bearish cross - maroon)
ma 100 was used to determine the main trend, which is one of the most popular 4-hour candles
We define main trend while price crosses SMA100 ( for bullish trend I use green candle color )
The long position strategy was created in combination of 3 moving averages with Kaufman's adaptive moving average by alexgrover
The strategy is very accurate and is easy to use indicators
the strategy uses only Buy (Long) signals in a combination of crossovers of the SMA 4, SMA 9, SMA 18 and the Kaufman Adaptive Moving Average.
As a signal to close a long position, only the opposite signal of the intersection of 3 different moving averages is used
the current strategy is recommended for higher time zones (4h +) due to the strength of the closing candles, which translates into signal strength
works fascinatingly well for long-term bullish market assets (for example 4h Apple, Tesla charts)
Enjoy and trade safe ;)

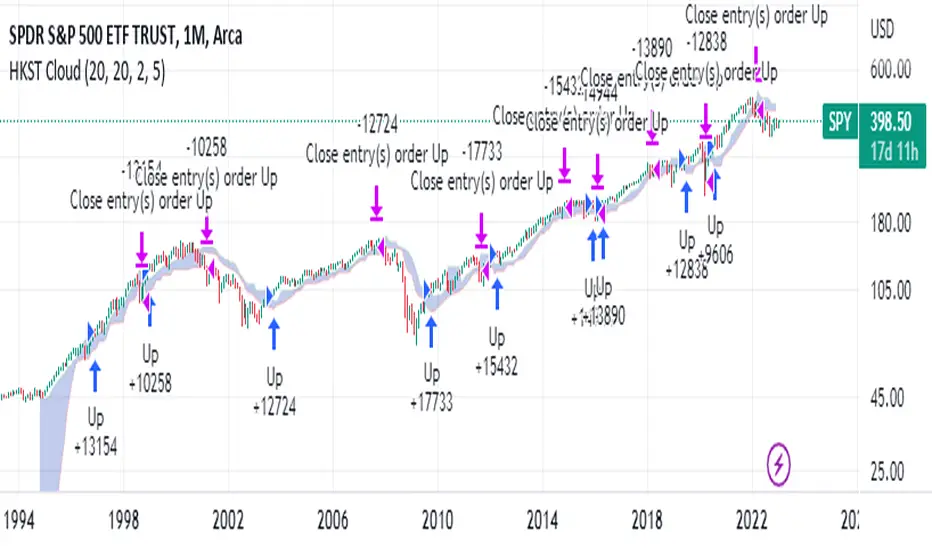
Hull Kaufman SuperTrend Cloud (HKST Cloud)TLDR: This is a long only trend following system that uses highest and lowest values of three trend following indicators to form a "cloud". Enter when the candle high crosses above the highest band. Close if the low or close crosses below the lowest band.
3 indicators
1. Kaufman Adaptive moving Average - set at 20
2. Hull Moving Average (of the Kaufman Adaptive moving average) - set at 20
3. SuperTrend - I believe this is set at 5 periods and 3*atr but this can be changed
Cloud
the upper band is the highest of the 3 indicators
the lower band is the lowest of the 3 indicators
Entry and Exit:
Enter when the high crosses above the upper band of the cloud.
(This means you will only get a long signal if the high was previously below the upper band of the cloud and then crosses over.)
Exit when the low crosses below the lower band of the cloud .
(This means that this rule will only close if the low was previously above the upper band and then crosses under)
The "Exit" may not trigger if the low (the wick) never gets above the band. In this case the long order will close if the closing price is below the cloud.
Logic
Kaufamn is the best moving average i have found at responding to changes in volatility. This means it moves up or down quickly during expansive moves but becoming very flat during relative choppiness. However, getting flat causes the the Kaufman AMA to trigger a lot of false signals when volatility is transitioning from high to low. This is why the Hull moving average (with its rounded turns) keeps a lot of the false continuations contained because usually prices need to decisively move higher in order to over come the Hull moving average which continues to increase/decrease during the candles after an expansive move.
The super trend places a stagnant floor and ceiling which acts as a great stoploss or trigger as price action attempts to trend in a certain direction. The super trend allows for the user to adjust the likely hood of this cloud indicator changing from bullish to bearish based on the volatility of the asset that is being analyzed.
individually all of these are great. Together the trader can use this cloud to create a trend following or anlysis system that captures the bulk of moves.
Not my best explanation but this indicator is actually pretty simple.
Hope this helps. Happy Trades
-Snarky Puppy
ER-Adaptive ATR [Loxx]Average True Range (ATR) is widely used indicator in many occasions for technical analysis. It is calculated as the RMA of true range. This version adds a "twist": it uses Perry Kaufman's Efficiency Ratio to calculate adaptive true range
You can use this indicator the same way you'd use the standard ATR.

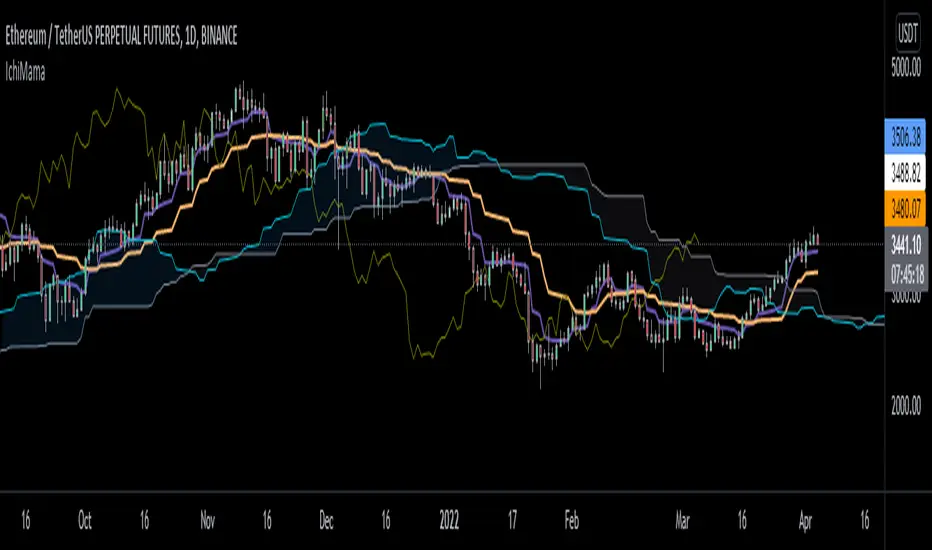
IchiMAMA (Experimental)Goichi Hosoda's "Ichimoku Kinkō Hyō" is a widely used Trend Following indicator and can be defined as a "system" rather than an indicator.
Published in the late 1960's, consisting of 5 lines.
TenkanSen (Conversion Line) = of the last 9 bars
KijunSen (Base Line) = of the last 26 bars
SenkouSpanA (Leading Span A) = Average of Tenkan&KijunSen shifted -> 26 bars
SenkouSpanB (Leading Span B) = of the last 52 bars
ChikouSpan (Lagging Span) = Price shifted <- 26 bars
On the other hand, Mesa Adaptive Moving Average developed by John Ehlers around early 2000's shows similarities with Hosoda's Tenkan and KijunSen using a different calculation method. For futher info: www.mesasoftware.com
I find MAMA superior to TenkanSen and KijunSen in terms of crossing signals.
Ichimoku:
Thus, decided to replace TenkanSen and KijunSen of regular Ichimoku with MAMA&FAMA of Ehlers and calculated SenkouSpanA accordingly. SenkouSpanB and ChikouSpan stays the same as per Ichimoku's logic. (Periods are 30 by default for cryptocurrencies. If stocks then 26)
IchiMAMA:
This is purely experimental and educational. Hope you'll like it :)
I'd like to thank @everget for MAMA&FAMA
and @KivancOzbilgic for Ichimoku Kinkō Hyō and Volume Based Colored Bars
Advance AMA with Sylvain BandsMany traders believe that the moving averages are favorite tools and analysts have spent decades trying to improve moving averages partiularly the simple moving average. One way to address the disadvantages of moving averages is to multiply the weighting factor by a volatility ratio which is called Adaptive moving averages.
This indicator uses an special adaptive moving averages which is developed by John Ehlers. The model adapts to price movement “based on the rate change of phase as measured by the Hilbert Transform Discriminator”. This method of adaptation features a fast and a slow moving average so that the composite moving average swiftly responds to price changes and holds the average value until the next bars close. In addition, the smoothed Volatility Bands were created by Sylvain Vervoort is included.

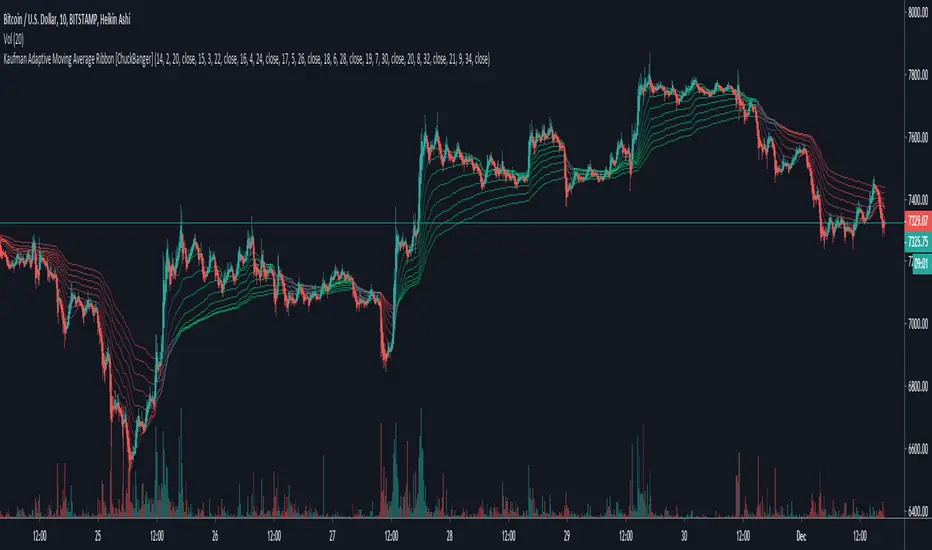
Kaufman Adaptive Moving Average Ribbon [ChuckBanger]Kaufman Adaptive Moving Average is one of the best moving averages in my opinion. So I made a ribbon script out of it. Good luck traders :)
Kama and HMA trend followerThis strategy is meant to be used to follow trending markets. Use of other methodologies to define or anticipatetrends will greatly enhance profits. Enjoy!

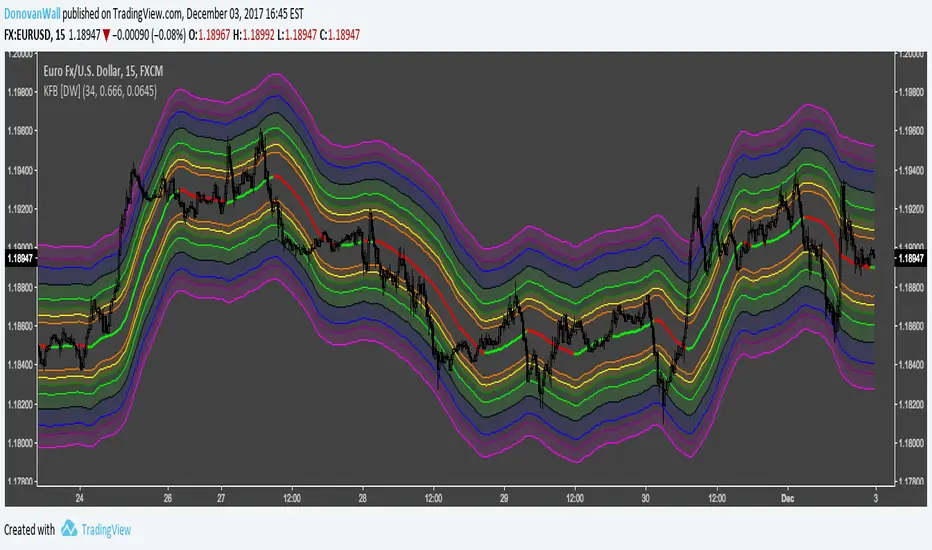
KAMA Fibonacci Bands [DW]This study is an experimental combination of the Kaufman Adaptive Moving Average with ATR and Fibonacci percentages.
Kaufman's Adaptive Moving Average BandsKaufman's Adaptive Moving Average with 6 Bands at a time and trend direction.

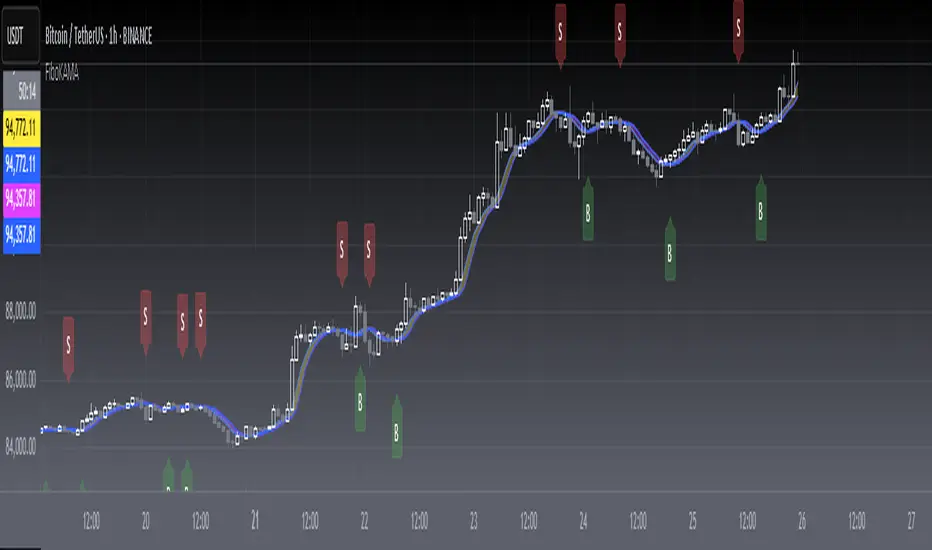
[blackcat] L2 FiboKAMA Adaptive TrendOVERVIEW
The L2 FiboKAMA Adaptive Trend indicator leverages advanced technical analysis techniques by integrating Fibonacci principles with the Kaufman Adaptive Moving Average (KAMA). This combination creates a dynamic and responsive tool designed to adapt seamlessly to changing market conditions. By providing clear buy and sell signals based on adaptive momentum, this indicator helps traders identify potential entry and exit points effectively. Its intuitive design and robust features make it a valuable addition to any trader’s arsenal 📊💹.
According to the principle of Kaufman's Adaptive Moving Average (KAMA), it is a type of moving average line specifically designed for markets with high volatility. Unlike traditional moving averages, KAMA can automatically adjust its period based on market conditions to improve accuracy and responsiveness. This makes it particularly useful for capturing market trends and reducing false signals in varying market environments.
The use of Fibonacci magic numbers (3, 8, 13) enhances the performance and accuracy of KAMA. These numbers have special mathematical properties that align well with the changing trends of KAMA moving averages. Combining them with KAMA can significantly boost its effectiveness, making it a popular choice among traders seeking reliable signals.
This fusion not only smoothens price fluctuations but also ensures quick responses to market changes, offering dependable entry and exit points. Thanks to the flexibility and precision of KAMA combined with Fibonacci magic numbers, traders can better manage risks and aim for higher returns.
FEATURES
Enhanced Kaufman Adaptive Moving Average (KAMA): Incorporates Fibonacci principles for improved adaptability:
Source Price: Allows customization of the price series used for calculation (default: HLCC4).
Fast Length: Determines the period for quicker adjustments to recent price changes.
Slow Length: Sets the period for smoother transitions over longer-term trends.
Dynamic Lines:
KAMA Line: A yellow line representing the primary adaptive moving average, which adapts quickly to new trends.
Trigger Line: A fuchsia line serving as a reference point for detecting crossovers and generating signals.
Visual Cues:
Buy Signals: Green 'B' labels indicating potential buying opportunities.
Sell Signals: Red 'S' labels signaling possible selling points.
Fill Areas: Colored regions between the KAMA and Trigger lines to visually represent trend directions and strength.
Alert Functionality: Generates real-time alerts for both buy and sell signals, ensuring timely notifications for actionable insights 🔔.
Customizable Parameters: Offers flexibility through adjustable inputs, allowing users to tailor the indicator to their specific trading strategies and preferences.
HOW TO USE
Adding the Indicator:
Open your TradingView chart and navigate to the indicators list.
Select L2 FiboKAMA Adaptive Trend and add it to your chart.
Configuring Parameters:
Adjust the Source Price to choose the desired price series (e.g., close, open, high, low).
Set the Fast Length to define how quickly the indicator responds to recent price movements.
Configure the Slow Length to determine the smoothness of long-term trend adaptations.
Interpreting Signals:
Monitor the chart for green 'B' labels indicating buy signals and red 'S' labels for sell signals.
Observe the colored fill areas between the KAMA and Trigger lines to gauge trend strength and direction.
Setting Up Alerts:
Enable alerts within the indicator settings to receive notifications whenever buy or sell signals are triggered.
Customize alert messages and frequencies according to your trading plan.
Combining with Other Tools:
Integrate this indicator with additional technical analysis tools and fundamental research for comprehensive decision-making.
Confirm signals using other indicators like RSI, MACD, or Bollinger Bands for increased reliability.
Optimizing Performance:
Backtest the indicator across various assets and timeframes to understand its behavior under different market conditions.
Fine-tune parameters based on historical performance and current market dynamics.
Integrating Magic Numbers:
Understand the basic principles of KAMA to find suitable entry points for Fibonacci magic numbers.
Utilize the efficiency ratio to measure market volatility and adjust moving average parameters accordingly.
Apply Fibonacci magic numbers (3, 8, 13) to enhance the responsiveness and accuracy of KAMA.
LIMITATIONS
Market Volatility: May produce false signals during periods of extreme volatility or sideways movement.
Parameter Sensitivity: Requires careful tuning of fast and slow lengths to balance responsiveness and stability.
Asset-Specific Behavior: Effectiveness can vary significantly across different financial instruments and time horizons.
Complementary Analysis: Should be used alongside other analytical methods to enhance accuracy and reduce risk.
NOTES
Historical Data: Ensure adequate historical data availability for precise calculations and backtesting.
Demo Testing: Thoroughly test the indicator on demo accounts before deploying it in live trading environments.
Continuous Learning: Stay updated with market trends and continuously refine your strategy incorporating feedback from the indicator's performance.
Risk Management: Always implement proper risk management practices regardless of the signals provided by the indicator.
ADVANCED USAGE TIPS
Multi-Timeframe Analysis: Apply the indicator across multiple timeframes to gain deeper insights into underlying trends.
Divergence Strategy: Look for divergences between price action and the KAMA line to spot potential reversals early.
Volume Integration: Combine volume analysis with the indicator to confirm the strength of identified trends.
Custom Scripting: Modify the script to include additional filters or conditions tailored to your unique trading approach.
IMPROVING KAMA PERFORMANCE
Increase Length: Extend the KAMA length to consider more historical data, reducing the impact of short-term price fluctuations.
Adjust Fast and Slow Lengths: Make KAMA smoother by increasing the fast length and decreasing the slow length.
Use Smoothing Factor: Apply a smoothing factor to control the level of smoothness; typical values range from 0 to 1.
Combine with Other Indicators: Pair KAMA with other smoothing indicators like EMA or SMA for more reliable signals.
Filter Noise: Use filters or other technical analysis tools to eliminate price noise, enhancing KAMA's effectiveness.
MyMovingAveragesLibraryLibrary "MyMovingAveragesLibrary"
alma(src, lkbk, alma_offset, alma_sigma)
ALMA - Arnaud Legoux Moving Average
Parameters:
src (float) : float
lkbk (int) : int
alma_offset (simple float)
alma_sigma (simple float) : float
Returns: moving average
frama(src, lkbk, FC, SC)
FRAMA - Fractal Adaptive Moving Average
Parameters:
src (float) : float
lkbk (int) : int
FC (int) : int
SC (int) : int
Returns: moving average
kama(src, lkbk, kamafastend, kamaslowend)
KAMA - Kaufman Adaptive Moving Average
Parameters:
src (float) : float
lkbk (int) : int
kamafastend (int) : int
kamaslowend (int) : int
Returns: moving average
ema(src, lkbk)
EMA - Exponential Moving Average
Parameters:
src (float) : float
lkbk (simple int) : int
Returns: moving average
dema(src, lkbk)
DEMA - Double Exponential Moving Average
Parameters:
src (float) : float
lkbk (simple int) : int
Returns: moving average
tema(src, lkbk)
TEMA - Triple Exponential Moving Average
Parameters:
src (float) : float
lkbk (simple int) : int
Returns: moving average
hma(src, lkbk)
HMA - Hull Moving Average
Parameters:
src (float) : float
lkbk (simple int) : int
Returns: moving average
jma(src, lkbk, jurik_power, jurik_phase)
JMA - Jurik Moving Average
Parameters:
src (float) : float
lkbk (int) : int
jurik_power (int)
jurik_phase (float)
Returns: moving average
laguerre(src, alpha)
Laguerre Filter
Parameters:
src (float) : float
alpha (float) : float
Returns: moving average
lsma(src, lkbk, lsma_offset)
LSMA - Least Squares Moving Average
Parameters:
src (float) : float
lkbk (simple int) : int
lsma_offset (simple int) : int
Returns: moving average
mcginley(src, lkbk)
McGinley Dynamic
Parameters:
src (float) : float
lkbk (simple int) : int
Returns: moving average
mf(src, lkbk, mf_feedback, mf_beta, mf_z)
Modular Filter
Parameters:
src (float) : float
lkbk (int) : int
mf_feedback (bool) : float
mf_beta (float) : boolean
mf_z (float) : float
Returns: moving average
rdma(src)
RDMA - RexDog Moving Average (RDA, as he calls it)
Parameters:
src (float) : flot
Returns: moving average
sma(src, lkbk)
SMA - Simple Moving Average
Parameters:
src (float) : float
lkbk (int) : int
Returns: moving average
smma(src, lkbk)
SMMA - Smoothed Moving Average (known as RMA in TradingView)
Parameters:
src (float) : float
lkbk (simple int) : int
Returns: moving average
t3(src, lkbk)
T3 Moving Average
Parameters:
src (float) : float
lkbk (simple int) : int
Returns: moving average
tma(src, lkbk)
TMA - Triangular Moving Average
Parameters:
src (float) : float
lkbk (simple int) : int
Returns: moving average
vama(src, lkbk, vol_lkbk)
VAMA - Volatility-Adjusted Moving Average
Parameters:
src (float) : float
lkbk (simple int) : int
vol_lkbk (int) : int
vwma(src, lkbk)
VWMA - Volume-Weighted Moving Average
Parameters:
src (float) : float
lkbk (simple int) : int
Returns: moving average
mf_zlagma(src, lkbk)
Zero-Lag Moving Average
Parameters:
src (float) : float
lkbk (int) : int
Returns: moving average
loxxmas - moving averages used in Loxx's indis & stratsLibrary "loxxmas"
TODO:loxx moving averages used in indicators
kama(src, len, kamafastend, kamaslowend)
KAMA Kaufman adaptive moving average
Parameters:
src : float
len : int
kamafastend : int
kamaslowend : int
Returns: array
ama(src, len, fl, sl)
AMA, adaptive moving average
Parameters:
src : float
len : int
fl : int
sl : int
Returns: array
t3(src, len)
T3 moving average, adaptive moving average
Parameters:
src : float
len : int
Returns: array
adxvma(src, len)
ADXvma - Average Directional Volatility Moving Average
Parameters:
src : float
len : int
Returns: array
ahrma(src, len)
Ahrens Moving Average
Parameters:
src : float
len : int
Returns: array
alxma(src, len)
Alexander Moving Average - ALXMA
Parameters:
src : float
len : int
Returns: array
dema(src, len)
Double Exponential Moving Average - DEMA
Parameters:
src : float
len : int
Returns: array
dsema(src, len)
Double Smoothed Exponential Moving Average - DSEMA
Parameters:
src : float
len : int
Returns: array
ema(src, len)
Exponential Moving Average - EMA
Parameters:
src : float
len : int
Returns: array
fema(src, len)
Fast Exponential Moving Average - FEMA
Parameters:
src : float
len : int
Returns: array
hma(src, len)
Hull moving averge
Parameters:
src : float
len : int
Returns: array
ie2(src, len)
Early T3 by Tim Tilson
Parameters:
src : float
len : int
Returns: array
frama(src, len, FC, SC)
Fractal Adaptive Moving Average - FRAMA
Parameters:
src : float
len : int
FC : int
SC : int
Returns: array
instant(src, float)
Instantaneous Trendline
Parameters:
src : float
float : alpha
Returns: array
ilrs(src, int)
Integral of Linear Regression Slope - ILRS
Parameters:
src : float
int : len
Returns: array
laguerre(src, float)
Laguerre Filter
Parameters:
src : float
float : alpha
Returns: array
leader(src, int)
Leader Exponential Moving Average
Parameters:
src : float
int : len
Returns: array
lsma(src, int, int)
Linear Regression Value - LSMA (Least Squares Moving Average)
Parameters:
src : float
int : len
int : offset
Returns: array
lwma(src, int)
Linear Weighted Moving Average - LWMA
Parameters:
src : float
int : len
Returns: array
mcginley(src, int)
McGinley Dynamic
Parameters:
src : float
int : len
Returns: array
mcNicholl(src, int)
McNicholl EMA
Parameters:
src : float
int : len
Returns: array
nonlagma(src, int)
Non-lag moving average
Parameters:
src : float
int : len
Returns: array
pwma(src, int, float)
Parabolic Weighted Moving Average
Parameters:
src : float
int : len
float : pwr
Returns: array
rmta(src, int)
Recursive Moving Trendline
Parameters:
src : float
int : len
Returns: array
decycler(src, int)
Simple decycler - SDEC
Parameters:
src : float
int : len
Returns: array
sma(src, int)
Simple Moving Average
Parameters:
src : float
int : len
Returns: array
swma(src, int)
Sine Weighted Moving Average
Parameters:
src : float
int : len
Returns: array
slwma(src, int)
linear weighted moving average
Parameters:
src : float
int : len
Returns: array
smma(src, int)
Smoothed Moving Average - SMMA
Parameters:
src : float
int : len
Returns: array
super(src, int)
Ehlers super smoother
Parameters:
src : float
int : len
Returns: array
smoother(src, int)
Smoother filter
Parameters:
src : float
int : len
Returns: array
tma(src, int)
Triangular moving average - TMA
Parameters:
src : float
int : len
Returns: array
tema(src, int)
Tripple exponential moving average - TEMA
Parameters:
src : float
int : len
Returns: array
vwema(src, int)
Volume weighted ema - VEMA
Parameters:
src : float
int : len
Returns: array
vwma(src, int)
Volume weighted moving average - VWMA
Parameters:
src : float
int : len
Returns: array
zlagdema(src, int)
Zero-lag dema
Parameters:
src : float
int : len
Returns: array
zlagma(src, int)
Zero-lag moving average
Parameters:
src : float
int : len
Returns: array
zlagtema(src, int)
Zero-lag tema
Parameters:
src : float
int : len
Returns: array
threepolebuttfilt(src, int)
Three-pole Ehlers Butterworth
Parameters:
src : float
int : len
Returns: array
threepolesss(src, int)
Three-pole Ehlers smoother
Parameters:
src : float
int : len
Returns: array
twopolebutter(src, int)
Two-pole Ehlers Butterworth
Parameters:
src : float
int : len
Returns: array
twopoless(src, int)
Two-pole Ehlers smoother
Parameters:
src : float
int : len
Returns: array
Heiken Ashi MTF Monitor - Better Formula - EMA, AMA, KAFA, T3Heiken Ashi MTF Monitor - Better Formula - EMA, AMA, KAFA, T3
This indicator is based on the works of Loxx & Smart_Money-Trader, without their initial codes, none of this will be possible.
This Pine Script indicator provides a multi-timeframe (MTF) analysis of Heiken Ashi trends, designed to enhance the traditional Heiken Ashi method with advanced smoothing techniques such as the Exponential Moving Average (EMA), Adaptive Moving Average (AMA), Kaufman’s Adaptive Moving Average (KAMA), and the Triple Exponential Moving Average (T3). The indicator offers a flexible approach to identify bullish, bearish, and neutral trends across six customizable timeframes and various Heiken Ashi calculation methods.
Key Features:
Multi-Timeframe (MTF) Support: The indicator allows you to monitor trends across six timeframes (e.g., 2-hour, 4-hour, daily, weekly, monthly), giving a holistic view of market conditions at different scales.
Heiken Ashi Calculation Methods: Choose between traditional Heiken Ashi or an enhanced "Better HA" method for more refined trend analysis.
Smoothing Options: Apply different smoothing techniques, including EMA, T3, KAMA, or AMA, to the Heiken Ashi values for smoother, more reliable trend signals.
Non-Repaint Option: This feature ensures that the values do not repaint after the bar closes, providing a more reliable historical view.
Customizable Plotting: The indicator offers full customization of which timeframes to display and whether to show labels for each timeframe.
Inputs and Settings:
Timeframe Inputs:
Users can set up to six different timeframes, ranging from intraday (2-hour, 4-hour) to higher timeframes (daily, weekly, monthly).
Timeframes can be enabled or disabled individually for each analysis.
Label Visibility:
Labels indicating the trend direction (bullish, bearish, neutral) can be shown for each timeframe. This helps with clarity when monitoring multiple timeframes simultaneously.
Smoothing Options:
EMA: Exponential Moving Average for standard smoothing.
AMA: Adaptive Moving Average, which adapts its smoothing based on market volatility.
KAMA: Kaufman’s Adaptive Moving Average, which adjusts its sensitivity to price fluctuations.
T3: Triple Exponential Moving Average, providing a smoother and more responsive moving average.
None: No smoothing applied (for raw Heiken Ashi calculations).
Non-Repaint Setting:
Enabling this ensures the trend values do not change after the bar closes, offering a stable historical view of trends.
Core Functions:
Heiken Ashi Calculations:
Traditional HA: The classic Heiken Ashi calculation is used here, where each bar's open, close, high, and low are computed based on the average price of the previous bar.
Better HA: A refined calculation method, where the raw Heiken Ashi close is adjusted by considering the price range. This smoother value is then optionally processed through a moving average function for further smoothing.
Heiken Ashi Trend Calculation:
Based on the selected Heiken Ashi method (Traditional or Better HA), the indicator checks whether the trend is bullish (upward movement), bearish (downward movement), or neutral (sideways movement).
For the "Better HA" method, the trend determination uses the difference between the smoothed Heiken Ashi close and open.
Moving Averages:
The moving averages applied to the Heiken Ashi values are configurable:
EMA: Standard smoothing with an exponential weighting.
T3: A triple exponential smoothing technique that provides a smoother moving average.
KAMA: An adaptive smoothing technique that adjusts to market noise.
AMA: An adaptive moving average that reacts to market volatility, making it more flexible.
None: For raw, unsmoothed Heiken Ashi data.
Trend Detection:
The indicator evaluates the direction of the trend for each timeframe and assigns a color-coded value (bearish, bullish, or neutral).
The trend values are plotted as circles, and their color reflects the detected trend: red for bearish, green for bullish, and white for neutral.
Multi-Timeframe (MTF) Support:
The indicator can be used to analyze up to six different timeframes simultaneously.
The trend for each timeframe is calculated and displayed as circles on the chart.
Users can enable or disable individual timeframes, allowing for a customizable view based on which timeframes they are interested in monitoring.
Plotting:
The indicator plots circles at specific levels based on the detected trend (Level 1 for the 2-hour timeframe, Level 2 for the 4-hour timeframe, etc.). The size and color of these circles represent the trend direction.
These plotted values provide a quick visual reference for trend direction across multiple timeframes.
Usage:
Trend Confirmation: By monitoring trends across multiple timeframes, traders can use this indicator to confirm trends and avoid false signals.
Customizable Timeframe Analysis: Traders can focus on shorter timeframes for intraday trades or look at longer timeframes for a broader market perspective.
Smoothing for Clarity: By applying various moving average techniques, traders can reduce noise and get a clearer view of the trend.
Non-Repainting: The non-repaint option ensures the indicator values remain consistent even after the bar closes, providing more reliable signals for backtesting or live trading.
This Heiken Ashi MTF Monitor indicator with better formulas and smoothing options is designed for traders who want to analyze trends across multiple timeframes while benefiting from advanced moving averages and more refined Heiken Ashi calculations. The customizable settings for smoothing, timeframe selection, and label visibility allow users to tailor the indicator to their specific needs and trading style.

ZERO LAG TRADE SIGNALS by BootcampZeroThe ZERO LAG TRADE SIGNALS by BootcampZero indicator is a versatile tool designed to help traders identify optimal entry and exit points for both short-term scalping and long-term trading across multiple time frames. It combines several well-known technical analysis methods, including moving averages, trend analysis, directional indicators, and adaptive trend calculations, to deliver reliable buy and sell signals.
Short-Term Scalping (Under 5-Minute Time Frames)
For short-term traders who prefer quick trades on lower time frames, such as under 5 minutes, this indicator uses a combination of the EMA (Exponential Moving Average) and SMA (Simple Moving Average) to spot fast trend reversals. The indicator is particularly useful for scalpers because it focuses on detecting short-term price momentum by comparing the faster-moving averages with slower ones, triggering signals based on their crossover.
Buy Signals are generated when a fast-moving EMA crosses above a slower-moving SMA, indicating upward momentum.
Sell Signals are triggered when the fast-moving EMA crosses below the slower-moving SMA, signaling potential downward price movement.
In addition, the Adaptive Trend Finder feature dynamically adjusts to recent price deviations and volatility, making it easier for scalpers to spot the prevailing short-term trend with high confidence. The indicator also uses ADX (Average Directional Index) for momentum confirmation, ensuring that signals are only generated during strong price trends, reducing false positives in sideways markets.
Long-Term Trading (Above 1-Day Charts)
When applied to higher time frames such as daily charts or above, this indicator excels in generating reliable long-term buy and sell signals, perfect for swing traders and long-term investors. The Kaufman Adaptive Moving Average (KAMA) and the Ichimoku Cloud are used to assess long-term trends by filtering out market noise and focusing on sustainable price direction.
KAMA helps to adapt the moving average based on market volatility, providing smoother signals that minimize whipsawing in longer-term trades.
Ichimoku Cloud provides additional trend confirmation by identifying whether the market is bullish or bearish based on the relationship between key lines like the Tenkan-Sen (Conversion Line) and Kijun-Sen (Base Line), and how the current price interacts with the Ichimoku Cloud itself.
The indicator also integrates PPO (Percentage Price Oscillator) to capture divergences between price and momentum, further supporting traders in holding positions for extended periods when the signal strength is robust.
Key Technical Values and Factors for Signals
EMA and SMA Crossover: Fast EMA vs. Slow SMA to detect short-term trend reversals.
ADX: Helps gauge the strength of the trend; signals are only generated in trending markets.
KAMA: Filters noise in long-term trends, providing smooth signals based on market volatility.
Ichimoku Cloud: Offers insight into long-term trends and momentum by analyzing price relative to the cloud.
PPO: Detects divergences between price and momentum for trend continuation or reversal signals.
How It Works
Buy signals are generated when bullish conditions are met, and the indicator confirms momentum with ADX, crossover of the EMAs, or a bullish breakout from the Ichimoku Cloud.
Sell signals are triggered when bearish conditions prevail, confirmed by the same factors in reverse, such as a bearish EMA crossover or weakness in ADX.
By combining these powerful tools, ZERO LAG TRADE SIGNALS by BootcampZero offers traders a comprehensive system for both quick scalping trades and more conservative long-term positioning, providing reliable and adaptive signals across different market conditions.
Stochastic Fusion Elite [trade_lexx]📈 Stochastic Fusion Elite is your reliable trading assistant!
📊 What is Stochastic Fusion Elite ?
Stochastic Fusion Elite is a trading indicator based on a stochastic oscillator. It analyzes the rate of price change and generates buy or sell signals based on various technical analysis methods.
💡 The main components of the indicator
📊 Stochastic oscillator (K and D)
Stochastic shows the position of the current price relative to the price range for a certain period. Values above 80 indicate overbought (an early sale is possible), and values below 20 indicate oversold (an early purchase is possible).
📈 Moving Averages (MA)
The indicator uses 10 different types of moving averages to smooth stochastic lines.:
- SMA: Simple moving average
- EMA: Exponential moving average
- WMA: Weighted moving average
- HMA: Moving Average Scale
- KAMA: Kaufman Adaptive Moving Average
- VWMA: Volume-weighted moving average
- ALMA: Arnaud Legoux Moving Average
- TEMA: Triple exponential moving average
- ZLEMA: zero delay exponential moving average
- DEMA: Double exponential moving average
The choice of the type of moving average affects the speed of the indicator's response to market changes.
🎯 Bollinger Bands (BB)
Bands around the moving average that widen and narrow depending on volatility. They help determine when the stochastic is out of the normal range.
🔄 Divergences
Divergences show discrepancies between price and stochastic:
- Bullish divergence: price is falling and stochastic is rising — an upward reversal is possible
- Bearish divergence: the price is rising, and stochastic is falling — a downward reversal is possible
🔍 Indicator signals
1️⃣ KD signals (K and D stochastic lines)
- Buy signal:
- What happens: the %K line crosses the %D line from bottom to top
- What does it look like: a green triangle with the label "KD" under the chart and the label "Buy" below the bar
- What does this mean: the price is gaining an upward momentum, growth is possible
- Sell signal:
- What happens: the %K line crosses the %D line from top to bottom
- What it looks like: a red triangle with the label "KD" above the chart and the label "Sell" above the bar
- What does this mean: the price is losing its upward momentum, possibly falling
2️⃣ Moving Average Signals (MA)
- Buy Signal:
- What happens: stochastic crosses the moving average from bottom to top
- What it looks like: a green triangle with the label "MA" under the chart and the label "Buy" below the bar
- What does this mean: stochastic is starting to accelerate upward, price growth is possible
- Sell signal:
- What happens: stochastic crosses the moving average from top to bottom
- What it looks like: a red triangle with the label "MA" above the chart and the label "Sell" above the bar
- What does this mean: stochastic is starting to accelerate downwards, a price drop is possible
3️⃣ Bollinger Band Signals (BB)
- Buy signal:
- What happens: stochastic crosses the lower Bollinger band from bottom to top
- What it looks like: a green triangle with the label "BB" under the chart and the label "Buy" below the bar
- What does this mean: stochastic was too low and is now starting to recover
- Sell signal:
- What happens: Stochastic crosses the upper Bollinger band from top to bottom
- What it looks like: a red triangle with a "BB" label above the chart and a "Sell" label above the bar
- What does this mean: stochastic was too high and is now starting to decline
4️⃣ Divergence Signals (Div)
- Buy Signal (Bullish Divergence):
- What's happening: the price is falling, and stochastic is forming higher lows
- What it looks like: a green triangle with a "Div" label under the chart and a "Buy" label below the bar
- What does this mean: despite the falling price, the momentum is already changing in an upward direction
- Sell signal (bearish divergence):
- What's going on: the price is rising, and stochastic is forming lower highs
- What it looks like: a red triangle with a "Div" label above the chart and a "Sell" label above the bar
- What does this mean: despite the price increase, the momentum is already weakening
🛠️ Filters to filter out false signals
1️⃣ Minimum distance between the signals
- What it does: sets the minimum number of candles between signals
- Why it is needed: prevents signals from being too frequent during strong market fluctuations
- How to set it up: Set the number from 0 and above (default: 5)
2️⃣ "Waiting for the opposite signal" mode
- What it does: waits for a signal in the opposite direction before generating a new signal
- Why you need it: it helps you not to miss important trend reversals
- How to set up: just turn the function on or off
3️⃣ Filter by stochastic levels
- What it does: generates signals only when the stochastic is in the specified ranges
- Why it is needed: it helps to catch the moments when the market is oversold or overbought
- How to set up:
- For buy signals: set a range for oversold (for example, 1-20)
- For sell signals: set a range for overbought (for example, 80-100)
4️⃣ MFI filter
- What it does: additionally checks the values of the cash flow index (MFI)
- Why it is needed: confirms stochastic signals with cash flow data
- How to set it up:
- For buy signals: set the range for oversold MFI (for example, 1-25)
- For sell signals: set the range for overbought MFI (for example, 75-100)
5️⃣ The RSI filter
- What it does: additionally checks the RSI values to confirm the signals
- Why it is needed: adds additional confirmation from another popular indicator
- How to set up:
- For buy signals: set the range for oversold MFI (for example, 1-30)
- For sell signals: set the range for overbought MFI (for example, 70-100)
🔄 Signal combination modes
1️⃣ Normal mode
- How it works: all signals (KD, MA, BB, Div) work independently of each other
- When to use it: for general market analysis or when learning how to work with the indicator
2️⃣ "AND" Mode ("AND Mode")
- How it works: the alarm appears only when several conditions are triggered simultaneously
- Combination options:
- KD+MA: signals from the KD and moving average lines
- KD+BB: signals from KD lines and Bollinger bands
- KD+Div: signals from the KD and divergence lines
- KD+MA+BB: three signals simultaneously
- KD+MA+Div: three signals at the same time
- KD+BB+Div: three signals at the same time
- KD+MA+BB+Div: all four signals at the same time
- When to use: for more reliable but rare signals
🔌 Connecting to trading strategies
The indicator can be connected to your trading strategies using 6 different channels.:
1. Connector KD signals: connects only the signals from the intersection of lines K and D
2. Connector MA signals: connects only signals from moving averages
3. Connector BB signal: connects only the signals from the Bollinger bands
4. Connector divergence signals: connects only divergence signals
5. Combined Connector: connects any signals
6. Connector for "And" mode: connects only combined signals
🔔 Setting up alerts
The indicator can send alerts when alarms appear.:
- Alerts for KD: when the %K line crosses the %D line
- Alerts for MA: when stochastic crosses the moving average
- Alerts for BB: when stochastic crosses the Bollinger bands
- Divergence alerts: when a divergence is detected
- Combined alerts: for all types of alarms
- Alerts for "And" mode: for combined signals
🎭 What does the indicator look like on the chart ?
- Main lines K and D: blue and orange lines
- Overbought/oversold levels: horizontal lines at levels 20 and 80
- Middle line: dotted line at level 50
- Stochastic Moving Average: yellow line
- Bollinger bands: green lines around the moving average
- Signals: green and red triangles with corresponding labels
📚 How to start using Stochastic Fusion Elite
1️⃣ Initial setup
- Add an indicator to your chart
- Select the types of signals you want to use (KD, MA, BB, Div)
- Adjust the period and smoothing for the K and D lines
2️⃣ Filter settings
- Set the distance between the signals to get rid of unnecessary noise
- Adjust stochastic, MFI and RSI levels depending on the volatility of your asset
- If you need more reliable signals, turn on the "Waiting for the opposite signal" mode.
3️⃣ Operation mode selection
- First, use the standard mode to see all possible signals.
- When you get comfortable, try the "And" mode for rarer signals.
4️⃣ Setting up Alerts
- Select the types of signals you want to be notified about
- Set up alerts for these types of signals
5️⃣ Verification and adaptation
- Check the operation of the indicator on historical data
- Adjust the parameters for a specific asset
- Adapt the settings to your trading style
🌟 Usage examples
For trend trading
- Use the KD and MA signals in the direction of the main trend
- Set the distance between the signals
- Set stricter levels for filters
For trading in a sideways range
- Use BB signals to detect bounces from the range boundaries
- Use a stochastic level filter to confirm overbought/oversold conditions
- Adjust the Bollinger bands according to the width of the range
To determine the pivot points
- Pay attention to the divergence signals
- Set the distance between the signals
- Check the MFI and RSI filters for additional confirmation

Moving Average Ribbon [TheBearFighter]
This code was written using:
•Pine Script Coding Conventions.
This script provides a very useful tool for new community users and professionals. It puts at your disposal a Moving Average Ribbon by hand to graph and easily find the ones with the highest performance. The creation of this script was motivated because in free TradingView accounts there is a limit of 3 indicators by chart, and with this tool you can draw up to 32 MA's at the same time!
Choose one of 10 types of MA´s:
•KAMA Kaufman's moving average.
•HULL Hull moving average.
•TEMA Triple exponencial moving average.
•LSMA Least square moving average.
•DEMA Double exponencial moving average.
•ALMA Arnaud Legoux moving average.
•WMA Weighted moving average
•EMA Exponencial moving average.
•VWMA Volume Weighted moving average.
•SMA Simple moving average.
Use the tooltips to know the lengths of MA´s.
A main characteristic of the script is that the lengths are in days but when changing the lowest timeframes, the same daily resolution is maintained. This gives us extreme precision in intraday timeframes, e.g 30 minutes.
Once this is understood, we can turning the MA´s on/off, and changing the timeframe to our liking.
Available timeframes: M, W, D, 4H, 1H, 30m, 15m, 5m.
Also the MA´s are colored for easy visualization and know if they grow or decrease.
Thank´s to @midtownsk8rguy to let me know more about HEX colors.
Thank´s to @HPotter for his KAMA.

Ultimate Volatility CloudUltimate Volatility Cloud
The Ultimate Volatility Cloud is a powerful and highly customizable indicator designed to help traders visualize market volatility, easily identify trend, and overextended moves in price with adaptive bands. It combines the strengths of the Arnaud Legoux Moving Average, Kaufman's Adaptive Moving Average, ATR Channels, and Standard Deviation bands, offering multiple pre-configured profiles and extensive customization options.
Key Features:
Dynamic Volatility Bands: The indicator plots multiple layers of volatility bands around a central basis line, providing a comprehensive view of price deviation.
Hybrid Band Calculation: Bands are a sophisticated blend of Keltner Channels, KAMA ATR Channels and Standard Deviation, allowing for a nuanced representation of volatility.
Adaptive Smoothing: Bands are smoothed using either Exponential Moving Average (EMA) or Kaufman's Adaptive Moving Average (KAMA) based on the selected profile, ensuring responsiveness tailored to market conditions.
Layered Fills: The cloud uses distinct color fills for different volatility levels, making it easy to visually interpret price action relative to its typical range.
Customizable Color Themes: Choose from a variety of pre-set color themes, including "Rainbow," "Wild," and "Monochrome," or stick with classic options to suit your visual preference.
Optional Basis Line Plots: Display the EMA or KAMA basis lines (used in Keltner Channel calculations) separately on the chart for additional analysis.
Understanding the Profiles:
The indicator comes with several pre-configured "Settings Profiles" that adjust the internal parameters (Keltner Channel/KAMA Channel/Standard Deviation band blend, and band smoothing) to suit different trading styles or market environments.
1. Standard Profile:
Blend: 60% Keltner Channel, 40% Standard Deviation.
Smoothing: EMA smoothing of 3 periods.
Purpose: A balanced, general-purpose profile suitable for a wide range of market conditions. It offers a good blend of trend following and volatility awareness.
2. Responsive Profile:
Blend: 40% Keltner Channel, 60% Standard Deviation.
Smoothing: EMA smoothing of 2 period.
Purpose: Designed for traders who need quick reactions to price changes. The higher Standard Deviation blend and minimal smoothing make it highly sensitive to immediate volatility shifts, ideal for short-term analysis or identifying early moves.
3. Ranging Market Profile:
Blend: 80% KAMA ATR Channel, 20% Standard Deviation.
Smoothing: KAMA smoothing.
Purpose: Optimized for sideways or consolidating markets. By utilizing KAMA-based ATR bands and KAMA for band smoothing, this profile adapts its responsiveness to reduce whipsaws in choppy conditions, providing clearer boundaries for range-bound price action.
4. Trend Following Profile:
Blend: 90% Keltner Channel, 10% Standard Deviation.
Smoothing: EMA smoothing of 5 periods.
Purpose: Tailored for riding strong trends. The heavy emphasis on the Keltner Channel and slightly smoother bands help filter out minor fluctuations, allowing traders to focus on the dominant directional movement.
5. Conservative Profile:
Blend: 65% KAMA ATR Channel, 35% Standard Deviation.
Smoothing: EMA smoothing of 10 periods.
Purpose: Aims to provide more filtered signals and reduce noise. The KAMA basis for the Keltner Channel combined with a longer EMA smoothing period offers a slower, more confirmed view of volatility, suitable for traders seeking higher conviction entries or exits.
Example of the Ranging Market Profile
How to Use:
The volatility cloud can be interpreted in various ways:
Price within the inner bands: May indicate consolidation or a period of lower volatility.
Price pushing into outer bands: Suggests increasing volatility and potential for a strong move.
Price breaking out of extreme outer bands: Can signal significant momentum and the start or continuation of a strong trend.
Cloud expansion/contraction: Visually indicates periods of increasing or decreasing market energy.
Experiment with different profiles and settings to find the combination that best suits your trading strategy and the instruments you trade.

Correlation Table by VanHelsingCorrelation Table by VanHelsing
Explanation:
So we have three asset with correlation to current asset which is a BTC, also you can use it for ETH
But why only three assets? Because this one fits the best to identify a trend of BTC.
By using let's say a GOLD this table will be far away from accuracy then this three Nasdaq, ES1!(S&P500), DXY the best one for this.
Inside a script we have kama's
(Developed by Perry Kaufman, Kaufman's Adaptive Moving Average (KAMA) is a moving average designed to account for market noise or volatility. KAMA will closely follow prices when the price swings are relatively small and the noise is low. KAMA will adjust when the price swings widen and follow prices from a greater distance. This trend-following indicator can be used to identify the overall trend, time turning points and filter price movements.)
Now you know that KAMA is good solution for fast reaction of trend change and following it.
Now we have three assets with correlation to BTC and three kama's for them to know which trend is there.
Good!
What next?
Next is a scoring for up trend and down trend for BTC
For Understanding I will use DXY and BTC correlation
Lets consider that DXY is moving down and kama detected it,
we have down trend on DXY. How we can score it for BTC buy or sell?
Down trend DXY and negaive correlation to BTC lets say -0.5
In this way it scoring it like 0.5 for buy BTC, because if DXY moving down it means BTC moving up because of negative correlation.
Lets say DXY moving up and correlation with BTC is again -0.5
then what? It scoring -0.5 for sell BTC because since DXY moves up and correlation is negative BTC should move down.
Okay again what if DXY moving up and correlation is positive 0.5?
Then BTC is 0.5 for buy
What if DXY down correlation 0.5? Then BTC score for sell is -0.5
In first look it seems litle bit complicated, but actually it is not, it just take a time for understand. Hope you Enjoy this lesson and hope you will enjoy this indicator!
How to read a table:
Describtion about minimalistic mode

Adaptive Trend Classification: Moving Averages [InvestorUnknown]Adaptive Trend Classification: Moving Averages
Overview
The Adaptive Trend Classification (ATC) Moving Averages indicator is a robust and adaptable investing tool designed to provide dynamic signals based on various types of moving averages and their lengths. This indicator incorporates multiple layers of adaptability to enhance its effectiveness in various market conditions.
Key Features
Adaptability of Moving Average Types and Lengths: The indicator utilizes different types of moving averages (EMA, HMA, WMA, DEMA, LSMA, KAMA) with customizable lengths to adjust to market conditions.
Dynamic Weighting Based on Performance: ] Weights are assigned to each moving average based on the equity they generate, with considerations for a cutout period and decay rate to manage (reduce) the influence of past performances.
Exponential Growth Adjustment: The influence of recent performance is enhanced through an adjustable exponential growth factor, ensuring that more recent data has a greater impact on the signal.
Calibration Mode: Allows users to fine-tune the indicator settings for specific signal periods and backtesting, ensuring optimized performance.
Visualization Options: Multiple customization options for plotting moving averages, color bars, and signal arrows, enhancing the clarity of the visual output.
Alerts: Configurable alert settings to notify users based on specific moving average crossovers or the average signal.
User Inputs
Adaptability Settings
λ (Lambda): Specifies the growth rate for exponential growth calculations.
Decay (%): Determines the rate of depreciation applied to the equity over time.
CutOut Period: Sets the period after which equity calculations start, allowing for a focus on specific time ranges.
Robustness Lengths: Defines the range of robustness for equity calculation with options for Narrow, Medium, or Wide adjustments.
Long/Short Threshold: Sets thresholds for long and short signals.
Calculation Source: The data source used for calculations (e.g., close price).
Moving Averages Settings
Lengths and Weights: Allows customization of lengths and initial weights for each moving average type (EMA, HMA, WMA, DEMA, LSMA, KAMA).
Calibration Mode
Calibration Mode: Enables calibration for fine-tuning inputs.
Calibrate: Specifies which moving average type to calibrate.
Strategy View: Shifts entries and exits by one bar for non-repainting backtesting.
Calculation Logic
Rate of Change (R): Calculates the rate of change in the price.
Set of Moving Averages: Generates multiple moving averages with different lengths for each type.
diflen(length) =>
int L1 = na, int L_1 = na
int L2 = na, int L_2 = na
int L3 = na, int L_3 = na
int L4 = na, int L_4 = na
if robustness == "Narrow"
L1 := length + 1, L_1 := length - 1
L2 := length + 2, L_2 := length - 2
L3 := length + 3, L_3 := length - 3
L4 := length + 4, L_4 := length - 4
else if robustness == "Medium"
L1 := length + 1, L_1 := length - 1
L2 := length + 2, L_2 := length - 2
L3 := length + 4, L_3 := length - 4
L4 := length + 6, L_4 := length - 6
else
L1 := length + 1, L_1 := length - 1
L2 := length + 3, L_2 := length - 3
L3 := length + 5, L_3 := length - 5
L4 := length + 7, L_4 := length - 7
// Function to calculate different types of moving averages
ma_calculation(source, length, ma_type) =>
if ma_type == "EMA"
ta.ema(source, length)
else if ma_type == "HMA"
ta.sma(source, length)
else if ma_type == "WMA"
ta.wma(source, length)
else if ma_type == "DEMA"
ta.dema(source, length)
else if ma_type == "LSMA"
lsma(source,length)
else if ma_type == "KAMA"
kama(source, length)
else
na
// Function to create a set of moving averages with different lengths
SetOfMovingAverages(length, source, ma_type) =>
= diflen(length)
MA = ma_calculation(source, length, ma_type)
MA1 = ma_calculation(source, L1, ma_type)
MA2 = ma_calculation(source, L2, ma_type)
MA3 = ma_calculation(source, L3, ma_type)
MA4 = ma_calculation(source, L4, ma_type)
MA_1 = ma_calculation(source, L_1, ma_type)
MA_2 = ma_calculation(source, L_2, ma_type)
MA_3 = ma_calculation(source, L_3, ma_type)
MA_4 = ma_calculation(source, L_4, ma_type)
Exponential Growth Factor: Computes an exponential growth factor based on the current bar index and growth rate.
// The function `e(L)` calculates an exponential growth factor based on the current bar index and a given growth rate `L`.
e(L) =>
// Calculate the number of bars elapsed.
// If the `bar_index` is 0 (i.e., the very first bar), set `bars` to 1 to avoid division by zero.
bars = bar_index == 0 ? 1 : bar_index
// Define the cuttime time using the `cutout` parameter, which specifies how many bars will be cut out off the time series.
cuttime = time
// Initialize the exponential growth factor `x` to 1.0.
x = 1.0
// Check if `cuttime` is not `na` and the current time is greater than or equal to `cuttime`.
if not na(cuttime) and time >= cuttime
// Use the mathematical constant `e` raised to the power of `L * (bar_index - cutout)`.
// This represents exponential growth over the number of bars since the `cutout`.
x := math.pow(math.e, L * (bar_index - cutout))
x
Equity Calculation: Calculates the equity based on starting equity, signals, and the rate of change, incorporating a natural decay rate.
pine code
// This function calculates the equity based on the starting equity, signals, and rate of change (R).
eq(starting_equity, sig, R) =>
cuttime = time
if not na(cuttime) and time >= cuttime
// Calculate the rate of return `r` by multiplying the rate of change `R` with the exponential growth factor `e(La)`.
r = R * e(La)
// Calculate the depreciation factor `d` as 1 minus the depreciation rate `De`.
d = 1 - De
var float a = 0.0
// If the previous signal `sig ` is positive, set `a` to `r`.
if (sig > 0)
a := r
// If the previous signal `sig ` is negative, set `a` to `-r`.
else if (sig < 0)
a := -r
// Declare the variable `e` to store equity and initialize it to `na`.
var float e = na
// If `e ` (the previous equity value) is not available (first calculation):
if na(e )
e := starting_equity
else
// Update `e` based on the previous equity value, depreciation factor `d`, and adjustment factor `a`.
e := (e * d) * (1 + a)
// Ensure `e` does not drop below 0.25.
if (e < 0.25)
e := 0.25
e
else
na
Signal Generation: Generates signals based on crossovers and computes a weighted signal from multiple moving averages.
Main Calculations
The indicator calculates different moving averages (EMA, HMA, WMA, DEMA, LSMA, KAMA) and their respective signals, applies exponential growth and decay factors to compute equities, and then derives a final signal by averaging weighted signals from all moving averages.
Visualization and Alerts
The final signal, along with additional visual aids like color bars and arrows, is plotted on the chart. Users can also set up alerts based on specific conditions to receive notifications for potential trading opportunities.
Repainting
The indicator does support intra-bar changes of signal but will not repaint once the bar is closed, if you want to get alerts only for signals after bar close, turn on “Strategy View” while setting up the alert.
Conclusion
The Adaptive Trend Classification: Moving Averages Indicator is a sophisticated tool for investors, offering extensive customization and adaptability to changing market conditions. By integrating multiple moving averages and leveraging dynamic weighting based on performance, it aims to provide reliable and timely investing signals.

Quadruple Kaufman Adaptive Moving AverageFour Kaufman Adaptive Moving Averages in one script. Useful for identifying trends and setting points to add to positions / exit trades. KAMA's are great for keeping you in trending markets and avoiding sideways chops and ranges. Try them out by tweaking the fast/slow ma's and lengths to get the right set for your charts that removes the thinking about whether to be long or short and when to add to positions.
A suggested trading strategy is to tweak the ma's (often you'll want larger values) until they span the price action well on past trends. Then each time price action closes and crosses one of your KAMA lines is an opportunity to add to your position. Once all lines are cleared and you've loaded up your position, hopefully your average price of entry falls short of the highest KAMA line's value. Once this happens you don't need to get out the trade until such time as a price close crosses again that largest KAMA line. For eager profit takers, close positions once any KAMA line is crossed once you're successfully loaded up on a direction.
I use this script with a renko chart and values -> 26 length 6 fast ma 100 slow ma, 26 8 100, 26 10 100, 26 12 100 and it's good to see these moving averages, unlike regular moving averages, bend around choppy action that come when trends pause, keeping me successfully in winning trades. Give it a try.
CNTLibraryLibrary "CNTLibrary"
Custom Functions To Help Code In Pinescript V5
Coded By Christian Nataliano
First Coded In 10/06/2023
Last Edited In 22/06/2023
Huge Shout Out To © ZenAndTheArtOfTrading and his ZenLibrary V5, Some Of The Custom Functions Were Heavily Inspired By Matt's Work & His Pine Script Mastery Course
Another Shout Out To The TradingView's Team Library ta V5
//====================================================================================================================================================
// Custom Indicator Functions
//====================================================================================================================================================
GetKAMA(KAMA_lenght, Fast_KAMA, Slow_KAMA)
Calculates An Adaptive Moving Average Based On Perry J Kaufman's Calculations
Parameters:
KAMA_lenght (int) : Is The KAMA Lenght
Fast_KAMA (int) : Is The KAMA's Fastes Moving Average
Slow_KAMA (int) : Is The KAMA's Slowest Moving Average
Returns: Float Of The KAMA's Current Calculations
GetMovingAverage(Source, Lenght, Type)
Get Custom Moving Averages Values
Parameters:
Source (float) : Of The Moving Average, Defval = close
Lenght (simple int) : Of The Moving Average, Defval = 50
Type (string) : Of The Moving Average, Defval = Exponential Moving Average
Returns: The Moving Average Calculation Based On Its Given Source, Lenght & Calculation Type (Please Call Function On Global Scope)
GetDecimals()
Calculates how many decimals are on the quote price of the current market © ZenAndTheArtOfTrading
Returns: The current decimal places on the market quote price
Truncate(number, decimalPlaces)
Truncates (cuts) excess decimal places © ZenAndTheArtOfTrading
Parameters:
number (float)
decimalPlaces (simple float)
Returns: The given number truncated to the given decimalPlaces
ToWhole(number)
Converts pips into whole numbers © ZenAndTheArtOfTrading
Parameters:
number (float)
Returns: The converted number
ToPips(number)
Converts whole numbers back into pips © ZenAndTheArtOfTrading
Parameters:
number (float)
Returns: The converted number
GetPctChange(value1, value2, lookback)
Gets the percentage change between 2 float values over a given lookback period © ZenAndTheArtOfTrading
Parameters:
value1 (float)
value2 (float)
lookback (int)
BarsAboveMA(lookback, ma)
Counts how many candles are above the MA © ZenAndTheArtOfTrading
Parameters:
lookback (int)
ma (float)
Returns: The bar count of how many recent bars are above the MA
BarsBelowMA(lookback, ma)
Counts how many candles are below the MA © ZenAndTheArtOfTrading
Parameters:
lookback (int)
ma (float)
Returns: The bar count of how many recent bars are below the EMA
BarsCrossedMA(lookback, ma)
Counts how many times the EMA was crossed recently © ZenAndTheArtOfTrading
Parameters:
lookback (int)
ma (float)
Returns: The bar count of how many times price recently crossed the EMA
GetPullbackBarCount(lookback, direction)
Counts how many green & red bars have printed recently (ie. pullback count) © ZenAndTheArtOfTrading
Parameters:
lookback (int)
direction (int)
Returns: The bar count of how many candles have retraced over the given lookback & direction
GetSwingHigh(Lookback, SwingType)
Check If Price Has Made A Recent Swing High
Parameters:
Lookback (int) : Is For The Swing High Lookback Period, Defval = 7
SwingType (int) : Is For The Swing High Type Of Identification, Defval = 1
Returns: A Bool - True If Price Has Made A Recent Swing High
GetSwingLow(Lookback, SwingType)
Check If Price Has Made A Recent Swing Low
Parameters:
Lookback (int) : Is For The Swing Low Lookback Period, Defval = 7
SwingType (int) : Is For The Swing Low Type Of Identification, Defval = 1
Returns: A Bool - True If Price Has Made A Recent Swing Low
//====================================================================================================================================================
// Custom Risk Management Functions
//====================================================================================================================================================
CalculateStopLossLevel(OrderType, Entry, StopLoss)
Calculate StopLoss Level
Parameters:
OrderType (int) : Is To Determine A Long / Short Position, Defval = 1
Entry (float) : Is The Entry Level Of The Order, Defval = na
StopLoss (float) : Is The Custom StopLoss Distance, Defval = 2x ATR Below Close
Returns: Float - The StopLoss Level In Actual Price As A
CalculateStopLossDistance(OrderType, Entry, StopLoss)
Calculate StopLoss Distance In Pips
Parameters:
OrderType (int) : Is To Determine A Long / Short Position, Defval = 1
Entry (float) : Is The Entry Level Of The Order, NEED TO INPUT PARAM
StopLoss (float) : Level Based On Previous Calculation, NEED TO INPUT PARAM
Returns: Float - The StopLoss Value In Pips
CalculateTakeProfitLevel(OrderType, Entry, StopLossDistance, RiskReward)
Calculate TakeProfit Level
Parameters:
OrderType (int) : Is To Determine A Long / Short Position, Defval = 1
Entry (float) : Is The Entry Level Of The Order, Defval = na
StopLossDistance (float)
RiskReward (float)
Returns: Float - The TakeProfit Level In Actual Price
CalculateTakeProfitDistance(OrderType, Entry, TakeProfit)
Get TakeProfit Distance In Pips
Parameters:
OrderType (int) : Is To Determine A Long / Short Position, Defval = 1
Entry (float) : Is The Entry Level Of The Order, NEED TO INPUT PARAM
TakeProfit (float) : Level Based On Previous Calculation, NEED TO INPUT PARAM
Returns: Float - The TakeProfit Value In Pips
CalculateConversionCurrency(AccountCurrency, SymbolCurrency, BaseCurrency)
Get The Conversion Currecny Between Current Account Currency & Current Pair's Quoted Currency (FOR FOREX ONLY)
Parameters:
AccountCurrency (simple string) : Is For The Account Currency Used
SymbolCurrency (simple string) : Is For The Current Symbol Currency (Front Symbol)
BaseCurrency (simple string) : Is For The Current Symbol Base Currency (Back Symbol)
Returns: Tuple Of A Bollean (Convert The Currency ?) And A String (Converted Currency)
CalculateConversionRate(ConvertCurrency, ConversionRate)
Get The Conversion Rate Between Current Account Currency & Current Pair's Quoted Currency (FOR FOREX ONLY)
Parameters:
ConvertCurrency (bool) : Is To Check If The Current Symbol Needs To Be Converted Or Not
ConversionRate (float) : Is The Quoted Price Of The Conversion Currency (Input The request.security Function Here)
Returns: Float Price Of Conversion Rate (If In The Same Currency Than Return Value Will Be 1.0)
LotSize(LotSizeSimple, Balance, Risk, SLDistance, ConversionRate)
Get Current Lot Size
Parameters:
LotSizeSimple (bool) : Is To Toggle Lot Sizing Calculation (Simple Is Good Enough For Stocks & Crypto, Whilst Complex Is For Forex)
Balance (float) : Is For The Current Account Balance To Calculate The Lot Sizing Based Off
Risk (float) : Is For The Current Risk Per Trade To Calculate The Lot Sizing Based Off
SLDistance (float) : Is The Current Position StopLoss Distance From Its Entry Price
ConversionRate (float) : Is The Currency Conversion Rate (Used For Complex Lot Sizing Only)
Returns: Float - Position Size In Units
ToLots(Units)
Converts Units To Lots
Parameters:
Units (float) : Is For How Many Units Need To Be Converted Into Lots (Minimun 1000 Units)
Returns: Float - Position Size In Lots
ToUnits(Lots)
Converts Lots To Units
Parameters:
Lots (float) : Is For How Many Lots Need To Be Converted Into Units (Minimun 0.01 Units)
Returns: Int - Position Size In Units
ToLotsInUnits(Units)
Converts Units To Lots Than Back To Units
Parameters:
Units (float) : Is For How Many Units Need To Be Converted Into Lots (Minimun 1000 Units)
Returns: Float - Position Size In Lots That Were Rounded To Units
ATRTrail(OrderType, SourceType, ATRPeriod, ATRMultiplyer, SwingLookback)
Calculate ATR Trailing Stop
Parameters:
OrderType (int) : Is To Determine A Long / Short Position, Defval = 1
SourceType (int) : Is To Determine Where To Calculate The ATR Trailing From, Defval = close
ATRPeriod (simple int) : Is To Change Its ATR Period, Defval = 20
ATRMultiplyer (float) : Is To Change Its ATR Trailing Distance, Defval = 1
SwingLookback (int) : Is To Change Its Swing HiLo Lookback (Only From Source Type 5), Defval = 7
Returns: Float - Number Of The Current ATR Trailing
DangerZone(WinRate, AvgRRR, Filter)
Calculate Danger Zone Of A Given Strategy
Parameters:
WinRate (float) : Is The Strategy WinRate
AvgRRR (float) : Is The Strategy Avg RRR
Filter (float) : Is The Minimum Profit It Needs To Be Out Of BE Zone, Defval = 3
Returns: Int - Value, 1 If Out Of Danger Zone, 0 If BE, -1 If In Danger Zone
IsQuestionableTrades(TradeTP, TradeSL)
Checks For Questionable Trades (Which Are Trades That Its TP & SL Level Got Hit At The Same Candle)
Parameters:
TradeTP (float) : Is The Trade In Question Take Profit Level
TradeSL (float) : Is The Trade In Question Stop Loss Level
Returns: Bool - True If The Last Trade Was A "Questionable Trade"
//====================================================================================================================================================
// Custom Strategy Functions
//====================================================================================================================================================
OpenLong(EntryID, LotSize, LimitPrice, StopPrice, Comment, CommentValue)
Open A Long Order Based On The Given Params
Parameters:
EntryID (string) : Is The Trade Entry ID, Defval = "Long"
LotSize (float) : Is The Lot Size Of The Trade, Defval = 1
LimitPrice (float) : Is The Limit Order Price To Set The Order At, Defval = Na / Market Order Execution
StopPrice (float) : Is The Stop Order Price To Set The Order At, Defval = Na / Market Order Execution
Comment (string) : Is The Order Comment, Defval = Long Entry Order
CommentValue (string) : Is For Custom Values In The Order Comment, Defval = Na
Returns: Void
OpenShort(EntryID, LotSize, LimitPrice, StopPrice, Comment, CommentValue)
Open A Short Order Based On The Given Params
Parameters:
EntryID (string) : Is The Trade Entry ID, Defval = "Short"
LotSize (float) : Is The Lot Size Of The Trade, Defval = 1
LimitPrice (float) : Is The Limit Order Price To Set The Order At, Defval = Na / Market Order Execution
StopPrice (float) : Is The Stop Order Price To Set The Order At, Defval = Na / Market Order Execution
Comment (string) : Is The Order Comment, Defval = Short Entry Order
CommentValue (string) : Is For Custom Values In The Order Comment, Defval = Na
Returns: Void
TP_SLExit(FromID, TPLevel, SLLevel, PercentageClose, Comment, CommentValue)
Exits Based On Predetermined TP & SL Levels
Parameters:
FromID (string) : Is The Trade ID That The TP & SL Levels Be Palced
TPLevel (float) : Is The Take Profit Level
SLLevel (float) : Is The StopLoss Level
PercentageClose (float) : Is The Amount To Close The Order At (In Percentage) Defval = 100
Comment (string) : Is The Order Comment, Defval = Exit Order
CommentValue (string) : Is For Custom Values In The Order Comment, Defval = Na
Returns: Void
CloseLong(ExitID, PercentageClose, Comment, CommentValue, Instant)
Exits A Long Order Based On A Specified Condition
Parameters:
ExitID (string) : Is The Trade ID That Will Be Closed, Defval = "Long"
PercentageClose (float) : Is The Amount To Close The Order At (In Percentage) Defval = 100
Comment (string) : Is The Order Comment, Defval = Exit Order
CommentValue (string) : Is For Custom Values In The Order Comment, Defval = Na
Instant (bool) : Is For Exit Execution Type, Defval = false
Returns: Void
CloseShort(ExitID, PercentageClose, Comment, CommentValue, Instant)
Exits A Short Order Based On A Specified Condition
Parameters:
ExitID (string) : Is The Trade ID That Will Be Closed, Defval = "Short"
PercentageClose (float) : Is The Amount To Close The Order At (In Percentage) Defval = 100
Comment (string) : Is The Order Comment, Defval = Exit Order
CommentValue (string) : Is For Custom Values In The Order Comment, Defval = Na
Instant (bool) : Is For Exit Execution Type, Defval = false
Returns: Void
BrokerCheck(Broker)
Checks Traded Broker With Current Loaded Chart Broker
Parameters:
Broker (string) : Is The Current Broker That Is Traded
Returns: Bool - True If Current Traded Broker Is Same As Loaded Chart Broker
OpenPC(LicenseID, OrderType, UseLimit, LimitPrice, SymbolPrefix, Symbol, SymbolSuffix, Risk, SL, TP, OrderComment, Spread)
Compiles Given Parameters Into An Alert String Format To Open Trades Using Pine Connector
Parameters:
LicenseID (string) : Is The Users PineConnector LicenseID
OrderType (int) : Is The Desired OrderType To Open
UseLimit (bool) : Is If We Want To Enter The Position At Exactly The Previous Closing Price
LimitPrice (float) : Is The Limit Price Of The Trade (Only For Pending Orders)
SymbolPrefix (string) : Is The Current Symbol Prefix (If Any)
Symbol (string) : Is The Traded Symbol
SymbolSuffix (string) : Is The Current Symbol Suffix (If Any)
Risk (float) : Is The Trade Risk Per Trade / Fixed Lot Sizing
SL (float) : Is The Trade SL In Price / In Pips
TP (float) : Is The Trade TP In Price / In Pips
OrderComment (string) : Is The Executed Trade Comment
Spread (float) : is The Maximum Spread For Execution
Returns: String - Pine Connector Order Syntax Alert Message
ClosePC(LicenseID, OrderType, SymbolPrefix, Symbol, SymbolSuffix)
Compiles Given Parameters Into An Alert String Format To Close Trades Using Pine Connector
Parameters:
LicenseID (string) : Is The Users PineConnector LicenseID
OrderType (int) : Is The Desired OrderType To Close
SymbolPrefix (string) : Is The Current Symbol Prefix (If Any)
Symbol (string) : Is The Traded Symbol
SymbolSuffix (string) : Is The Current Symbol Suffix (If Any)
Returns: String - Pine Connector Order Syntax Alert Message
//====================================================================================================================================================
// Custom Backtesting Calculation Functions
//====================================================================================================================================================
CalculatePNL(EntryPrice, ExitPrice, LotSize, ConversionRate)
Calculates Trade PNL Based On Entry, Eixt & Lot Size
Parameters:
EntryPrice (float) : Is The Trade Entry
ExitPrice (float) : Is The Trade Exit
LotSize (float) : Is The Trade Sizing
ConversionRate (float) : Is The Currency Conversion Rate (Used For Complex Lot Sizing Only)
Returns: Float - The Current Trade PNL
UpdateBalance(PrevBalance, PNL)
Updates The Previous Ginve Balance To The Next PNL
Parameters:
PrevBalance (float) : Is The Previous Balance To Be Updated
PNL (float) : Is The Current Trade PNL To Be Added
Returns: Float - The Current Updated PNL
CalculateSlpComm(PNL, MaxRate)
Calculates Random Slippage & Commisions Fees Based On The Parameters
Parameters:
PNL (float) : Is The Current Trade PNL
MaxRate (float) : Is The Upper Limit (In Percentage) Of The Randomized Fee
Returns: Float - A Percentage Fee Of The Current Trade PNL
UpdateDD(MaxBalance, Balance)
Calculates & Updates The DD Based On Its Given Parameters
Parameters:
MaxBalance (float) : Is The Maximum Balance Ever Recorded
Balance (float) : Is The Current Account Balance
Returns: Float - The Current Strategy DD
CalculateWR(TotalTrades, LongID, ShortID)
Calculate The Total, Long & Short Trades Win Rate
Parameters:
TotalTrades (int) : Are The Current Total Trades That The Strategy Has Taken
LongID (string) : Is The Order ID Of The Long Trades Of The Strategy
ShortID (string) : Is The Order ID Of The Short Trades Of The Strategy
Returns: Tuple Of Long WR%, Short WR%, Total WR%, Total Winning Trades, Total Losing Trades, Total Long Trades & Total Short Trades
CalculateAvgRRR(WinTrades, LossTrades)
Calculates The Overall Strategy Avg Risk Reward Ratio
Parameters:
WinTrades (int) : Are The Strategy Winning Trades
LossTrades (int) : Are The Strategy Losing Trades
Returns: Float - The Average RRR Values
CAGR(StartTime, StartPrice, EndTime, EndPrice)
Calculates The CAGR Over The Given Time Period © TradingView
Parameters:
StartTime (int) : Is The Starting Time Of The Calculation
StartPrice (float) : Is The Starting Price Of The Calculation
EndTime (int) : Is The Ending Time Of The Calculation
EndPrice (float) : Is The Ending Price Of The Calculation
Returns: Float - The CAGR Values
//====================================================================================================================================================
// Custom Plot Functions
//====================================================================================================================================================
EditLabels(LabelID, X1, Y1, Text, Color, TextColor, EditCondition, DeleteCondition)
Edit / Delete Labels
Parameters:
LabelID (label) : Is The ID Of The Selected Label
X1 (int) : Is The X1 Coordinate IN BARINDEX Xloc
Y1 (float) : Is The Y1 Coordinate IN PRICE Yloc
Text (string) : Is The Text Than Wants To Be Written In The Label
Color (color) : Is The Color Value Change Of The Label Text
TextColor (color)
EditCondition (int) : Is The Edit Condition of The Line (Setting Location / Color)
DeleteCondition (bool) : Is The Delete Condition Of The Line If Ture Deletes The Prev Itteration Of The Line
Returns: Void
EditLine(LineID, X1, Y1, X2, Y2, Color, EditCondition, DeleteCondition)
Edit / Delete Lines
Parameters:
LineID (line) : Is The ID Of The Selected Line
X1 (int) : Is The X1 Coordinate IN BARINDEX Xloc
Y1 (float) : Is The Y1 Coordinate IN PRICE Yloc
X2 (int) : Is The X2 Coordinate IN BARINDEX Xloc
Y2 (float) : Is The Y2 Coordinate IN PRICE Yloc
Color (color) : Is The Color Value Change Of The Line
EditCondition (int) : Is The Edit Condition of The Line (Setting Location / Color)
DeleteCondition (bool) : Is The Delete Condition Of The Line If Ture Deletes The Prev Itteration Of The Line
Returns: Void
//====================================================================================================================================================
// Custom Display Functions (Using Tables)
//====================================================================================================================================================
FillTable(TableID, Column, Row, Title, Value, BgColor, TextColor, ToolTip)
Filling The Selected Table With The Inputed Information
Parameters:
TableID (table) : Is The Table ID That Wants To Be Edited
Column (int) : Is The Current Column Of The Table That Wants To Be Edited
Row (int) : Is The Current Row Of The Table That Wants To Be Edited
Title (string) : Is The String Title Of The Current Cell Table
Value (string) : Is The String Value Of The Current Cell Table
BgColor (color) : Is The Selected Color For The Current Table
TextColor (color) : Is The Selected Color For The Current Table
ToolTip (string) : Is The ToolTip Of The Current Cell In The Table
Returns: Void
DisplayBTResults(TableID, BgColor, TextColor, StartingBalance, Balance, DollarReturn, TotalPips, MaxDD)
Filling The Selected Table With The Inputed Information
Parameters:
TableID (table) : Is The Table ID That Wants To Be Edited
BgColor (color) : Is The Selected Color For The Current Table
TextColor (color) : Is The Selected Color For The Current Table
StartingBalance (float) : Is The Account Starting Balance
Balance (float)
DollarReturn (float) : Is The Account Dollar Reture
TotalPips (float) : Is The Total Pips Gained / loss
MaxDD (float) : Is The Maximum Drawdown Over The Backtesting Period
Returns: Void
DisplayBTResultsV2(TableID, BgColor, TextColor, TotalWR, QTCount, LongWR, ShortWR, InitialCapital, CumProfit, CumFee, AvgRRR, MaxDD, CAGR, MeanDD)
Filling The Selected Table With The Inputed Information
Parameters:
TableID (table) : Is The Table ID That Wants To Be Edited
BgColor (color) : Is The Selected Color For The Current Table
TextColor (color) : Is The Selected Color For The Current Table
TotalWR (float) : Is The Strategy Total WR In %
QTCount (int) : Is The Strategy Questionable Trades Count
LongWR (float) : Is The Strategy Total WR In %
ShortWR (float) : Is The Strategy Total WR In %
InitialCapital (float) : Is The Strategy Initial Starting Capital
CumProfit (float) : Is The Strategy Ending Cumulative Profit
CumFee (float) : Is The Strategy Ending Cumulative Fee (Based On Randomized Fee Assumptions)
AvgRRR (float) : Is The Strategy Average Risk Reward Ratio
MaxDD (float) : Is The Strategy Maximum DrawDown In Its Backtesting Period
CAGR (float) : Is The Strategy Compounded Average GRowth In %
MeanDD (float) : Is The Strategy Mean / Average Drawdown In The Backtesting Period
Returns: Void
//====================================================================================================================================================
// Custom Pattern Detection Functions
//====================================================================================================================================================
BullFib(priceLow, priceHigh, fibRatio)
Calculates A Bullish Fibonacci Value (From Swing Low To High) © ZenAndTheArtOfTrading
Parameters:
priceLow (float)
priceHigh (float)
fibRatio (float)
Returns: The Fibonacci Value Of The Given Ratio Between The Two Price Points
BearFib(priceLow, priceHigh, fibRatio)
Calculates A Bearish Fibonacci Value (From Swing High To Low) © ZenAndTheArtOfTrading
Parameters:
priceLow (float)
priceHigh (float)
fibRatio (float)
Returns: The Fibonacci Value Of The Given Ratio Between The Two Price Points
GetBodySize()
Gets The Current Candle Body Size IN POINTS © ZenAndTheArtOfTrading
Returns: The Current Candle Body Size IN POINTS
GetTopWickSize()
Gets The Current Candle Top Wick Size IN POINTS © ZenAndTheArtOfTrading
Returns: The Current Candle Top Wick Size IN POINTS
GetBottomWickSize()
Gets The Current Candle Bottom Wick Size IN POINTS © ZenAndTheArtOfTrading
Returns: The Current Candle Bottom Wick Size IN POINTS
GetBodyPercent()
Gets The Current Candle Body Size As A Percentage Of Its Entire Size Including Its Wicks © ZenAndTheArtOfTrading
Returns: The Current Candle Body Size IN PERCENTAGE
GetTopWickPercent()
Gets The Current Top Wick Size As A Percentage Of Its Entire Body Size
Returns: Float - The Current Candle Top Wick Size IN PERCENTAGE
GetBottomWickPercent()
Gets The Current Bottom Wick Size As A Percentage Of Its Entire Bodu Size
Returns: Float - The Current Candle Bottom Size IN PERCENTAGE
BullishEC(Allowance, RejectionWickSize, EngulfWick, NearSwings, SwingLookBack)
Checks If The Current Bar Is A Bullish Engulfing Candle
Parameters:
Allowance (int) : To Give Flexibility Of Engulfing Pattern Detection In Markets That Have Micro Gaps, Defval = 0
RejectionWickSize (float) : To Filter Out long (Upper And Lower) Wick From The Bullsih Engulfing Pattern, Defval = na
EngulfWick (bool) : To Specify If We Want The Pattern To Also Engulf Its Upper & Lower Previous Wicks, Defval = false
NearSwings (bool) : To Specify If We Want The Pattern To Be Near A Recent Swing Low, Defval = true
SwingLookBack (int) : To Specify How Many Bars Back To Detect A Recent Swing Low, Defval = 10
Returns: Bool - True If The Current Bar Matches The Requirements of a Bullish Engulfing Candle
BearishEC(Allowance, RejectionWickSize, EngulfWick, NearSwings, SwingLookBack)
Checks If The Current Bar Is A Bearish Engulfing Candle
Parameters:
Allowance (int) : To Give Flexibility Of Engulfing Pattern Detection In Markets That Have Micro Gaps, Defval = 0
RejectionWickSize (float) : To Filter Out long (Upper And Lower) Wick From The Bearish Engulfing Pattern, Defval = na
EngulfWick (bool) : To Specify If We Want The Pattern To Also Engulf Its Upper & Lower Previous Wicks, Defval = false
NearSwings (bool) : To Specify If We Want The Pattern To Be Near A Recent Swing High, Defval = true
SwingLookBack (int) : To Specify How Many Bars Back To Detect A Recent Swing High, Defval = 10
Returns: Bool - True If The Current Bar Matches The Requirements of a Bearish Engulfing Candle
Hammer(Fib, ColorMatch, NearSwings, SwingLookBack, ATRFilterCheck, ATRPeriod)
Checks If The Current Bar Is A Hammer Candle
Parameters:
Fib (float) : To Specify Which Fibonacci Ratio To Use When Determining The Hammer Candle, Defval = 0.382 Ratio
ColorMatch (bool) : To Filter Only Bullish Closed Hammer Candle Pattern, Defval = false
NearSwings (bool) : To Specify If We Want The Doji To Be Near A Recent Swing Low, Defval = true
SwingLookBack (int) : To Specify How Many Bars Back To Detect A Recent Swing Low, Defval = 10
ATRFilterCheck (float) : To Filter Smaller Hammer Candles That Might Be Better Classified As A Doji Candle, Defval = 1
ATRPeriod (simple int) : To Change ATR Period Of The ATR Filter, Defval = 20
Returns: Bool - True If The Current Bar Matches The Requirements of a Hammer Candle
Star(Fib, ColorMatch, NearSwings, SwingLookBack, ATRFilterCheck, ATRPeriod)
Checks If The Current Bar Is A Hammer Candle
Parameters:
Fib (float) : To Specify Which Fibonacci Ratio To Use When Determining The Hammer Candle, Defval = 0.382 Ratio
ColorMatch (bool) : To Filter Only Bullish Closed Hammer Candle Pattern, Defval = false
NearSwings (bool) : To Specify If We Want The Doji To Be Near A Recent Swing Low, Defval = true
SwingLookBack (int) : To Specify How Many Bars Back To Detect A Recent Swing Low, Defval = 10
ATRFilterCheck (float) : To Filter Smaller Hammer Candles That Might Be Better Classified As A Doji Candle, Defval = 1
ATRPeriod (simple int) : To Change ATR Period Of The ATR Filter, Defval = 20
Returns: Bool - True If The Current Bar Matches The Requirements of a Hammer Candle
Doji(MaxWickSize, MaxBodySize, DojiType, NearSwings, SwingLookBack)
Checks If The Current Bar Is A Doji Candle
Parameters:
MaxWickSize (float) : To Specify The Maximum Lenght Of Its Upper & Lower Wick, Defval = 2
MaxBodySize (float) : To Specify The Maximum Lenght Of Its Candle Body IN PERCENT, Defval = 0.05
DojiType (int)
NearSwings (bool) : To Specify If We Want The Doji To Be Near A Recent Swing High / Low (Only In Dragonlyf / Gravestone Mode), Defval = true
SwingLookBack (int) : To Specify How Many Bars Back To Detect A Recent Swing High / Low (Only In Dragonlyf / Gravestone Mode), Defval = 10
Returns: Bool - True If The Current Bar Matches The Requirements of a Doji Candle
BullishIB(Allowance, RejectionWickSize, EngulfWick, NearSwings, SwingLookBack)
Checks If The Current Bar Is A Bullish Harami Candle
Parameters:
Allowance (int) : To Give Flexibility Of Harami Pattern Detection In Markets That Have Micro Gaps, Defval = 0
RejectionWickSize (float) : To Filter Out long (Upper And Lower) Wick From The Bullsih Harami Pattern, Defval = na
EngulfWick (bool) : To Specify If We Want The Pattern To Also Engulf Its Upper & Lower Previous Wicks, Defval = false
NearSwings (bool) : To Specify If We Want The Pattern To Be Near A Recent Swing Low, Defval = true
SwingLookBack (int) : To Specify How Many Bars Back To Detect A Recent Swing Low, Defval = 10
Returns: Bool - True If The Current Bar Matches The Requirements of a Bullish Harami Candle
BearishIB(Allowance, RejectionWickSize, EngulfWick, NearSwings, SwingLookBack)
Checks If The Current Bar Is A Bullish Harami Candle
Parameters:
Allowance (int) : To Give Flexibility Of Harami Pattern Detection In Markets That Have Micro Gaps, Defval = 0
RejectionWickSize (float) : To Filter Out long (Upper And Lower) Wick From The Bearish Harami Pattern, Defval = na
EngulfWick (bool) : To Specify If We Want The Pattern To Also Engulf Its Upper & Lower Previous Wicks, Defval = false
NearSwings (bool) : To Specify If We Want The Pattern To Be Near A Recent Swing High, Defval = true
SwingLookBack (int) : To Specify How Many Bars Back To Detect A Recent Swing High, Defval = 10
Returns: Bool - True If The Current Bar Matches The Requirements of a Bearish Harami Candle
//====================================================================================================================================================
// Custom Time Functions
//====================================================================================================================================================
BarInSession(sess, useFilter)
Determines if the current price bar falls inside the specified session © ZenAndTheArtOfTrading
Parameters:
sess (simple string)
useFilter (bool)
Returns: A boolean - true if the current bar falls within the given time session
BarOutSession(sess, useFilter)
Determines if the current price bar falls outside the specified session © ZenAndTheArtOfTrading
Parameters:
sess (simple string)
useFilter (bool)
Returns: A boolean - true if the current bar falls outside the given time session
DateFilter(startTime, endTime)
Determines if this bar's time falls within date filter range © ZenAndTheArtOfTrading
Parameters:
startTime (int)
endTime (int)
Returns: A boolean - true if the current bar falls within the given dates
DayFilter(monday, tuesday, wednesday, thursday, friday, saturday, sunday)
Checks if the current bar's day is in the list of given days to analyze © ZenAndTheArtOfTrading
Parameters:
monday (bool)
tuesday (bool)
wednesday (bool)
thursday (bool)
friday (bool)
saturday (bool)
sunday (bool)
Returns: A boolean - true if the current bar's day is one of the given days
AUSSess()
Checks If The Current Australian Forex Session In Running
Returns: Bool - True If Currently The Australian Session Is Running
ASIASess()
Checks If The Current Asian Forex Session In Running
Returns: Bool - True If Currently The Asian Session Is Running
EURSess()
Checks If The Current European Forex Session In Running
Returns: Bool - True If Currently The European Session Is Running
USSess()
Checks If The Current US Forex Session In Running
Returns: Bool - True If Currently The US Session Is Running
UNIXToDate(Time, ConversionType, TimeZone)
Converts UNIX Time To Datetime
Parameters:
Time (int) : Is The UNIX Time Input
ConversionType (int) : Is The Datetime Output Format, Defval = DD-MM-YYYY
TimeZone (string) : Is To Convert The Outputed Datetime Into The Specified Time Zone, Defval = Exchange Time Zone
Returns: String - String Of Datetime
