DAMA OSC - Directional Adaptive MA OscillatorOverview:
The DAMA OSC (Directional Adaptive MA Oscillator) is a highly customizable and versatile oscillator that analyzes the delta between two moving averages of your choice. It detects trend progression, regressions, rebound signals, MA cross and critical zone crossovers to provide highly contextual trading information.
Designed for trend-following, reversal timing, and volatility filtering, DAMA OSC adapts to market conditions and highlights actionable signals in real-time.
Features:
Support for 11 custom moving average types (EMA, DEMA, TEMA, ALMA, KAMA, etc.)
Customizable fast & slow MA periods and types
Histogram based on percentage delta between fast and slow MA
Trend direction coloring with “Green”, “Blue”, and “Red” zones
Rebound detection using close or shadow logic
Configurable thresholds: Overbought, Oversold, Underbought, Undersold
Optional filters: rebound validation by candle color or flat-zone filter
Full visual overlay: MA lines, crossover markers, rebound icons
Complete alert system with 16 preconfigured conditions
How It Works:
Histogram Logic:
The histogram measures the percentage difference between the fast and slow MA:
hist_value = ((FastMA - SlowMA) / SlowMA) * 100
Trend State Logic (Green / Blue / Red):
Green_Up = Bullish acceleration
Blue_Up (or Red_Up, depending the display settings) = Bullish deceleration
Blue_Down (or Green_Down, depending the display settings) = Bearish deceleration
Red_Down = Bearish acceleration
Rebound Logic:
A rebound is detected when price:
Crosses back over a selected MA (fast or slow)
After being away for X candles (rebound_backstep)
Optional: filtered by histogram zones or candle color
Inputs:
Display Options:
Show/hide MA lines
Show/hide MA crosses
Show/hide price rebounds
Enable/disable blue deceleration zones
DAMA Settings:
Fast/Slow MA type and length
Source input (close by default)
Overbought/Oversold levels
Underbought/Undersold levels
Rebound Settings:
Use Close and/or Shadow
Rebound MA (Fast/Slow)
Candle color validation
Flat zone filter rebounds (between UnderSold and UnderBought)
Available MA type:
SMA (Simple MA)
EMA (Exponential MA)
DEMA (Double EMA)
TEMA (Triple EMA)
WMA (Weighted MA)
HMA (Hull MA)
VWMA (Volume Weighted MA)
Kijun (Ichimoku Baseline)
ALMA (Arnaud Legoux MA)
KAMA (Kaufman Adaptive MA)
HULLMOD (Modified Hull MA, Same as HMA, tweaked for Pine v6 constraints)
Notes:
**DEMA/TEMA** reduce lag compared to EMA, useful for faster reaction in trending markets.
**KAMA/ALMA** are better suited to noisy or volatile environments (e.g., BTC).
**VWMA** reacts strongly to volume spikes.
**HMA/HULLMOD** are great for visual clarity in fast moves.
Alerts Included (Fully Configurable):
Golden Cross:
Fast MA crosses above Slow MA
Death Cross:
Fast MA crosses below Slow MA
Bullish Rebound:
Rebound from below MA in uptrend
Bearish Rebound:
Rebound from above MA in downtrend
Bull Progression:
Transition into Green_Up with positive delta
Bear Progression:
Transition into Red_Down with negative delta
Bull Regression:
Exit from Red_Down into Blue/Green with negative delta
Bear Regression:
Exit from Green_Up into Blue/Red with positive delta
Crossover Overbought:
Histogram crosses above Overbought
Crossunder Overbought:
Histogram crosses below Overbought
Crossover Oversold:
Histogram crosses above Oversold
Crossunder Oversold:
Histogram crosses below Oversold
Crossover Underbought:
Histogram crosses above Underbought
Crossunder Underbought:
Histogram crosses below Underbought
Crossover Undersold:
Histogram crosses above Undersold
Crossunder Undersold:
Histogram crosses below Undersold
Credits:
Created by Eff_Hash. This code is shared with the TradingView community and full free. do not hesitate to share your best settings and usage.
Cerca negli script per "kama"

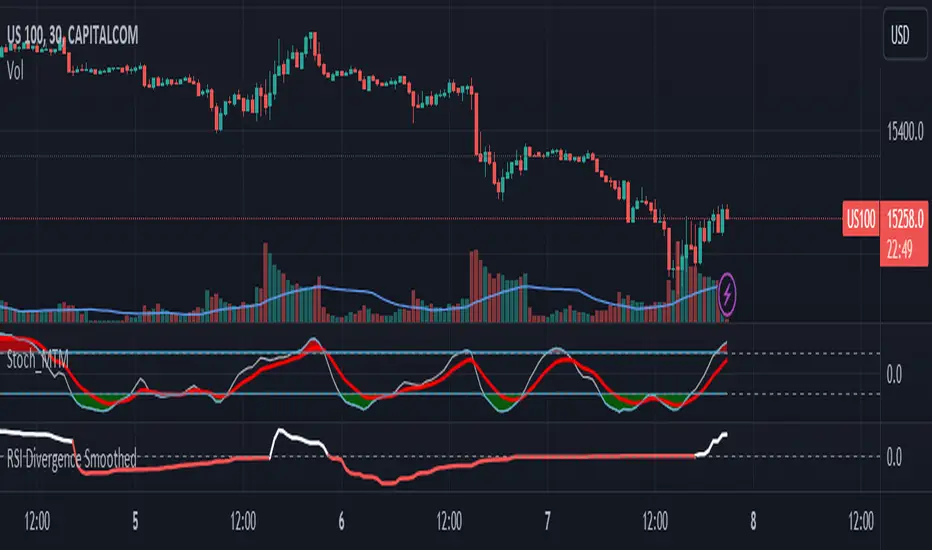
RSI Divergence SmoothedRSI Divergence Smoothed
This indicator is based on the RSI Divergence indicator by @InvestitoreComune.
The "RSI Divergence Smoothed" is a custom technical indicator designed to highlight divergence between two RSI (Relative Strength Index) lines: a fast RSI and a slow RSI. The divergence is then visualized on the chart, assisting traders in recognizing potential market reversals and trend continuation.
Here's a breakdown of its smoothing options added:
1. **WMA Difference**: The indicator first computes a weighted moving average (WMA) difference, which takes the difference between the WMA of half the input length and the WMA of the full length.
2. **Hull Moving Average (HMA)**: The indicator can use the HMA as a filter. HMA combines the benefits of a simple moving average and a linear weighted moving average, aiming to be faster in response to price changes.
3. **Sine Weighted Moving Average (SWMA)**: Another filter option, SWMA, weighs the data points by the sine of their position in the data set, giving more weight to the central data points.
4. **Kaufman's Adaptive Moving Average (KAMA)**: KAMA adapts to price volatility and can also be used as a filter. It's especially useful in choppy markets, adjusting the smoothing constant based on the relative volatility of the price series.
5. **Gaussian Moving Average (GMA)**: This filter uses a Gaussian kernel to weigh the data points, emphasizing the more recent data while giving lesser importance to older data. It helps smooth out the price data, potentially eliminating some of the noise.
I've personally found the KAMA smoothing to be most helpful but keen to hear of anyone's personal experiences and recommendations.
RSI divergence computations are based on the filtered price (or raw price if no filter is chosen) - the indicator calculates two RSIs:
- Fast RSI: With a default length of 5 periods.
- Slow RSI: With a default length of 14 periods.
The core functionality of this indicator is to compute the divergence between the Fast and Slow RSI. The divergence is plotted on the chart, with the color indicating its direction: white for positive divergence and red for negative.
Regularized-Moving-Average Oscillator SuiteThe Regularized-MA Oscillator Suite is a versatile indicator that transforms any moving average into an oscillator. It comprises up to 13 different moving average types, including KAMA, T3, and ALMA. This indicator serves as a valuable tool for both trend following and mean reversion strategies, providing traders and investors with enhanced insights into market dynamics.
Methodology:
The Regularized MA Oscillator Suite calculates the moving average (MA) based on user-defined parameters such as length, moving average type, and custom smoothing factors. It then derives the mean and standard deviation of the MA using a normalized period. Finally, it computes the Z-Score by subtracting the mean from the MA and dividing it by the standard deviation.
KAMA (Kaufman's Adaptive Moving Average):
KAMA is a unique moving average type that dynamically adjusts its smoothing period based on market volatility. It adapts to changing market conditions, providing a smoother response during periods of low volatility and a quicker response during periods of high volatility. This allows traders to capture trends effectively while reducing noise.
T3 (Tillson's Exponential Moving Average):
T3 is an exponential moving average that incorporates additional smoothing techniques to reduce lag and provide a more responsive indicator. It aims to maintain a balance between responsiveness and smoothness, allowing traders to identify trend reversals with greater accuracy.
ALMA (Arnaud Legoux Moving Average):
ALMA is a moving average type that utilizes a combination of linear regression and exponential moving average techniques. It offers a unique way of calculating the moving average by providing a smoother and more accurate representation of price trends. ALMA reduces lag and noise, enabling traders to identify trend changes and potential entry or exit points more effectively.
Z-Score:
The Z-Score calculation in the Regularized-MA Oscillator Suite standardizes the values of the moving average. It measures the deviation of each data point from the mean in terms of standard deviations. By normalizing the moving average through the Z-Score, the indicator enables traders to assess the relative position of price in relation to its mean and volatility. This information can be valuable for identifying overbought and oversold conditions, as well as potential trend reversals.
Utility:
The Regularized-MA Oscillator Suite with its unique moving average types and Z-Score calculation offers traders and investors powerful analytical tools. It can be used for trend following strategies by analyzing the oscillator's position relative to the midline. Traders can also employ it as a mean reversion tool by identifying peak values above user-defined deviations. These features assist in identifying potential entry and exit points, enhancing trading decisions and market analysis.
Key Features:
Variety of 13 MA types.
Potential reversal point bubbles.
Bar coloring methods - Trend (Midline cross), Extremities, Reversions, Slope
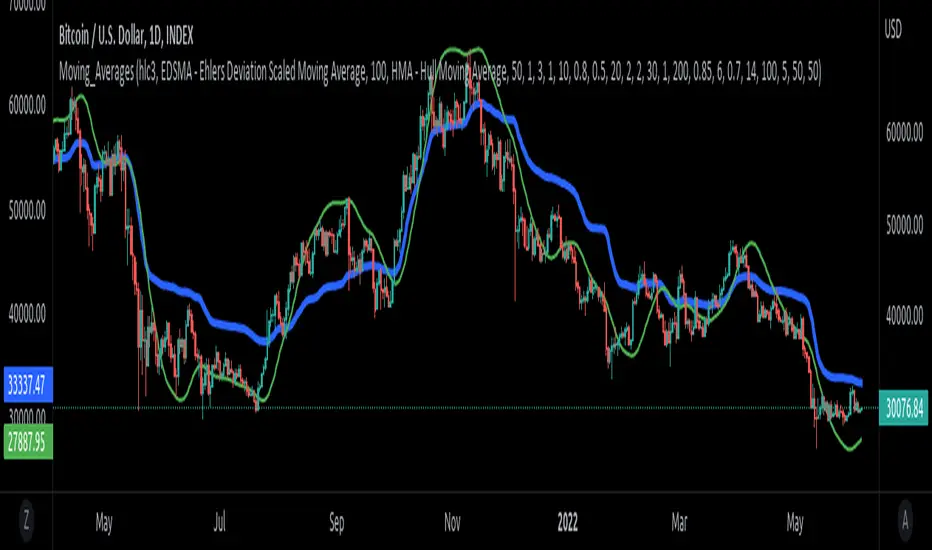
Example Charts:

Moving_AveragesLibrary "Moving_Averages"
This library contains majority important moving average functions with int series support. Which means that they can be used with variable length input. For conventional use, please use tradingview built-in ta functions for moving averages as they are more precise. I'll use functions in this library for my other scripts with dynamic length inputs.
ema(src, len)
Exponential Moving Average (EMA)
Parameters:
src : Source
len : Period
Returns: Exponential Moving Average with Series Int Support (EMA)
alma(src, len, a_offset, a_sigma)
Arnaud Legoux Moving Average (ALMA)
Parameters:
src : Source
len : Period
a_offset : Arnaud Legoux offset
a_sigma : Arnaud Legoux sigma
Returns: Arnaud Legoux Moving Average (ALMA)
covwema(src, len)
Coefficient of Variation Weighted Exponential Moving Average (COVWEMA)
Parameters:
src : Source
len : Period
Returns: Coefficient of Variation Weighted Exponential Moving Average (COVWEMA)
covwma(src, len)
Coefficient of Variation Weighted Moving Average (COVWMA)
Parameters:
src : Source
len : Period
Returns: Coefficient of Variation Weighted Moving Average (COVWMA)
dema(src, len)
DEMA - Double Exponential Moving Average
Parameters:
src : Source
len : Period
Returns: DEMA - Double Exponential Moving Average
edsma(src, len, ssfLength, ssfPoles)
EDSMA - Ehlers Deviation Scaled Moving Average
Parameters:
src : Source
len : Period
ssfLength : EDSMA - Super Smoother Filter Length
ssfPoles : EDSMA - Super Smoother Filter Poles
Returns: Ehlers Deviation Scaled Moving Average (EDSMA)
eframa(src, len, FC, SC)
Ehlrs Modified Fractal Adaptive Moving Average (EFRAMA)
Parameters:
src : Source
len : Period
FC : Lower Shift Limit for Ehlrs Modified Fractal Adaptive Moving Average
SC : Upper Shift Limit for Ehlrs Modified Fractal Adaptive Moving Average
Returns: Ehlrs Modified Fractal Adaptive Moving Average (EFRAMA)
ehma(src, len)
EHMA - Exponential Hull Moving Average
Parameters:
src : Source
len : Period
Returns: Exponential Hull Moving Average (EHMA)
etma(src, len)
Exponential Triangular Moving Average (ETMA)
Parameters:
src : Source
len : Period
Returns: Exponential Triangular Moving Average (ETMA)
frama(src, len)
Fractal Adaptive Moving Average (FRAMA)
Parameters:
src : Source
len : Period
Returns: Fractal Adaptive Moving Average (FRAMA)
hma(src, len)
HMA - Hull Moving Average
Parameters:
src : Source
len : Period
Returns: Hull Moving Average (HMA)
jma(src, len, jurik_phase, jurik_power)
Jurik Moving Average - JMA
Parameters:
src : Source
len : Period
jurik_phase : Jurik (JMA) Only - Phase
jurik_power : Jurik (JMA) Only - Power
Returns: Jurik Moving Average (JMA)
kama(src, len, k_fastLength, k_slowLength)
Kaufman's Adaptive Moving Average (KAMA)
Parameters:
src : Source
len : Period
k_fastLength : Number of periods for the fastest exponential moving average
k_slowLength : Number of periods for the slowest exponential moving average
Returns: Kaufman's Adaptive Moving Average (KAMA)
kijun(_high, _low, len, kidiv)
Kijun v2
Parameters:
_high : High value of bar
_low : Low value of bar
len : Period
kidiv : Kijun MOD Divider
Returns: Kijun v2
lsma(src, len, offset)
LSMA/LRC - Least Squares Moving Average / Linear Regression Curve
Parameters:
src : Source
len : Period
offset : Offset
Returns: Least Squares Moving Average (LSMA)/ Linear Regression Curve (LRC)
mf(src, len, beta, feedback, z)
MF - Modular Filter
Parameters:
src : Source
len : Period
beta : Modular Filter, General Filter Only - Beta
feedback : Modular Filter Only - Feedback
z : Modular Filter Only - Feedback Weighting
Returns: Modular Filter (MF)
rma(src, len)
RMA - RSI Moving average
Parameters:
src : Source
len : Period
Returns: RSI Moving average (RMA)
sma(src, len)
SMA - Simple Moving Average
Parameters:
src : Source
len : Period
Returns: Simple Moving Average (SMA)
smma(src, len)
Smoothed Moving Average (SMMA)
Parameters:
src : Source
len : Period
Returns: Smoothed Moving Average (SMMA)
stma(src, len)
Simple Triangular Moving Average (STMA)
Parameters:
src : Source
len : Period
Returns: Simple Triangular Moving Average (STMA)
tema(src, len)
TEMA - Triple Exponential Moving Average
Parameters:
src : Source
len : Period
Returns: Triple Exponential Moving Average (TEMA)
thma(src, len)
THMA - Triple Hull Moving Average
Parameters:
src : Source
len : Period
Returns: Triple Hull Moving Average (THMA)
vama(src, len, volatility_lookback)
VAMA - Volatility Adjusted Moving Average
Parameters:
src : Source
len : Period
volatility_lookback : Volatility lookback length
Returns: Volatility Adjusted Moving Average (VAMA)
vidya(src, len)
Variable Index Dynamic Average (VIDYA)
Parameters:
src : Source
len : Period
Returns: Variable Index Dynamic Average (VIDYA)
vwma(src, len)
Volume-Weighted Moving Average (VWMA)
Parameters:
src : Source
len : Period
Returns: Volume-Weighted Moving Average (VWMA)
wma(src, len)
WMA - Weighted Moving Average
Parameters:
src : Source
len : Period
Returns: Weighted Moving Average (WMA)
zema(src, len)
Zero-Lag Exponential Moving Average (ZEMA)
Parameters:
src : Source
len : Period
Returns: Zero-Lag Exponential Moving Average (ZEMA)
zsma(src, len)
Zero-Lag Simple Moving Average (ZSMA)
Parameters:
src : Source
len : Period
Returns: Zero-Lag Simple Moving Average (ZSMA)
evwma(src, len)
EVWMA - Elastic Volume Weighted Moving Average
Parameters:
src : Source
len : Period
Returns: Elastic Volume Weighted Moving Average (EVWMA)
tt3(src, len, a1_t3)
Tillson T3
Parameters:
src : Source
len : Period
a1_t3 : Tillson T3 Volume Factor
Returns: Tillson T3
gma(src, len)
GMA - Geometric Moving Average
Parameters:
src : Source
len : Period
Returns: Geometric Moving Average (GMA)
wwma(src, len)
WWMA - Welles Wilder Moving Average
Parameters:
src : Source
len : Period
Returns: Welles Wilder Moving Average (WWMA)
ama(src, _high, _low, len, ama_f_length, ama_s_length)
AMA - Adjusted Moving Average
Parameters:
src : Source
_high : High value of bar
_low : Low value of bar
len : Period
ama_f_length : Fast EMA Length
ama_s_length : Slow EMA Length
Returns: Adjusted Moving Average (AMA)
cma(src, len)
Corrective Moving average (CMA)
Parameters:
src : Source
len : Period
Returns: Corrective Moving average (CMA)
gmma(src, len)
Geometric Mean Moving Average (GMMA)
Parameters:
src : Source
len : Period
Returns: Geometric Mean Moving Average (GMMA)
ealf(src, len, LAPercLen_, FPerc_)
Ehler's Adaptive Laguerre filter (EALF)
Parameters:
src : Source
len : Period
LAPercLen_ : Median Length
FPerc_ : Median Percentage
Returns: Ehler's Adaptive Laguerre filter (EALF)
elf(src, len, LAPercLen_, FPerc_)
ELF - Ehler's Laguerre filter
Parameters:
src : Source
len : Period
LAPercLen_ : Median Length
FPerc_ : Median Percentage
Returns: Ehler's Laguerre Filter (ELF)
edma(src, len)
Exponentially Deviating Moving Average (MZ EDMA)
Parameters:
src : Source
len : Period
Returns: Exponentially Deviating Moving Average (MZ EDMA)
pnr(src, len, rank_inter_Perc_)
PNR - percentile nearest rank
Parameters:
src : Source
len : Period
rank_inter_Perc_ : Rank and Interpolation Percentage
Returns: Percentile Nearest Rank (PNR)
pli(src, len, rank_inter_Perc_)
PLI - Percentile Linear Interpolation
Parameters:
src : Source
len : Period
rank_inter_Perc_ : Rank and Interpolation Percentage
Returns: Percentile Linear Interpolation (PLI)
rema(src, len)
Range EMA (REMA)
Parameters:
src : Source
len : Period
Returns: Range EMA (REMA)
sw_ma(src, len)
Sine-Weighted Moving Average (SW-MA)
Parameters:
src : Source
len : Period
Returns: Sine-Weighted Moving Average (SW-MA)
vwap(src, len)
Volume Weighted Average Price (VWAP)
Parameters:
src : Source
len : Period
Returns: Volume Weighted Average Price (VWAP)
mama(src, len)
MAMA - MESA Adaptive Moving Average
Parameters:
src : Source
len : Period
Returns: MESA Adaptive Moving Average (MAMA)
fama(src, len)
FAMA - Following Adaptive Moving Average
Parameters:
src : Source
len : Period
Returns: Following Adaptive Moving Average (FAMA)
hkama(src, len)
HKAMA - Hilbert based Kaufman's Adaptive Moving Average
Parameters:
src : Source
len : Period
Returns: Hilbert based Kaufman's Adaptive Moving Average (HKAMA)
pandas_taLibrary "pandas_ta"
Level: 3
Background
Today is the first day of 2022 and happy new year every tradingviewers! May health and wealth go along with you all the time. I use this chance to publish my 1st PINE v5 lib : pandas_ta
This is not a piece of cake like thing, which cost me a lot of time and efforts to build this lib. Beyond 300 versions of this script was iterated in draft.
Function
Library "pandas_ta"
PINE v5 Counterpart of Pandas TA - A Technical Analysis Library in Python 3 at github.com
The Original Pandas Technical Analysis (Pandas TA) is an easy to use library that leverages the Pandas package with more than 130 Indicators and Utility functions and more than 60 TA Lib Candlestick Patterns.
I realized most of indicators except Candlestick Patterns because tradingview built-in Candlestick Patterns are even more powerful!
I use this to verify pandas_ta python version indicators for myself, but I realize that maybe many may need similar lib for pine v5 as well.
Function Brief Descriptions (Pls find details in script comments)
bton --> Binary to number
wcp --> Weighted Closing Price (WCP)
counter --> Condition counter
xbt --> Between
ebsw --> Even Better SineWave (EBSW)
ao --> Awesome Oscillator (AO)
apo --> Absolute Price Oscillator (APO)
xrf --> Dynamic shifted values
bias --> Bias (BIAS)
bop --> Balance of Power (BOP)
brar --> BRAR (BRAR)
cci --> Commodity Channel Index (CCI)
cfo --> Chande Forcast Oscillator (CFO)
cg --> Center of Gravity (CG)
cmo --> Chande Momentum Oscillator (CMO)
coppock --> Coppock Curve (COPC)
cti --> Correlation Trend Indicator (CTI)
dmi --> Directional Movement Index(DMI)
er --> Efficiency Ratio (ER)
eri --> Elder Ray Index (ERI)
fisher --> Fisher Transform (FISHT)
inertia --> Inertia (INERTIA)
kdj --> KDJ (KDJ)
kst --> 'Know Sure Thing' (KST)
macd --> Moving Average Convergence Divergence (MACD)
mom --> Momentum (MOM)
pgo --> Pretty Good Oscillator (PGO)
ppo --> Percentage Price Oscillator (PPO)
psl --> Psychological Line (PSL)
pvo --> Percentage Volume Oscillator (PVO)
qqe --> Quantitative Qualitative Estimation (QQE)
roc --> Rate of Change (ROC)
rsi --> Relative Strength Index (RSI)
rsx --> Relative Strength Xtra (rsx)
rvgi --> Relative Vigor Index (RVGI)
slope --> Slope
smi --> SMI Ergodic Indicator (SMI)
sqz* --> Squeeze (SQZ) * NOTE: code sufferred from very strange error, code was commented.
sqz_pro --> Squeeze PRO(SQZPRO)
xfl --> Condition filter
stc --> Schaff Trend Cycle (STC)
stoch --> Stochastic (STOCH)
stochrsi --> Stochastic RSI (STOCH RSI)
trix --> Trix (TRIX)
tsi --> True Strength Index (TSI)
uo --> Ultimate Oscillator (UO)
willr --> William's Percent R (WILLR)
alma --> Arnaud Legoux Moving Average (ALMA)
xll --> Dynamic rolling lowest values
dema --> Double Exponential Moving Average (DEMA)
ema --> Exponential Moving Average (EMA)
fwma --> Fibonacci's Weighted Moving Average (FWMA)
hilo --> Gann HiLo Activator(HiLo)
hma --> Hull Moving Average (HMA)
hwma --> HWMA (Holt-Winter Moving Average)
ichimoku --> Ichimoku Kinkō Hyō (ichimoku)
jma --> Jurik Moving Average Average (JMA)
kama --> Kaufman's Adaptive Moving Average (KAMA)
linreg --> Linear Regression Moving Average (linreg)
mgcd --> McGinley Dynamic Indicator
rma --> wildeR's Moving Average (RMA)
sinwma --> Sine Weighted Moving Average (SWMA)
ssf --> Ehler's Super Smoother Filter (SSF) © 2013
supertrend --> Supertrend (supertrend)
xsa --> X simple moving average
swma --> Symmetric Weighted Moving Average (SWMA)
t3 --> Tim Tillson's T3 Moving Average (T3)
tema --> Triple Exponential Moving Average (TEMA)
trima --> Triangular Moving Average (TRIMA)
vidya --> Variable Index Dynamic Average (VIDYA)
vwap --> Volume Weighted Average Price (VWAP)
vwma --> Volume Weighted Moving Average (VWMA)
wma --> Weighted Moving Average (WMA)
zlma --> Zero Lag Moving Average (ZLMA)
entropy --> Entropy (ENTP)
kurtosis --> Rolling Kurtosis
skew --> Rolling Skew
xev --> Condition all
zscore --> Rolling Z Score
adx --> Average Directional Movement (ADX)
aroon --> Aroon & Aroon Oscillator (AROON)
chop --> Choppiness Index (CHOP)
xex --> Condition any
cksp --> Chande Kroll Stop (CKSP)
dpo --> Detrend Price Oscillator (DPO)
long_run --> Long Run
psar --> Parabolic Stop and Reverse (psar)
short_run --> Short Run
vhf --> Vertical Horizontal Filter (VHF)
vortex --> Vortex
accbands --> Acceleration Bands (ACCBANDS)
atr --> Average True Range (ATR)
bbands --> Bollinger Bands (BBANDS)
donchian --> Donchian Channels (DC)
kc --> Keltner Channels (KC)
massi --> Mass Index (MASSI)
natr --> Normalized Average True Range (NATR)
pdist --> Price Distance (PDIST)
rvi --> Relative Volatility Index (RVI)
thermo --> Elders Thermometer (THERMO)
ui --> Ulcer Index (UI)
ad --> Accumulation/Distribution (AD)
cmf --> Chaikin Money Flow (CMF)
efi --> Elder's Force Index (EFI)
ecm --> Ease of Movement (EOM)
kvo --> Klinger Volume Oscillator (KVO)
mfi --> Money Flow Index (MFI)
nvi --> Negative Volume Index (NVI)
obv --> On Balance Volume (OBV)
pvi --> Positive Volume Index (PVI)
dvdi --> Dual Volume Divergence Index (DVDI)
xhh --> Dynamic rolling highest values
pvt --> Price-Volume Trend (PVT)
Remarks
I also incorporated func descriptions and func test script in commented mode, you can test the functino with the embedded test script and modify them as you wish.
This is a Level 3 free and open source indicator library.
Feedbacks are appreciated.
This is not the end of pandas_ta lib publication, but it is start point with pine v5 lib function and I will add more and more funcs into this lib for my own indicators.
Function Name List:
bton()
wcp()
count()
xbt()
ebsw()
ao()
apo()
xrf()
bias()
bop()
brar()
cci()
cfo()
cg()
cmo()
coppock()
cti()
dmi()
er()
eri()
fisher()
inertia()
kdj()
kst()
macd()
mom()
pgo()
ppo()
psl()
pvo()
qqe()
roc()
rsi()
rsx()
rvgi()
slope()
smi()
sqz_pro()
xfl()
stc()
stoch()
stochrsi()
trix()
tsi()
uo()
willr()
alma()
wcx()
xll()
dema()
ema()
fwma()
hilo()
hma()
hwma()
ichimoku()
jma()
kama()
linreg()
mgcd()
rma()
sinwma()
ssf()
supertrend()
xsa()
swma()
t3()
tema()
trima()
vidya()
vwap()
vwma()
wma()
zlma()
entropy()
kurtosis()
skew()
xev()
zscore()
adx()
aroon()
chop()
xex()
cksp()
dpo()
long_run()
psar()
short_run()
vhf()
vortex()
accbands()
atr()
bbands()
donchian()
kc()
massi()
natr()
pdist()
rvi()
thermo()
ui()
ad()
cmf()
efi()
ecm()
kvo()
mfi()
nvi()
obv()
pvi()
dvdi()
xhh()
pvt()

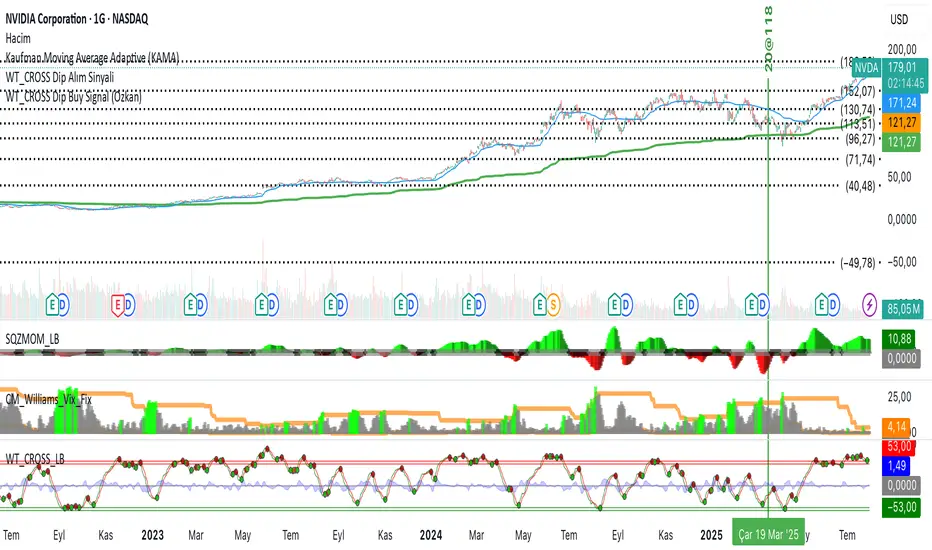
WT_CROSS Dip Buy Signal(ozkan)This script identifies potential buy opportunities based on WaveTrend (WT_CROSS) momentum crossing below the -60 level — often indicating oversold conditions.
Additional filters include price being above the Kaufman Adaptive Moving Average (KAMA) and volume below the 5-period average, which helps isolate pullbacks within an uptrend.
Buy Signal Conditions:
WT1 < -60
Price > KAMA
Volume < 5-period SMA of volume
Purpose:
To capture early entries at possible local bottoms during bullish trends while avoiding high-volume breakdown traps.
🔔 You can also set an alert based on this condition.
LMAsLibrary "LMAs"
Credits
Thank you to @QuantraSystems for dynamic calculations.
Introduction
This lightweight library offers dynamic implementations of popular moving averages that adapt their length automatically as new bars are added to the chart.
Each function is built on a dynamic length formula:
len = math.min(maxLength, bar_index + 1)
This approach ensures that calculations begin as early as the first bar, allowing for smoother initialization and more consistent behavior across all timeframes. It’s especially useful in custom scripts that run from bar 0 or when historical data is limited.
Usage
You can use this library as a drop-in replacement for standard moving averages. It provides more flexibility and stability in live or backtesting environments where fixed-length indicators may delay or fail to initialize properly.
Why Use This?
• Works from the very first bar
• Avoids na values during early bars
• Great for real-time indicators, strategies, and bar-replay
• Clean and efficient code with dynamic behavior
How to Use
Import the library into your script and call any of the included functions just like you would with their native counterparts.
Summary
A lightweight Pine Script™ library offering dynamic moving averages that work seamlessly from the very first bar. Ideal for strategies and indicators requiring robust initialization and adaptive behavior.
SMA(sourceData, maxLength)
Dynamic SMA
Parameters:
sourceData (float)
maxLength (int)
EMA(src, length)
Dynamic EMA
Parameters:
src (float)
length (int)
DEMA(src, length)
Dynamic DEMA
Parameters:
src (float)
length (int)
TEMA(src, length)
Dynamic TEMA
Parameters:
src (float)
length (int)
WMA(src, length)
Dynamic WMA
Parameters:
src (float)
length (int)
HMA(src, length)
Dynamic HMA
Parameters:
src (float)
length (int)
VWMA(src, volsrc, length)
Dynamic VWMA
Parameters:
src (float)
volsrc (float)
length (int)
SMMA(src, length)
Dynamic SMMA
Parameters:
src (float)
length (int)
LSMA(src, length, offset)
Dynamic LSMA
Parameters:
src (float)
length (int)
offset (int)
RMA(src, length)
Dynamic RMA
Parameters:
src (float)
length (int)
ALMA(src, length, offset_sigma, sigma)
Dynamic ALMA
Parameters:
src (float)
length (int)
offset_sigma (float)
sigma (float)
ZLSMA(src, length)
Dynamic ZLSMA
Parameters:
src (float)
length (int)
FRAMA(src, length)
Parameters:
src (float)
length (int)
KAMA(src, length)
Dynamic KAMA
Parameters:
src (float)
length (int)
JMA(src, length, phase)
Dynamic JMA
Parameters:
src (float)
length (int)
phase (float)
T3(src, length, volumeFactor)
Dynamic T3
Parameters:
src (float)
length (int)
volumeFactor (float)

RSI-GringoRSI-Gringo — Stochastic RSI with Advanced Smoothing Averages
Overview:
RSI-Gringo is an advanced technical indicator that combines the concept of the Stochastic RSI with multiple smoothing options using various moving averages. It is designed for traders seeking greater precision in momentum analysis, while offering the flexibility to select the type of moving average that best suits their trading style.
Disclaimer: This script is not investment advice. Its use is entirely at your own risk. My responsibility is to provide a fully functional indicator, but it is not my role to guide how to trade, adjust, or use this tool in any specific strategy.
The JMA (Jurik Moving Average) version used in this script is a custom implementation based on publicly shared code by TradingView users, and it is not the original licensed version from Jurik Research.
What This Indicator Does
RSI-Gringo applies the Stochastic Oscillator logic to the RSI itself (rather than price), helping to identify overbought and oversold conditions within the RSI. This often leads to more responsive and accurate momentum signals.
This indicator displays:
%K: the main Stochastic RSI line
%D: smoothed signal line of %K
Upper/Lower horizontal reference lines at 80 and 20
Features and Settings
Available smoothing methods (selectable from dropdown):
SMA — Simple Moving Average
SMMA — Smoothed Moving Average (equivalent to RMA)
EMA — Exponential Moving Average
WMA — Weighted Moving Average
HMA — Hull Moving Average (manually implemented)
JMA — Jurik Moving Average (custom approximation)
KAMA — Kaufman Adaptive Moving Average
T3 — Triple Smoothed Moving Average with adjustable hot factor
How to Adjust Advanced Averages
T3 – Triple Smoothed MA
Parameter: T3 Hot Factor
Valid range: 0.1 to 2.0
Tuning:
Lower values (e.g., 0.1) make it faster but noisier
Higher values (e.g., 2.0) make it smoother but slower
Balanced range: 0.7 to 1.0 (recommended)
JMA – Jurik Moving Average (Custom)
Parameters:
Phase: adjusts responsiveness and smoothness (-100 to 100)
Power: controls smoothing intensity (default: 1)
Tuning:
Phase = 0: neutral behavior
Phase > 0: more reactive
Phase < 0: smoother, more delayed
Power = 1: recommended default for most uses
Note: The JMA used here is not the proprietary version by Jurik Research, but an educational approximation available in the public domain on TradingView.
How to Use
Crossover Signals
Buy signal: %K crosses above %D from below the 20 line
Sell signal: %K crosses below %D from above the 80 line
Momentum Strength
%K and %D above 80: strong bullish momentum
%K and %D below 20: strong bearish momentum
With Trend Filters
Combine this indicator with trend-following tools (like moving averages on price)
Fast smoothing types (like EMA or HMA) are better for scalping and day trading
Slower types (like T3 or KAMA) are better for swing and long-term trading
Final Tips
Tweak RSI and smoothing periods depending on the time frame you're trading.
Try different combinations of moving averages to find what works best for your strategy.
This indicator is intended as a supporting tool for technical analysis — not a standalone decision-making system.

Curved Trend Channels (Zeiierman)█ Overview
Curved Trend Channels (Zeiierman) is a next-generation trend visualization tool engineered to adapt dynamically to both linear and non-linear market behavior. It introduces a novel curvature-based channeling system that grows over time during trending conditions, mirroring the natural acceleration of price trends, while simultaneously leveraging adaptive range filtering and dual-layer candle trend logic.
This tool is ideal for traders seeking smooth yet reactive dynamic channels that evolve with market structure. Whether used in curved mode or traditional slope mode, it provides exceptional clarity on trend transitions, volatility compression, and breakout development.
█ How It Works
⚪ Adaptive Range Filter Foundation
The core of the system is a volatility-based range filter that determines the underlying structure of the bands:
Pre-Smoothing of High/Low Data – Highs and lows are smoothed using a selectable moving average (SMA, EMA, HMA, KAMA, etc.) before calculating the volatility range.
Volatility Envelope – The range is scaled using a fixed factor (2.618) and further adjusted by a Band Multiplier to form the primary envelope around price.
Smoothed Volatility Curve – Final bands are stabilized using a long lookback, ensuring clean visual structure and trend clarity.
⚪ Curved Channel Logic
In Curved Mode, the trend channel grows over time when the trend direction remains unchanged:
Base Step Size (× ATR) – Sets the minimum unit of slope change.
Growth per Bar (× ATR) – Defines the acceleration rate of the channel slope with time.
Trend Persistence Recognition – The longer a trend persists, the more pronounced the slope becomes, mimicking real market accelerations.
This dynamic, time-dependent logic enables the channel to "curve" upward or downward, tracking long-standing trends with increasing confidence.
⚪ Trend Slope
As an alternative to curved logic, traders can activate a regular Trend slope using:
Slope Length – Determines how quickly the trend line adapts to price shifts.
Multiplicative Factor – Amplifies the sensitivity of the slope, useful in fast-moving markets or lower timeframes.
⚪ Candle Trend Confirmation
A robust second-layer trend detection method, the Candle Trend System evaluates directional pressure by analyzing smoothed price action:
Multi-tier Smoothing – Trend lines are derived from short-, medium-, and long-term candle movement.
█ How to Use
⚪ Trend Identification
When the Trend Line direction and Candle Colors are in agreement, this indicates strong, persistent directional conviction. Use these moments to enter with trend confirmation and manage risk more confidently.
⚪ Retest
During ongoing trends, the price will often pull back into the dynamic channel. Look for:
Support/resistance interactions at the upper or lower bands.
█ Settings
Scaled Volatility Length – Controls the historical depth used to stabilize the volatility bands.
Smoothing Type – Choose from HMA, KAMA, VIDYA, FRAMA, Super Smoother, etc. to match your asset and trading style.
Volatility MA Length – Smoothing length for the calculated range; shorter = more reactive.
High/Low Smoother Length – Additional smoothing to reduce noise from spikes or false pivots.
Band Multiplier – Widens or tightens the band range based on personal preference.
Enable Curved Channel – Toggle between curved or regular trend slope behavior.
Base Step (× ATR) – The starting point for curved slope progression.
Growth per Bar (× ATR) – How much the slope accelerates per bar during a sustained trend.
Slope – Reactivity of the standard trend line to price movements.
Multiplicative Factor – Sensitivity adjustment for HyperTrend slope.
Candle Trend Length – Lookback period for trend determination from candle structure.
-----------------
Disclaimer
The content provided in my scripts, indicators, ideas, algorithms, and systems is for educational and informational purposes only. It does not constitute financial advice, investment recommendations, or a solicitation to buy or sell any financial instruments. I will not accept liability for any loss or damage, including without limitation any loss of profit, which may arise directly or indirectly from the use of or reliance on such information.
All investments involve risk, and the past performance of a security, industry, sector, market, financial product, trading strategy, backtest, or individual's trading does not guarantee future results or returns. Investors are fully responsible for any investment decisions they make. Such decisions should be based solely on an evaluation of their financial circumstances, investment objectives, risk tolerance, and liquidity needs.

Dynamic Range Filter with Trend Candlesticks (Zeiierman)█ Overview
Dynamic Range Filter with Trend Candlesticks (Zeiierman) is a volatility-responsive trend engine that adapts in real-time to market structure, offering a clean and intelligent visualization of directional bias. It blends dynamic range calculation with customizable smoothing techniques and layered trend confirmation logic, making it ideal for traders who rely on clear trend direction, structural range analysis, and momentum-based candlestick signals.
By measuring scaled volatility over configurable lengths and applying advanced moving average techniques, this indicator filters out market noise while preserving true directional intent. Complementing this, a dual-trend system (range-based and candle-based) enhances clarity and responsiveness, particularly during shifting market conditions.
█ How It Works
⚪ Scaled Volatility Band Calculation
At the core lies a volatility engine that constructs adaptive range bands around price using smoothed high/low calculations. The bands are dynamically adjusted using:
High/Low Smoothing – Applies a moving average to the raw high and low data before calculating the range.
Scaled Range Volatility – A 2.618 multiplier scales the distance between smoothed highs and lows, forming a responsive volatility envelope.
Band Multiplier – Controls how wide the upper/lower range bands extend from the mean.
This filtering process minimizes false signals and highlights only structurally meaningful moves.
⚪ Multi-Type Smoothing Engine
Users can choose from a wide array of smoothing algorithms for trend construction, including:
HMA (default), SMA, EMA, RMA
KAMA – Adapts to market volatility using efficiency ratios.
VIDYA – Momentum-sensitive smoothing using CMO logic.
FRAMA – Dynamically adjusts to fractal dimension in price.
Super Smoother – Ideal for eliminating aliasing in range signals.
This provides the trader with fine-tuned control over reactivity vs. smoothness.
⚪ Trend Detection (Dual Engine)
The indicator includes two independent trend tracking systems:
Main Trend Filter – Based on adaptive volatility band shifts.
Candle Trend Filter – A second-tier confirmation using smoothed candle data, ideal for directional candles and confirmation entries.
█ How to Use
⚪ Trend Confirmation
Use the Trend Line and colored candlesticks for high-probability entries in the trend direction. The more trend layers that align, the higher the confidence.
⚪ Reversal Zones
When the price reaches the outer bands or fails to break them, look for candle color shifts or a crossover in the range to anticipate possible reversals or consolidations.
█ Settings
Scaled Volatility Length – Controls the lookback used to stabilize the base volatility band.
MA Type & Length – Choose and fine-tune the smoothing method (HMA, EMA, KAMA, etc.)
High/Low Smoother – Pre-smoothing for structural high/low banding.
Band Multiplier – Adjusts the width of the dynamic bands.
Trend Length (Candles) – Length used for candle-based trend confirmation.
-----------------
Disclaimer
The content provided in my scripts, indicators, ideas, algorithms, and systems is for educational and informational purposes only. It does not constitute financial advice, investment recommendations, or a solicitation to buy or sell any financial instruments. I will not accept liability for any loss or damage, including without limitation any loss of profit, which may arise directly or indirectly from the use of or reliance on such information.
All investments involve risk, and the past performance of a security, industry, sector, market, financial product, trading strategy, backtest, or individual's trading does not guarantee future results or returns. Investors are fully responsible for any investment decisions they make. Such decisions should be based solely on an evaluation of their financial circumstances, investment objectives, risk tolerance, and liquidity needs.

MACD Sniper [trade_lexx]📈 MACD Sniper — Improve your trading strategy with accurate signals!
Introducing the MACD Sniper , an advanced trading indicator designed for a comprehensive analysis of market conditions. This indicator combines MACD (Moving Average Convergence Divergence) with various types of moving averages (SMA, EMA, WMA, VWMA, KAMA, HMA, ZLEMA, TEMA, ALMA, DEMA), providing traders with a powerful tool for generating buy and sell signals. It is ideal for traders who need an advantage in detecting changes in trends and market conditions.
🔍 How the signals work
1. Histogram signals:
— A buy signal is generated when the MACD histogram is below zero and begins to grow after the minimum number of falling histogram columns, which are indicated in the indicator menu. This indicates that selling pressure has decreased, the market is oversold and ready for a rebound. The signals are displayed as green triangles labeled "H" under the histogram graph. On the main chart, buy signals are displayed as green triangles labeled "Buy" under candlesticks.
— A sell signal is generated when the MACD histogram is above zero and begins to fall after the minimum number of growing histogram columns, which are indicated in the indicator menu. This indicates that the buying pressure has decreased, the market is overbought and ready for correction. The signals are displayed as red triangles labeled "H" above the histogram graph. On the main chart, the sell signals are displayed as red triangles with the word "Sell" above the candlesticks.
2. Moving Average Crossing Signals (MA):
— A buy signal is generated when the Fast Moving Average (MACD) crosses the Slow Moving Average (Signal Line) from bottom to top. This indicates a possible upward reversal of the market. The signals are displayed as green triangles labeled "MA" under the MACD chart. On the main chart, buy signals are displayed as green triangles labeled "Buy" under candlesticks.
— A sell signal is generated when the Fast Moving Average (MACD) crosses the slow Moving Average (Signal Line) from top to bottom. This indicates a possible downward reversal of the market. The signals are displayed as red triangles labeled "MA" above the MACD chart. On the main chart, the sell signals are displayed as red triangles with the word "Sell" above the candlesticks.
🔧 Signal filtering
— Minimum number of bars between signals
This filter allows the user to set the minimum number of bars that must pass between the generation of two consecutive signals. This helps to avoid frequent false alarms and improves the quality of the generated signals. Setting this parameter allows you to filter out the noise in the market and make the signals more reliable. For example, if the value is set to 5, then a new signal will be generated only after 5 bars have passed since the previous signal.
— "Wait for the opposite signal" mode
In this mode, Buy and Sell signals are generated only after receiving the opposite signal. This means that a buy signal will be generated only after the previous sell signal, and vice versa. This approach adds an additional level of filtering and helps to avoid false positives. This is especially useful in conditions of high market volatility, when false signals often occur.
— RSI filter
The Relative Strength Index (RSI) is used for additional filtering of buy and sell signals. The RSI helps determine whether a market is overbought or oversold. The user can set overbought and oversold levels, and signals will be generated only when the RSI is in the specified ranges. For example, a buy signal will be generated only if the RSI is in the range between 10 and 30 (oversold), and a sell signal if the RSI is in the range between 70 and 90 (overbought). This helps to avoid false signals in extreme market conditions.
🔌 Connector Histogram, MA, Combined 🔌
These parameters allow you to connect the indicator to trading strategies and test the signals throughout the trading history. This makes the indicator an even more powerful tool for traders who want to test the effectiveness of their strategies on historical data.
Connector Histogram provides the ability to connect signals based on the MACD histogram to trading strategies.
Connector MA allows you to connect signals based on the intersection of moving averages (MA) of the MACD, which can also be used for automatic trading or strategy testing.
The combined connector combines signals based on both a histogram and the intersection of moving averages, making the analysis more comprehensive and reliable, which is especially useful for traders seeking to improve the quality of their trading decisions.
🔔 Alerts
The indicator provides the ability to set up notifications for buy and sell signals, which allows traders to keep abreast of important market events without having to constantly monitor the chart. Users can set up notifications that will alert them when buy or sell signals appear, helping them respond to market changes in a timely manner and make informed decisions. These notifications can be configured for various types of signals, such as signals based on the MACD histogram, moving average crossings, or all at once, which makes the indicator a more convenient and functional tool for active traders.
🎨 Customizable Appearance
Customize the appearance of the MACD Sniper according to your preferences to make the analysis more convenient and visually pleasing. In the indicator settings section, you can change the colors of the buy and sell signals so that they stand out on the chart and are easily visible. For example, buy signals can be green, and sell signals can be red. These settings allow traders to adapt the indicator to their individual needs, making it more flexible and user-friendly.
🔧 How it works
The MACD Sniper indicator starts by calculating the MACD values and moving averages for a specific period in order to assess market conditions. For this, fast and slow moving averages are used, as well as a signal line, which are calculated based on the set parameters. The indicator then analyzes the MACD histogram to determine whether the difference between the fast and slow moving averages is rising or falling. Based on this analysis, buy and sell signals are generated. Additionally, the indicator uses the RSI filter to filter out false signals in overbought or oversold market conditions. The user can set the minimum number of bars between the signals and the "Wait for the opposite signal" mode for additional filtering. The indicator dynamically adjusts to changes in the market, providing relevant signals in real time.
📚 Quick guide to using the MACD Sniper
— Add the indicator to your favorites by clicking on the rocket icon. Adjust the parameters such as the length of periods for fast and slow moving averages, the type of moving average (SMA, EMA, WMA, VWMA, KAMA, HMA, ZLEMA, TEMA, ALMA, DEMA) and the length of the signal line, according to your trading style, or leave all settings as default.
— Adjust the signal filters to improve their quality and avoid false alarms
— Turn on notifications so that you don't miss important trading opportunities and don't constantly sit at the chart. This will allow you to keep abreast of all key market events and respond to them in a timely manner, without being distracted from other business.
— Use signals, they will help you determine the optimal entry and exit points of positions.
— Use the Connector for deeper analysis and verification of the effectiveness of signals, connect them to your trading strategies. This will allow you to test signals throughout your trading history and evaluate their accuracy based on historical data.
— Include the indicator in your trading strategy and run testing to see how buy and sell signals have worked in the past.
— Analyze the test results to determine how reliable the signals are and how they can improve your trading strategy. This will help you make more informed decisions and increase your trading efficiency.

Moving Average Bands with Signals [UAlgo]The "Moving Average Bands with Signals combines various moving average types with ATR-based bands to help traders identify potential support and resistance levels.
It plots moving average bands with upper and lower support/resistance levels based on the Average True Range (ATR) and user-defined settings.Additionally, the script generates buy/sell signals based on price crossing above or below the bands.
🔶 Key Features
Multiple Moving Average Types:
Supports various moving average calculations including Arnaud Legoux Moving Average (ALMA), Exponential Moving Average (EMA), Double Exponential Moving Average (DEMA), Triple Exponential Moving Average (TEMA), Kaufman Adaptive Moving Average (KAMA), Hull Moving Average (HMA), Least Squares Moving Average (LSMA), Simple Moving Average (SMA), Triangular Moving Average (TMA), Volume-Weighted Moving Average (VWMA), Weighted Moving Average (WMA), and Zero-Lag Moving Average (ZLMA).
Customizable ATR Bands:
Integrates the Average True Range (ATR) to calculate dynamic support and resistance bands around the moving average. The multiplier for the bands is user-adjustable, allowing for finer control over the sensitivity and width of the bands.
Signal Generation:
Provides visual signals on the chart when the price interacts with the support or resistance bands. Users can choose between using the wick or the close price to generate these signals, adding an extra layer of customization based on their trading style.
Flexible Input Parameters:
Allows users to input parameters for moving average length, ATR length, band multiplier, and signal type. Additional settings are available for specific moving average types, such as ALMA's offset and sigma, KAMA's fast and slow periods, and LSMA's offset.
🔶 Disclaimer
This script is provided for educational purposes only and should not be considered financial advice.
Trading financial instruments involves substantial risk and can result in significant financial losses.
The script’s performance in the past is not indicative of future results, and no guarantees are made regarding its accuracy, reliability, or performance.

Uptrick: MultiMA_VolumePurpose:
The "Uptrick: MultiMA_Volume" indicator, identified by its abbreviated title 'MMAV,' is meticulously designed to provide traders with a comprehensive view of market dynamics by incorporating multiple moving averages (MAs) and volume analysis. With adjustable inputs and customizable visibility options, traders can tailor the indicator to their specific trading preferences and strategies, thereby enhancing its utility and usability.
Explanation:
Input Variables and Customization:
Traders have the flexibility to adjust various parameters, including the lengths of different moving averages (SMA, EMA, WMA, HMA, and KAMA), as well as the option to show or hide each moving average and volume-related components.
Customization options empower traders to fine-tune the indicator according to their trading styles and market preferences, enhancing its adaptability across different market conditions.
Moving Averages and Trend Identification:
The script computes multiple types of moving averages, including Simple (SMA), Exponential (EMA), Weighted (WMA), Hull (HMA), and Kaufman's Adaptive (KAMA), allowing traders to assess trend directionality and strength from various perspectives.
Traders can determine potential price movements by observing the relationship between the current price and the plotted moving averages. For example, prices above the moving averages may suggest bullish sentiment, while prices below could indicate bearish sentiment.
Volume Analysis:
Volume analysis is integrated into the indicator, enabling traders to evaluate volume dynamics alongside trend analysis.
Traders can identify significant volume spikes using a customizable threshold, with bars exceeding the threshold highlighted to signify potential shifts in market activity and liquidity.
Determining Potential Price Movements:
By analyzing the relationship between price and the plotted moving averages, traders can infer potential price movements.
Bullish biases may be suggested when prices are above the moving averages, accompanied by rising volume, while bearish biases may be indicated when prices are below the moving averages, with declining volume reinforcing the potential for downward price movements.
Utility and Potential Usage:
The "Uptrick: MultiMA_Volume" indicator serves as a comprehensive tool for traders, offering insights into trend directionality, strength, and volume dynamics.
Traders can utilize the indicator to identify potential trading opportunities, confirm trend signals, and manage risk effectively.
By consolidating multiple indicators into a single chart, the indicator streamlines the analytical process, providing traders with a concise overview of market conditions and facilitating informed decision-making.
Through its customizable features and comprehensive analysis, the "Uptrick: MultiMA_Volume" indicator equips traders with actionable insights into market trends and volume dynamics. By integrating trend analysis and volume assessment into their trading strategies, traders can navigate the markets with confidence and precision, thereby enhancing their trading outcomes.

Extended Moving Average (MA) LibraryThis Extended Moving Average Library is a sophisticated and comprehensive tool for traders seeking to expand their arsenal of moving averages for more nuanced and detailed technical analysis.
The library contains various types of moving averages, each with two versions - one that accepts a simple constant length parameter and another that accepts a series or changing length parameter.
This makes the library highly versatile and suitable for a wide range of strategies and trading styles.
Moving Averages Included:
Simple Moving Average (SMA): This is the most basic type of moving average. It calculates the average of a selected range of prices, typically closing prices, by the number of periods in that range.
Exponential Moving Average (EMA): This type of moving average gives more weight to the latest data and is thus more responsive to new price information. This can help traders to react faster to recent price changes.
Double Exponential Moving Average (DEMA): This is a composite of a single exponential moving average, a double exponential moving average, and an exponential moving average of a triple exponential moving average. It aims to eliminate lag, which is a key drawback of using moving averages.
Jurik Moving Average (JMA): This is a versatile and responsive moving average that can be adjusted for market speed. It is designed to stay balanced and responsive, regardless of how long or short it is.
Kaufman's Adaptive Moving Average (KAMA): This moving average is designed to account for market noise or volatility. KAMA will closely follow prices when the price swings are relatively small and the noise is low.
Smoothed Moving Average (SMMA): This type of moving average applies equal weighting to all observations and smooths out the data.
Triangular Moving Average (TMA): This is a double smoothed simple moving average, calculated by averaging the simple moving averages of a dataset.
True Strength Force (TSF): This is a moving average of the linear regression line, a statistical tool used to predict future values from past values.
Volume Moving Average (VMA): This is a simple moving average of a volume, which can help to identify trends in volume.
Volume Adjusted Moving Average (VAMA): This moving average adjusts for volume and can be more responsive to volume changes.
Zero Lag Exponential Moving Average (ZLEMA): This type of moving average aims to eliminate the lag in traditional EMAs, making it more responsive to recent price changes.
Selector: The selector function allows users to easily select and apply any of the moving averages included in the library inside their strategy.
This library provides a broad selection of moving averages to choose from, allowing you to experiment with different types and find the one that best suits your trading strategy.
By providing both simple and series versions for each moving average, this library offers great flexibility, enabling users to pass both constant and changing length parameters as needed.
Moving Averages ProxyLibrary "MovingAveragesProxy"
Moving Averages Proxy - Library of all moving averages spread out in different libraries
rvwap(_src, fixedTfInput, minsInput, hoursInput, daysInput, minBarsInput)
Calculates the Rolling VWAP (customized VWAP developed by the team of TradingView)
Parameters:
_src : (float) Source. Default: close
fixedTfInput : (bool) Use a fixed time period. Default: false
minsInput : (int) Minutes. Default: 0
hoursInput : (int) Hours. Default: 0
daysInput : (int) Days. Default: 1
minBarsInput : (int) Bars. Default: 10
Returns: (float) Rolling VWAP
correlationMa(src, len, factor)
Correlation Moving Average
Parameters:
src : (float) Source. Default: close
len : (int) Length
factor : (float) Factor. Default: 1.7
Returns: (float) Correlation Moving Average
regma(src, len, lambda)
Regularized Exponential Moving Average
Parameters:
src : (float) Source. Default: close
len : (int) Length
lambda : (float) Lambda. Default: 0.5
Returns: (float) Regularized Exponential Moving Average
repma(src, len)
Repulsion Moving Average
Parameters:
src : (float) Source. Default: close
len : (int) Length
Returns: (float) Repulsion Moving Average
epma(src, length, offset)
End Point Moving Average
Parameters:
src : (float) Source. Default: close
length : (int) Length
offset : (float) Offset. Default: 4
Returns: (float) End Point Moving Average
lc_lsma(src, length)
1LC-LSMA (1 line code lsma with 3 functions)
Parameters:
src : (float) Source. Default: close
length : (int) Length
Returns: (float) 1LC-LSMA Moving Average
aarma(src, length)
Adaptive Autonomous Recursive Moving Average
Parameters:
src : (float) Source. Default: close
length : (int) Length
Returns: (float) Adaptive Autonomous Recursive Moving Average
alsma(src, length)
Adaptive Least Squares
Parameters:
src : (float) Source. Default: close
length : (int) Length
Returns: (float) Adaptive Least Squares
ahma(src, length)
Ahrens Moving Average
Parameters:
src : (float) Source. Default: close
length : (int) Length
Returns: (float) Ahrens Moving Average
adema(src)
Ahrens Moving Average
Parameters:
src : (float) Source. Default: close
Returns: (float) Moving Average
autol(src, lenDev)
Auto-Line
Parameters:
src : (float) Source. Default: close
lenDev : (int) Length for standard deviation
Returns: (float) Auto-Line
fibowma(src, length)
Fibonacci Weighted Moving Average
Parameters:
src : (float) Source. Default: close
length : (int) Length
Returns: (float) Moving Average
fisherlsma(src, length)
Fisher Least Squares Moving Average
Parameters:
src : (float) Source. Default: close
length : (int) Length
Returns: (float) Moving Average
leoma(src, length)
Leo Moving Average
Parameters:
src : (float) Source. Default: close
length : (int) Length
Returns: (float) Moving Average
linwma(src, period, weight)
Linear Weighted Moving Average
Parameters:
src : (float) Source. Default: close
period : (int) Length
weight : (int) Weight
Returns: (float) Moving Average
mcma(src, length)
McNicholl Moving Average
Parameters:
src : (float) Source. Default: close
length : (int) Length
Returns: (float) Moving Average
srwma(src, length)
Square Root Weighted Moving Average
Parameters:
src : (float) Source. Default: close
length : (int) Length
Returns: (float) Moving Average
EDSMA(src, len)
Ehlers Dynamic Smoothed Moving Average.
Parameters:
src : Series to use ('close' is used if no argument is supplied).
len : Lookback length to use.
Returns: EDSMA smoothing.
dema(x, t)
Double Exponential Moving Average.
Parameters:
x : Series to use ('close' is used if no argument is supplied).
t : Lookback length to use.
Returns: DEMA smoothing.
tema(src, len)
Triple Exponential Moving Average.
Parameters:
src : Series to use ('close' is used if no argument is supplied).
len : Lookback length to use.
Returns: TEMA smoothing.
smma(src, len)
Smoothed Moving Average.
Parameters:
src : Series to use ('close' is used if no argument is supplied).
len : Lookback length to use.
Returns: SMMA smoothing.
hullma(src, len)
Hull Moving Average.
Parameters:
src : Series to use ('close' is used if no argument is supplied).
len : Lookback length to use.
Returns: Hull smoothing.
frama(x, t)
Fractal Reactive Moving Average.
Parameters:
x : Series to use ('close' is used if no argument is supplied).
t : Lookback length to use.
Returns: FRAMA smoothing.
kama(x, t)
Kaufman's Adaptive Moving Average.
Parameters:
x : Series to use ('close' is used if no argument is supplied).
t : Lookback length to use.
Returns: KAMA smoothing.
vama(src, len)
Volatility Adjusted Moving Average.
Parameters:
src : Series to use ('close' is used if no argument is supplied).
len : Lookback length to use.
Returns: VAMA smoothing.
donchian(len)
Donchian Calculation.
Parameters:
len : Lookback length to use.
Returns: Average of the highest price and the lowest price for the specified look-back period.
Jurik(src, len)
Jurik Moving Average.
Parameters:
src : Series to use ('close' is used if no argument is supplied).
len : Lookback length to use.
Returns: JMA smoothing.
xema(src, len)
Optimized Exponential Moving Average.
Parameters:
src : Series to use ('close' is used if no argument is supplied).
len : Lookback length to use.
Returns: XEMA smoothing.
ehma(src, len)
EHMA - Exponential Hull Moving Average
Parameters:
src : Source
len : Period
Returns: Exponential Hull Moving Average (EHMA)
covwema(src, len)
Coefficient of Variation Weighted Exponential Moving Average (COVWEMA)
Parameters:
src : Source
len : Period
Returns: Coefficient of Variation Weighted Exponential Moving Average (COVWEMA)
covwma(src, len)
Coefficient of Variation Weighted Moving Average (COVWMA)
Parameters:
src : Source
len : Period
Returns: Coefficient of Variation Weighted Moving Average (COVWMA)
eframa(src, len, FC, SC)
Ehlrs Modified Fractal Adaptive Moving Average (EFRAMA)
Parameters:
src : Source
len : Period
FC : Lower Shift Limit for Ehlrs Modified Fractal Adaptive Moving Average
SC : Upper Shift Limit for Ehlrs Modified Fractal Adaptive Moving Average
Returns: Ehlrs Modified Fractal Adaptive Moving Average (EFRAMA)
etma(src, len)
Exponential Triangular Moving Average (ETMA)
Parameters:
src : Source
len : Period
Returns: Exponential Triangular Moving Average (ETMA)
rma(src, len)
RMA - RSI Moving average
Parameters:
src : Source
len : Period
Returns: RSI Moving average (RMA)
thma(src, len)
THMA - Triple Hull Moving Average
Parameters:
src : Source
len : Period
Returns: Triple Hull Moving Average (THMA)
vidya(src, len)
Variable Index Dynamic Average (VIDYA)
Parameters:
src : Source
len : Period
Returns: Variable Index Dynamic Average (VIDYA)
zsma(src, len)
Zero-Lag Simple Moving Average (ZSMA)
Parameters:
src : Source
len : Period
Returns: Zero-Lag Simple Moving Average (ZSMA)
zema(src, len)
Zero-Lag Exponential Moving Average (ZEMA)
Parameters:
src : Source
len : Period
Returns: Zero-Lag Exponential Moving Average (ZEMA)
evwma(src, len)
EVWMA - Elastic Volume Weighted Moving Average
Parameters:
src : Source
len : Period
Returns: Elastic Volume Weighted Moving Average (EVWMA)
tt3(src, len, a1_t3)
Tillson T3
Parameters:
src : Source
len : Period
a1_t3 : Tillson T3 Volume Factor
Returns: Tillson T3
gma(src, len)
GMA - Geometric Moving Average
Parameters:
src : Source
len : Period
Returns: Geometric Moving Average (GMA)
wwma(src, len)
WWMA - Welles Wilder Moving Average
Parameters:
src : Source
len : Period
Returns: Welles Wilder Moving Average (WWMA)
cma(src, len)
Corrective Moving average (CMA)
Parameters:
src : Source
len : Period
Returns: Corrective Moving average (CMA)
edma(src, len)
Exponentially Deviating Moving Average (MZ EDMA)
Parameters:
src : Source
len : Period
Returns: Exponentially Deviating Moving Average (MZ EDMA)
rema(src, len)
Range EMA (REMA)
Parameters:
src : Source
len : Period
Returns: Range EMA (REMA)
sw_ma(src, len)
Sine-Weighted Moving Average (SW-MA)
Parameters:
src : Source
len : Period
Returns: Sine-Weighted Moving Average (SW-MA)
mama(src, len)
MAMA - MESA Adaptive Moving Average
Parameters:
src : Source
len : Period
Returns: MESA Adaptive Moving Average (MAMA)
fama(src, len)
FAMA - Following Adaptive Moving Average
Parameters:
src : Source
len : Period
Returns: Following Adaptive Moving Average (FAMA)
hkama(src, len)
HKAMA - Hilbert based Kaufman's Adaptive Moving Average
Parameters:
src : Source
len : Period
Returns: Hilbert based Kaufman's Adaptive Moving Average (HKAMA)
getMovingAverage(type, src, len, lsmaOffset, inputAlmaOffset, inputAlmaSigma, FC, SC, a1_t3, fixedTfInput, daysInput, hoursInput, minsInput, minBarsInput, lambda, volumeWeighted, gamma_aarma, smooth, linweight, volatility_lookback, jurik_phase, jurik_power)
Abstract proxy function that invokes the calculation of a moving average according to type
Parameters:
type : (string) Type of moving average
src : (float) Source of series (close, high, low, etc.)
len : (int) Period of loopback to calculate the average
lsmaOffset : (int) Offset for Least Squares MA
inputAlmaOffset : (float) Offset for ALMA
inputAlmaSigma : (float) Sigma for ALMA
FC : (int) Lower Shift Limit for Ehlrs Modified Fractal Adaptive Moving Average
SC : (int) Upper Shift Limit for Ehlrs Modified Fractal Adaptive Moving Average
a1_t3 : (float) Tillson T3 Volume Factor
fixedTfInput : (bool) Use a fixed time period in Rolling VWAP
daysInput : (int) Days in Rolling VWAP
hoursInput : (int) Hours in Rolling VWAP
minsInput : (int) Minutrs in Rolling VWAP
minBarsInput : (int) Bars in Rolling VWAP
lambda : (float) Regularization Constant in Regularized EMA
volumeWeighted : (bool) Apply volume weighted calculation in selected moving average
gamma_aarma : (float) Gamma for Adaptive Autonomous Recursive Moving Average
smooth : (float) Smooth for Adaptive Least Squares
linweight : (float) Weight for Volume Weighted Moving Average
volatility_lookback : (int) Loopback for Volatility Adjusted Moving Average
jurik_phase : (int) Phase for Jurik Moving Average
jurik_power : (int) Power for Jurik Moving Average
Returns: (float) Moving average
Open Interest Delta with MAs[Binance Perpetuals]!!!!! This indicator only shows Binance Perpetuals Open Interest Delta !!!!!
!!!!! When Binance Spot pair charts is selected, It still shows the perpetual contract Open Interest, if the pair on the chart is tradeble on perpetual contracts. I assume you know what Open Interest is. !!!!!
ZLEMA , Tillson, VAR MAs codes are coming from @KivancOzbilgic => SuperTrended Moving Averages
KAMA code is coming from @HPOTTER => Kaufman Moving Average Adaptive ( KAMA )

MovingAveragesLibraryLibrary "MovingAveragesLibrary"
This is a library allowing one to select between many different Moving Average formulas to smooth out any float variable.
You can use this library to apply a Moving Average function to any series of data as long as your source is a float.
The default application would be for applying Moving Averages onto your chart. However, the scope of this library is beyond that. Any indicator or strategy you are building can benefit from this library.
You can apply different types of smoothing and moving average functions to your indicators, momentum oscillators, average true range calculations, support and resistance zones, envelope bands, channels, and anything you can think of to attempt to smooth out noise while finding a delicate balance against lag.
If you are developing an indicator, you can use the 'ave_func' to allow your users to select any Moving Average for any function or variable by creating an input string with the following structure:
var_name = input.string(, , )
Where the types of Moving Average you would like to be provided would be included in options.
Example:
i_ma_type = input.string(title = "Moving Average Type", defval = "Hull Moving Average", options = )
Where you would add after options the strings I have included for you at the top of the PineScript for your convenience.
Then for the output you desire, simply call 'ave_func' like so:
ma = ave_func(source, length, i_ma_type)
Now the plotted Moving Average will be the same as what you or your users select from the Input.
ema(src, len) Exponential Moving Average.
Parameters:
src : Series to use ('close' is used if no argument is supplied).
len : Lookback length to use.
Returns: Float value.
sma(src, len) Simple Moving Average.
Parameters:
src : Series to use ('close' is used if no argument is supplied).
len : Lookback length to use.
Returns: Float value.
rma(src, len) Relative Moving Average.
Parameters:
src : Series to use ('close' is used if no argument is supplied).
len : Lookback length to use.
Returns: Float value.
wma(src, len) Weighted Moving Average.
Parameters:
src : Series to use ('close' is used if no argument is supplied).
len : Lookback length to use.
Returns: Float value.
dv2(len) Donchian V2 function.
Parameters:
len : Lookback length to use.
Returns: Open + Close / 2 for the selected length.
ModFilt(src, len) Modular Filter smoothing function.
Parameters:
src : Series to use ('close' is used if no argument is supplied).
len : Lookback length to use.
Returns: Float value.
EDSMA(src, len) Ehlers Dynamic Smoothed Moving Average.
Parameters:
src : Series to use ('close' is used if no argument is supplied).
len : Lookback length to use.
Returns: EDSMA smoothing.
dema(x, t) Double Exponential Moving Average.
Parameters:
x : Series to use ('close' is used if no argument is supplied).
t : Lookback length to use.
Returns: DEMA smoothing.
tema(src, len) Triple Exponential Moving Average.
Parameters:
src : Series to use ('close' is used if no argument is supplied).
len : Lookback length to use.
Returns: TEMA smoothing.
smma(x, t) Smoothed Moving Average.
Parameters:
x : Series to use ('close' is used if no argument is supplied).
t : Lookback length to use.
Returns: SMMA smoothing.
vwma(x, t) Volume Weighted Moving Average.
Parameters:
x : Series to use ('close' is used if no argument is supplied).
t : Lookback length to use.
Returns: VWMA smoothing.
hullma(x, t) Hull Moving Average.
Parameters:
x : Series to use ('close' is used if no argument is supplied).
t : Lookback length to use.
Returns: Hull smoothing.
covwma(x, t) Coefficient of Variation Weighted Moving Average.
Parameters:
x : Series to use ('close' is used if no argument is supplied).
t : Lookback length to use.
Returns: COVWMA smoothing.
frama(x, t) Fractal Reactive Moving Average.
Parameters:
x : Series to use ('close' is used if no argument is supplied).
t : Lookback length to use.
Returns: FRAMA smoothing.
kama(x, t) Kaufman's Adaptive Moving Average.
Parameters:
x : Series to use ('close' is used if no argument is supplied).
t : Lookback length to use.
Returns: KAMA smoothing.
donchian(len) Donchian Calculation.
Parameters:
len : Lookback length to use.
Returns: Average of the highest price and the lowest price for the specified look-back period.
tma(src, len) Triangular Moving Average.
Parameters:
src : Series to use ('close' is used if no argument is supplied).
len : Lookback length to use.
Returns: TMA smoothing.
VAMA(src, len) Volatility Adjusted Moving Average.
Parameters:
src : Series to use ('close' is used if no argument is supplied).
len : Lookback length to use.
Returns: VAMA smoothing.
Jurik(src, len) Jurik Moving Average.
Parameters:
src : Series to use ('close' is used if no argument is supplied).
len : Lookback length to use.
Returns: JMA smoothing.
MCG(src, len) McGinley smoothing.
Parameters:
src : Series to use ('close' is used if no argument is supplied).
len : Lookback length to use.
Returns: McGinley smoothing.
zlema(series, length) Zero Lag Exponential Moving Average.
Parameters:
series : Series to use ('close' is used if no argument is supplied).
length : Lookback length to use.
Returns: ZLEMA smoothing.
xema(src, len) Optimized Exponential Moving Average.
Parameters:
src : Series to use ('close' is used if no argument is supplied).
len : Lookback length to use.
Returns: XEMA smoothing.
EhlersSuperSmoother(src, lower) Ehlers Super Smoother.
Parameters:
src : Series to use ('close' is used if no argument is supplied).
lower : Smoothing value to use.
Returns: Ehlers Super smoothing.
EhlersEmaSmoother(sig, smoothK, smoothP) Ehlers EMA Smoother.
Parameters:
sig : Series to use ('close' is used if no argument is supplied).
smoothK : Lookback length to use.
smoothP : Smothing value to use.
Returns: Ehlers EMA smoothing.
ave_func(in_src, in_len, in_type) Returns the source after running it through a Moving Average function.
Parameters:
in_src : Series to use ('close' is used if no argument is supplied).
in_len : Lookback period to be used for the Moving Average function.
in_type : Type of Moving Average function to use. Must have a string input to select the options from that MUST match the type-casing in the function below.
Returns: The source as a float after running it through the Moving Average function.

RedK Volume-Weighted Directional Efficiency Index (DXF)RedK Volume-Weighted Directional Efficiency Index (DXF) is a momentum indicator - that builds on Kaufman's Efficiency Ratio (ER) concept.
DXF utilizes a restricted +100/-100 oscillator to represent the "quality" of a trend, and does a good job in detecting the possibility of an upcoming trend change (in both direction and quality), improving our ability to make decisions on trade entries and exits.
Here's a quick background on Kaufman's Efficiency Ratio (ER)
------------------------------------------------------------------------------- Copied from internet sources -----------------------------
Developed by Perry Kaufman and introduced in his book “New Trading Systems and Methods”, the Efficiency Ratio reflects relative market speed to volatility. There are cases, when it is used as a filter, which helps a trader to avoid ”choppy” markets or trading ranges and to identify smoother trends.
ER is the result of dividing the net change in price movement during n-periods by the sum of all bar-to-bar price changes during the same n-periods. In case the market is trending smoother, then the ratio will be higher. In case the ratio shows readings in proximity to zero, this implies that market movement is inefficient and ”choppy”.
If the Efficiency Ratio shows a reading of +100, this means that the trading instrument is in a bull trend and trending with perfect efficiency.
If the Efficiency Ratio shows a reading of -100, this means that the trading instrument is in a bear trend and trending with perfect efficiency.
It is impossible for any instrument to have a perfect Efficiency ratio, because any movement against the major trend during the examined period of time would cause the ratio to drop.
If the Efficiency Ratio shows a reading above +30 (common setting for the "Significant Level"), this is indicative of a quality bull trend. If the ratio shows a reading below -30, this is indicative of a quality bear trend.
------------------------------------------------------------------------------- End of Copy -------------------------------------------------------------------------------------------------------
Kaufman also used the ER as basis for his famous Kaufman Adaptive Moving Average (KAMA).
Read more on ER & Kama here
How is DXF different from other ER-based indicators?
------------------------------------------------------------------
- Let's get the easy part out of the way: DXF has a "volume-weighting" option ✔
This option is OFF by default (to avoid errors with instruments with no volume data)
- once this option is applied, it provides the benefit of combining the volume effect into the calculation - those who appreciate the effect of volume on price action will hopefully find this option valuable
- The calculation of ER and how it can be "best utilized":
Let's examine the ER concept a bit closer: as a (math) concept, the (original) Efficiency Ratio (ER) takes the positive change of the price of an instrument during a certain period, and divide it by the sum of (absolute) price moves that were observed during that same period.
So, in the trader's language, we will be saying "out of a total of $20 moves (up and down) that MSFT did in the past 10 days, MSFT only made a net change of $5 up during that period" - so the "10-day ER" for MSFT in that case is 5/20 = 25% -- then we continue to observe that ongoing "10-day ER" and if it increases, we can expect that MSFT is going to establish a strong move (trend) up --- right?
the magic word here is to "observe the ongoing ER" - many of the ER based indicators just use the ER as calculated by Kaufman's original method. IMHO, these are just "point-in-time readings" - if we hope to get real insights from the ER, we need to take an average of that reading - for our "time window" we're interested in - and only then we can identify trends and patterns in the ER value as it changes during that windowss- DXF does that - and that allows a trader to say "the (weighted) 5-day average of the 10-day ER for MSFT is increasing, and that why i expect an up-trend" -- makes sense ? both the "Lookback" used to calculate the ER, and the Length of observed "window" for the Average ER are adjustable in DXF settings
Other Uses and Settings :
---------------------------------
- As a momentum indicator, DXF can predict an upcoming change of trend - cause that will reflect on the average ER value. There are few examples in the chart where the price move and ER trend *do not agree* - The trader can see these signs and take decisions accordingly
- DXF can help reveal best entries and exits: assume we are long-term bullish on MSFT, and we want to "buy the dip" - DXF can help reveal the time where price is recovering from extreme weakness - and that would be the ideal buy opportunities for us - exampled marked on the chart
- the Stepping & Smoothing options enable better visualization of the DXF plot. the "raw" DXF is still shown as a silver line.
- The "Significant Levels" option is available and is set to -20/+20 by default .. also adjustable in indicator settings.
- Please use DXF in combination with other trend and volume indicators, and with thorough chart / price action analysis and not in isolation to ensure you get proper signal confirmation for trades. In the chart above, you can see DXF combined with a moving average that can act as a filter and to confirm the price moves.
---------------------------------------------------
As usual, feedback & comments are welcome - if you find this work useful in your trading arsenal, please share a comment - i would be more than happy to learn about that. Good luck!

[kai]MAYou can display various types of moving averages up to 5 lines.
The following moving averages are available
sma, vwma, ema, rma, wma, hma, ssma, jma, dema, tema, trima, t3, tma, lsma, kama, mama, frma, vwap, donchian
The following moving averages are the original moving averages
evma, rvma, wvma, terima, twrima
最大5本までの様々な種類の移動平均線を表示できます
以下の移動平均線が使用可能です
sma, vwma, ema, rma, wma, hma, ssma, jma, dema, tema, trima, t3, tma, lsma, kama, mama, frma, vwap, donchian
以下の移動平均線はオリジナル移動平均線です
evma, rvma, wvma, terima, twrima

BBr1 Candle Range Volitility Gap IndicatorModified Candle Range Volatility Gap Indicator
1. Useful to analyze bars body and wicks and volatility of security.
2. Added a Percentage Option - easier to analyze across different securities.
2. Added a Standard Deviation ("1 std dev= 68.2%, 2 std dev=95.4%, 3 std dev=99.7%, etc") based upon user defined lookback period.
3. Added the ability to include Gaps in Analysis. (Gaps are when the prior closing cost does not equal opening price)
4. Possible Uses setting up stop losses, trailing entries/exits (inside range or outside range).
5. Use it with other indicators in determining if to make an entry or close entry.
Reposted Original Description by © ka66 Kamal Advani
Visually shows the Body Range (open to close) and Candle Range (high to low).
Semi-transparent overlapping area is the full Candle Range, and fully-opaque smaller area is the Body Range. For aesthetics and visual consistency, Candle Range follows the direction of the Body Range, even though technically it's always positive (high - low).
The different plots for each range type also means the UI will allow deselecting one or the other as needed. For example, some strategies may care only about the Body Range, rather than the entire Candle Range, so the latter can be hidden to reduce noise.
Threshold horizontal lines are plotted, so the trader can modify these high and low levels as needed through the user interface. These need to be configured to match the instrument's price range levels for the timeframe. The defaults are pretty arbitrary for +/- 0.0080 (80 pips in a 4-decimal place forex pair). Where a range reaches or exceeds a threshold, it's visually marked as well with a shape at the Body or Candle peak, to assist with quicker visual potential setup scanning, for example, to anticipate a following reversal or continuation.

Log Contract Ln(S/X) [Loxx]A log contract, first introduced by Neuberger (1994) and Neuberger (1996), is not strictly an option. It is, however, an important building block in volatility derivatives (see Chapter 6 as well as Demeterfi, Derman, Kamal, and Zou, 1999). The payoff from a log contract at maturity T is simply the natural logarithm of the underlying asset divided by the strike price, ln(S/ X). The payoff is thus nonlinear and has many similarities with options. The value of this contract is (via "The Complete Guide to Option Pricing Formulas")
L = e^(-r * T) * (log(S/X) + (b-v^2/2)*T)
The delta of a log contract is
delta = (e^(-r*T) / S)
and the gamma is
gamma = (e^(-r*T) / S^2)
Inputs
S = Stock price.
K = Strike price of option.
T = Time to expiration in years.
r = Risk-free rate
c = Cost of Carry
V = Variance of the underlying asset price
cnd1(x) = Cumulative Normal Distribution
nd(x) = Standard Normal Density Function
convertingToCCRate(r, cmp ) = Rate compounder
Numerical Greeks or Greeks by Finite Difference
Analytical Greeks are the standard approach to estimating Delta, Gamma etc... That is what we typically use when we can derive from closed form solutions. Normally, these are well-defined and available in text books. Previously, we relied on closed form solutions for the call or put formulae differentiated with respect to the Black Scholes parameters. When Greeks formulae are difficult to develop or tease out, we can alternatively employ numerical Greeks - sometimes referred to finite difference approximations. A key advantage of numerical Greeks relates to their estimation independent of deriving mathematical Greeks. This could be important when we examine American options where there may not technically exist an exact closed form solution that is straightforward to work with. (via VinegarHill FinanceLabs)
Things to know
Only works on the daily timeframe and for the current source price.
You can adjust the text size to fit the screen
Log Contract Ln(S) [Loxx]A log contract, first introduced by Neuberger (1994) and Neuberger (1996), is not strictly an option. It is, however, an important building block in volatility derivatives (see Chapter 6 as well as Demeterfi, Derman, Kamal, and Zou, 1999). The payoff from a log contract at maturity T is simply the natural logarithm of the underlying asset divided by the strike price, ln(S/ X). The payoff is thus nonlinear and has many similarities with options. The value of this contract is (via "The Complete Guide to Option Pricing Formulas")
L = e^(-r * T) * (log(S/X) + (b-v^2/2)*T)
The delta of a log contract is
delta = (e^(-r*T) / S)
and the gamma is
gamma = (e^(-r*T) / S^2)
An even simpler version of the log contract is when the payoff simply is ln(S). The payoff is clearly still nonlinear in the underlying asset. It follows that the value of this contract is:
L = e^(-r * T) * (log(S) + (b-v^2/2)*T)
The theta/time decay of a log contract is
theta = - 1/T * v^2
and its exposure to the stock price, delta, is
delta = - 2/T * 1/S
This basically tells you that you need to be long stocks to be delta- neutral at any time. Moreover, the gamma is
gamma = 2 / (T * S^2)
b=r options on non-dividend paying stock
b=r-q options on stock or index paying a dividend yield of q
b=0 options on futures
b=r-rf currency options (where rf is the rate in the second currency)
Inputs
S = Stock price.
T = Time to expiration in years.
r = Risk-free rate
c = Cost of Carry
V = volatility of the underlying asset price
cnd1(x) = Cumulative Normal Distribution
nd(x) = Standard Normal Density Function
convertingToCCRate(r, cmp ) = Rate compounder
Numerical Greeks or Greeks by Finite Difference
Analytical Greeks are the standard approach to estimating Delta, Gamma etc... That is what we typically use when we can derive from closed form solutions. Normally, these are well-defined and available in text books. Previously, we relied on closed form solutions for the call or put formulae differentiated with respect to the Black Scholes parameters. When Greeks formulae are difficult to develop or tease out, we can alternatively employ numerical Greeks - sometimes referred to finite difference approximations. A key advantage of numerical Greeks relates to their estimation independent of deriving mathematical Greeks. This could be important when we examine American options where there may not technically exist an exact closed form solution that is straightforward to work with. (via VinegarHill FinanceLabs)
Things to know
Only works on the daily timeframe and for the current source price.
You can adjust the text size to fit the screen

RSI HistogramThis an experiment to visualise the famous RSI indicator within a Histogram.
Opposed to regular RSI this RSI is plotted into a Histogram and uses different scales (100 to -100), in addition it has the ability to smooth the RSI with various moving averages like HMA, JMA and KAMA.
About RSI:
The RSI measures recent performance of a given stock against its own price history performance, by combining the average gain or loss a particular security owns over a predetermined time period.
Bars can be colored in Settings (Disabled by default)
Enjoy and like if you like :)
