MA Suite | Lyro RSMA Suite | Lyro RS
Overview
The MA Suite is a versatile moving average visualization tool designed for traders who demand clarity, flexibility, and actionable market signals. With support for over 16 different moving average types, built-in trend detection, dynamic coloring, and optional support/resistance & rejection markers, it transforms the humble MA into a fully-featured decision-making aid.
Key Features
Multi-Type Moving Averages
Choose from 16 MA calculations including SMA, EMA, WMA, VWMA, HMA, LSMA, FRAMA, KAMA, JMA, T3, and more.
Tailor responsiveness vs. smoothness to your strategy.
Trend Logic Modes
Source Above MA – Colors and signals are based on price position relative to the MA.
Rising MA – Colors and signals are determined by MA slope direction.
Support & Resistance Markers
Plots ▲ for potential support touches.
Plots ▼ for potential resistance touches when price interacts with the MA.
Rejection Signals
Flags bullish rejection when price bounces upward after an MA test.
Flags bearish rejection when price reverses downward after an MA test.
Plotted directly on the chart as labeled markers.
Customizable Color Palettes
Select from Classic, Mystic, Accented, or Royal themes.
Define custom bullish/bearish colors for complete visual control.
Glow & Styling Effects
Multi-layer glow lines around the MA enhance visibility.
Keeps charts clean while improving clarity.
How It Works
MA Calculation – Applies the chosen MA type to your selected price source.
Trend Coloring – Colors switch based on price position or MA slope logic.
Support/Resistance Detection – Identifies MA “touch” events with ▲ or ▼ markers.
Rejection Logic – Detects reversals after MA touches, adding bullish/bearish labels.
Practical Use
Trend Following – In “Source Above MA” mode, use color changes and crossovers to confirm bias.
Dynamic S/R – Use ▲ / ▼ markers to identify support or resistance in trending or ranging markets.
Reversal Opportunities – Monitor rejection labels for potential turning points against prevailing trend.
Customization
Select MA type and length to fine-tune indicator behavior.
Switch between trend modes for different trading styles.
Enable or disable S/R and rejection markers.
Personalize visuals with palette selection or custom colors.
⚠️Disclaimer
This indicator is a tool for technical analysis and does not provide guaranteed results. It should be used in conjunction with other analysis methods and proper risk management practices. The creators of this indicator are not responsible for any financial decisions made based on its signals.
Cerca negli script per "kama"

ai quant oculusAI QUANT OCULUS
Version 1.0 | Pine Script v6
Purpose & Innovation
AI QUANT OCULUS integrates four distinct technical concepts—exponential trend filtering, adaptive smoothing, momentum oscillation, and Gaussian smoothing—into a single, cohesive system that delivers clear, objective buy and sell signals along with automatically plotted stop-loss and three profit-target levels. This mash-up goes beyond a simple EMA crossover or standalone TRIX oscillator by requiring confluence across trend, adaptive moving averages, momentum direction, and smoothed price action, reducing false triggers and focusing on high‐probability turning points.
How It Works & Why Its Components Matter
Trend Filter: EMA vs. Adaptive MA
EMA (20) measures the prevailing trend with fixed sensitivity.
Adaptive MA (also EMA-based, length 10) approximates a faster-responding moving average, standing in for a KAMA-style filter.
Bullish bias requires AMA > EMA; bearish bias requires AMA < EMA. This ensures signals align with both the underlying trend and a more nimble view of recent price action.
Momentum Confirmation: TRIX
Calculates a triple-smoothed EMA of price over TRIX Length (15), then converts it to a percentage rate-of-change oscillator.
Positive TRIX reinforces bullish entries; negative TRIX reinforces bearish entries. Using TRIX helps filter whipsaws by focusing on sustained momentum shifts.
Gaussian Price Smoother
Applies two back-to-back 5-period EMAs to the price (“gaussian” smoothing) to remove short-term noise.
Price above the smoothed line confirms strength for longs; below confirms weakness for shorts. This layer avoids entries on erratic spikes.
Confluence Signals
Buy Signal (isBull) fires only when:
AMA > EMA (trend alignment)
TRIX > 0 (momentum support)
Close > Gaussian (price strength)
Sell Signal (isBear) fires under the inverse conditions.
Requiring all three conditions simultaneously sharply reduces false triggers common to single-indicator systems.
Automatic Risk & Reward Plotting
On each new buy or sell signal (edge detection via not isBull or not isBear ), the script:
Stores entryPrice at the signal bar’s close.
Draws a stop-loss line at entry minus ATR(14) × Stop Multiplier (1.5) by default.
Plots three profit-target lines at entry plus ATR × Target Multiplier (1×, 1.5×, and 2×).
All previous labels and lines are deleted on each new signal, keeping the chart uncluttered and focusing only on the current trade.
Inputs & Customization
Input Description Default
EMA Length Period for the main trend EMA 20
Adaptive MA Length Period for the faster adaptive EM A substitute 10
TRIX Length Period for the triple-smoothed momentum oscillator 15
Dominant Cycle Length (Reserved) 40
Stop Multiplier ATR multiple for stop-loss distance 1.5
Target Multiplier ATR multiple for first profit target 1.5
Show Buy/Sell Signals Toggle on-chart labels for entry signals On
How to Use
Apply to Chart: Best on 15 m–1 h timeframes for swing entries or 5 m for agile scalps.
Wait for Full Confluence:
Look for the AMA to cross above/below the EMA and verify TRIX and Gaussian conditions on the same bar.
A bright “LONG” or “SHORT” label marks your entry.
Manage the Trade:
Place your stop where the red or green SL line appears.
Scale or exit at the three yellow TP1/TP2/TP3 lines, automatically drawn by volatility.
Repeat Cleanly: Each new signal clears prior annotations, ensuring you only track the active setup.
Why This Script Stands Out
Multi-Layer Confluence: Trend, momentum, and noise-reduction must all align, addressing the weaknesses of single-indicator strategies.
Automated Trade Management: No manual plotting—stop and target lines appear seamlessly with each signal.
Transparent & Customizable: All logic is open, adjustable, and clearly documented, allowing traders to tweak lengths and multipliers to suit different instruments.
Disclaimer
No indicator guarantees profit. Always backtest AI QUANT OCULUS extensively, combine its signals with your own analysis and risk controls, and practice sound money management before trading live.

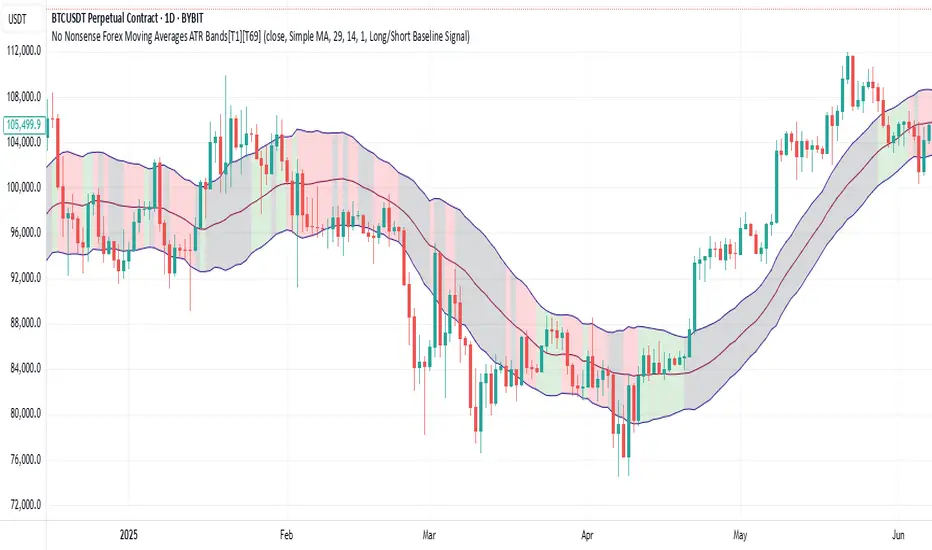
No Nonsense Forex Moving Averages ATR Bands[T1][T69]🔍 Overview
This indicator implements a No Nonsense Forex-style Baseline combined with ATR Bands, built using the moving_averages_library by Teyo69. It plots a configurable moving average and dynamically adjusts upper/lower ATR bands for trade zone detection and baseline confirmation.
✨ Features
30+ Moving Average types
ATR bands to define dynamic trade zones
Visual background highlighting for trade signals
Supports both "Within Range" and "Baseline Bias" display modes
Clean, minimal overlay with effective zone coloring
⚙️ How to Use
Choose MA Type: Select the baseline logic (SMA, EMA, HMA, etc.)
Configure ATR Bands: Adjust the ATR length and multiplier
Select Background Mode:
Within Range: Yellow = price inside band, Gray = outside
Long/Short Baseline Signal: Green = price above baseline, Red = below
Trade Setup:
Use the baseline for trend direction
Wait for confirmation or avoidance when price is outside the band
🛠 Configuration
Source: Price source for MA
MA Type: Any supported MA from the library
MA Length: Number of bars for smoothing
ATR Length: Period for Average True Range
ATR Multiplier: Width of the bands
Background Signal Mode: Choose visual signal type
⚠️ Limitations
Works with one MA at a time
Requires the moving_averages_library imported
Does not include confirmation or exit logic — use with full NNFX stack
💡 Tips
Combine with Volume or Confirmation indicators for NNFX strategy
Use adaptive MAs like KAMA, JMA, or VIDYA for dynamic baselines
Adjust ATR settings based on asset volatility
📘 Credits
Library: Teyo69/moving_averages_library/1
Inspired by: No Nonsense Forex (VP) Baseline + ATR Band methodology & MigthyZinger
Institutional Momentum Scanner [IMS]Institutional Momentum Scanner - Professional Momentum Detection System
Hunt explosive price movements like the professionals. IMS identifies maximum momentum displacement within 10-bar windows, revealing where institutional money commits to directional moves.
KEY FEATURES:
▪ Scans for strongest momentum in rolling 10-bar windows (institutional accumulation period)
▪ Adaptive filtering reduces false signals using efficiency ratio technology
▪ Three clear states: LONG (green), SHORT (red), WAIT (gray)
▪ Dynamic volatility-adjusted thresholds (8% ATR-scaled)
▪ Visual momentum flow with glow effects for signal strength
BASED ON:
- Pocket Pivot concept (O'Neil/Morales) applied to price momentum
- Adaptive Moving Average principles (Kaufman KAMA)
- Market Wizards momentum philosophy
- Institutional order flow patterns (5-day verification window)
HOW IT WORKS:
The scanner finds the maximum price displacement in each 10-bar window - where the market showed its hand. An adaptive filter (5-bar regression) separates real moves from noise. When momentum exceeds the volatility-adjusted threshold, states change.
IDEAL FOR:
- Momentum traders seeking explosive moves
- Swing traders (especially 4H timeframe)
- Position traders wanting institutional footprints
- Anyone tired of false breakout signals
Default parameters (10,5) optimized for 4H charts but adaptable to any timeframe. Remember: The market rewards patience and punishes heroes. Wait for clear signals.
"The market is honest. Are you?"

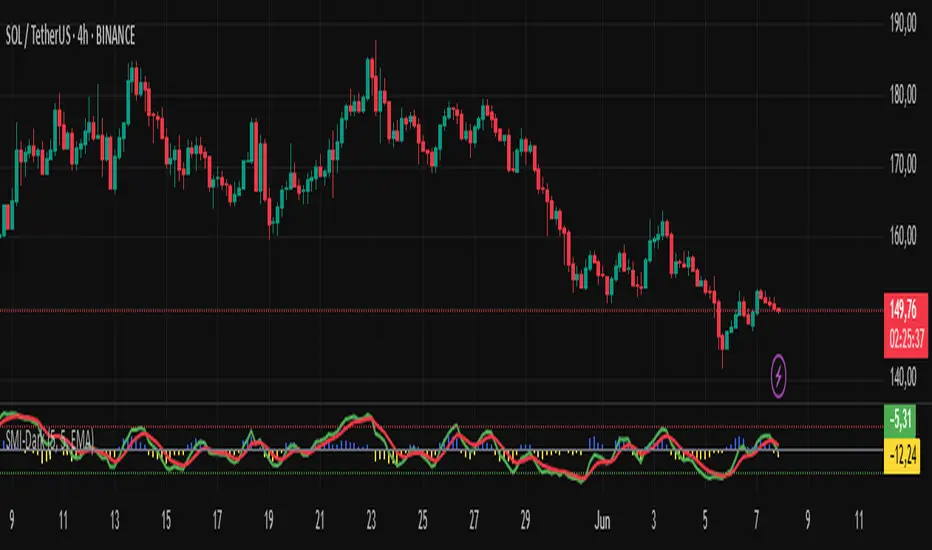
SMI-DarknessIndicator Description: SMI-Darkness
The SMI-Darkness is an indicator based on the Stochastic Momentum Index (SMI), designed to help identify the strength and direction of an asset's trend, as well as potential buy and sell signals. It displays a smoothed SMI using multiple moving average options to customize the indicator’s behavior according to the user’s trading style.
Main Features
Smoothed SMI: Calculates the traditional SMI and smooths it using a user-configurable moving average, improving signal clarity.
Signal Line: Displays a smoothed signal line to identify crossovers with the SMI, generating potential entry or exit points.
Histogram: Shows the difference between the smoothed SMI and the signal line, visually highlighting trend strength. Blue bars indicate buying strength, while yellow bars indicate selling strength.
Horizontal Lines: Includes overbought (+40) and oversold (-40) levels, plus a neutral zero level to aid interpretation.
Indicator Parameters
SMI Short Period: Sets the short period used to calculate the SMI (default 5). Lower periods make the indicator more sensitive.
SMI Signal Period: Sets the period to smooth the signal line (default 5). Adjust to control the signal line's smoothness.
Moving Average Type: Choose the moving average type to smooth the SMI and signal line. Options include:
SMA (Simple Moving Average)
SMMA (Smoothed Moving Average)
EMA (Exponential Moving Average)
WMA (Weighted Moving Average)
HMA (Hull Moving Average)
JMA (Jurik Moving Average) — Note: This is not an original or proprietary moving average but a publicly available open-source version created by TradingView users.
VWMA (Volume-Weighted Moving Average)
KAMA (Kaufman Adaptive Moving Average)
How to Use
Trend Identification: Observe the position of the smoothed SMI relative to the signal line and the histogram values.
When the histogram is positive (blue bars), momentum is bullish.
When the histogram is negative (yellow bars), momentum is bearish.
Buy and Sell Signals:
A crossover of the smoothed SMI above the signal line may indicate a buy signal.
A crossover of the smoothed SMI below the signal line may indicate a sell signal.
Overbought/Oversold Levels:
SMI values above +40 suggest potential overbought conditions, signaling caution on long positions.
Values below -40 suggest potential oversold conditions, indicating possible buying opportunities.
Customization: Adjust the parameters to balance sensitivity and noise, choosing the moving average type that best fits your trading style.
Vix_Fix Enhanced MTF [Cometreon]The VIX Fix Enhanced is designed to detect market bottoms and spikes in volatility, helping traders anticipate major reversals with precision. Unlike standard VIX Fix tools, this version allows you to control the standard deviation logic, switch between chart styles, customize visual outputs, and set up advanced alerts — all with no repainting.
🧠 Logic and Calculation
This indicator is based on Larry Williams' VIX Fix and integrates features derived from community requests/advice, such as inverse VIX logic.
It calculates volatility spikes using a customizable standard deviation of the lows and compares it to a moving high to identify potential reversal points.
All moving average logic is based on Cometreon's proprietary library, ensuring accurate and optimized calculations on all 15 moving average types.
🔷 New Features and Improvements
🟩 Custom Visual Styles
Choose how you want your VIX data displayed:
Line
Step Line
Histogram
Area
Column
You can also flip the orientation (bottom-up or top-down), change the source ticker, and tailor the display to match your charting preferences.
🟩 Multi-MA Standard Deviation Calculation
Customize the standard deviation formula by selecting from 15 different moving averages:
SMA (Simple Moving Average)
EMA (Exponential Moving Average)
WMA (Weighted Moving Average)
RMA (Smoothed Moving Average)
HMA (Hull Moving Average)
JMA (Jurik Moving Average)
DEMA (Double Exponential Moving Average)
TEMA (Triple Exponential Moving Average)
LSMA (Least Squares Moving Average)
VWMA (Volume-Weighted Moving Average)
SMMA (Smoothed Moving Average)
KAMA (Kaufman’s Adaptive Moving Average)
ALMA (Arnaud Legoux Moving Average)
FRAMA (Fractal Adaptive Moving Average)
VIDYA (Variable Index Dynamic Average)
This gives you fine control over how volatility is measured and allows tuning the sensitivity for different market conditions.
🟩 Full Control Over Percentile and Deviation Conditions
You can enable or disable lines for standard deviation and percentile conditions, and define whether you want to trigger on over or under levels — adapting the indicator to your exact logic and style.
🟩 Chart Type Selection
You're no longer limited to candlestick charts! Now you can use Vix_Fix with different chart formats, including:
Candlestick
Heikin Ashi
Renko
Kagi
Line Break
Point & Figure
🟩 Multi-Timeframe Compatibility Without Repainting
Use a different timeframe from your chart with confidence. Signals remain stable and do not repaint. Perfect for spotting long-term reversal setups on lower timeframes.
🟩 Alert System Ready
Configure alerts directly from the indicator’s panel when conditions for over/under signals are met. Stay informed without needing to monitor the chart constantly.
🔷 Technical Details and Customizable Inputs
This indicator includes full control over the logic and appearance:
1️⃣ Length Deviation High - Adjusts the lookback period used to calculate the high deviation level of the VIX logic. Shorter values make it more reactive; longer values smooth out the signal.
2️⃣ Ticker - Choose a different chart type for the calculation, including Heikin Ashi, Renko, Kagi, Line Break, and Point & Figure.
3️⃣ Style VIX - Change the visual style (Line, Histogram, Column, etc.), adjust line width, and optionally invert the display (bottom-to-top).
📌 Fill zones for deviation and percentile are active only in Line and Step Line modes
4️⃣ Use Standard Deviation Up / Down - Enable the overbought and oversold zone logic based on upper and lower standard deviation bands.
5️⃣ Different Type MA (for StdDev) - Choose from 15 different moving averages to define the calculation method for standard deviation (SMA, EMA, HMA, JMA, etc.), with dedicated parameters like Phase, Sigma, and Offset for optimized responsiveness.
6️⃣ BB Length & Multiplier - Adjust the period and multiplier for the standard deviation bands, similar to how Bollinger Bands work.
7️⃣ Show StdDev Up / Down Line - Enable or disable the visibility of upper and lower standard deviation boundaries.
8️⃣ Use Percentile & Length High - Activate the percentile-based logic to detect extreme values in historical volatility using a customizable lookback length.
9️⃣ Highest % / Lowest % - Set the high and low percentile thresholds (e.g., 85 for high, 99 for low) that will be used to trigger over/under signals.
🔟 Show High / Low Percentile Line - Toggle the visual display of the percentile boundaries directly on the chart for clearer signal reference.
1️⃣1️⃣ Ticker Settings – Customize parameters for special chart types such as Renko, Heikin Ashi, Kagi, Line Break, and Point & Figure, adjusting reversal, number of lines, ATR length, etc.
1️⃣2️⃣ Timeframe – Enables using SuperTrend on a higher timeframe.
1️⃣3️⃣ Wait for Timeframe Closes -
✅ Enabled – Displays Vix_Fix smoothly with interruptions.
❌ Disabled – Displays Vix_Fix smoothly without interruptions.
☄️ If you find this indicator useful, leave a Boost to support its development!
Every feedback helps to continuously improve the tool, offering an even more effective trading experience. Share your thoughts in the comments! 🚀🔥

ka66: Triple Keltner Around SourceThis is an indicator-on-indicator which draws Keltner Bands (ATR Bands) around any selected Basis Source, instead of hardcoding a moving average, etc. This allows you to put bands around any sort of esoteric moving average of your choice, or even just around price data like OHLC, HLC3, and so on.
It's an enhancement on my prior Multi ATR Channels script at
Written in Pine v6 and allowing custom timeframe selection.
For example, the published chart shows the bands place around a Kaufman Adaptive Moving Average (KAMA), plotted in blue dots.
You would use it for anything that you would use plain Keltners for:
Mean Reversion
Breakouts
Take Profit and Stop Loss Estimation
But with any basis that you deem more suitable for your purposes.
Moving Average Candles**Moving Average Candles — MA-Based Smoothed Candlestick Overlay**
This script replaces traditional price candles with smoothed versions calculated using various types of moving averages. Instead of plotting raw price data, each OHLC component (Open, High, Low, Close) is independently smoothed using your selected moving average method.
---
### 📌 Features:
- Choose from 13 MA types: `SMA`, `EMA`, `RMA`, `WMA`, `VWMA`, `HMA`, `T3`, `DEMA`, `TEMA`, `KAMA`, `ZLEMA`, `McGinley`, `EPMA`
- Fully configurable moving average length (1–1000)
- Color-coded candles based on smoothed Open vs Close
- Works directly on price charts as an overlay
---
### 🎯 Use Cases:
- Visualize smoothed market structure more clearly
- Reduce noise in price action for better trend analysis
- Combine with other indicators or strategies for confluence
---
> ⚠️ **Note:** Since all OHLC values are based on moving averages, these candles do **not** represent actual market trades. Use them for trend and structure analysis, not trade entries based on precise levels.
---
*Created to support traders seeking a cleaner visual representation of price dynamics.*

Moving Average ToolkitMoving Average Toolkit - Advanced MA Analysis with Flexible Source Input
A powerful and versatile moving average indicator designed for maximum flexibility. Its unique source input feature allows you to analyze moving averages of ANY indicator or price data, making it perfect for creating custom combinations with RSI, Volume, OBV, or any other technical indicator.
Key Features:
• Universal Source Input:
- Analyze moving averages of any data: Price, Volume, RSI, MACD, Custom Indicators
- Perfect for creating advanced technical setups
- Identify trends in any technical data
• 13 Moving Average Types:
- Traditional: SMA, EMA, WMA, RMA, VWMA
- Advanced: HMA, T3, DEMA, TEMA, KAMA, ZLEMA, McGinley, EPMA
• Dual MA System:
- Compare two different moving averages
- Independent settings for each MA
- Perfect for multiple timeframe analysis
• Visual Offset Analysis:
- Dynamic color changes based on momentum
- Fill between current and offset values
- Clear visualization of trend strength
Usage Examples:
• Price Trend: Traditional MA analysis using price data
• Volume Trend: Apply MA to volume for volume trend analysis
• RSI Trend: Smooth RSI movements for clearer signals
• Custom: Apply to any indicator output for unique insights
Settings:
• Fully customizable colors for bull/bear conditions
• Adjustable offset periods
• Independent length settings
• Optional second MA for comparison
Perfect for:
• Advanced technical analysts
• Multi-indicator strategy developers
• Custom indicator creators
• Traders seeking flexible analysis tools
This versatile toolkit goes beyond traditional moving averages by allowing you to apply sophisticated MA analysis to any technical data, creating endless possibilities for custom technical analysis strategies.
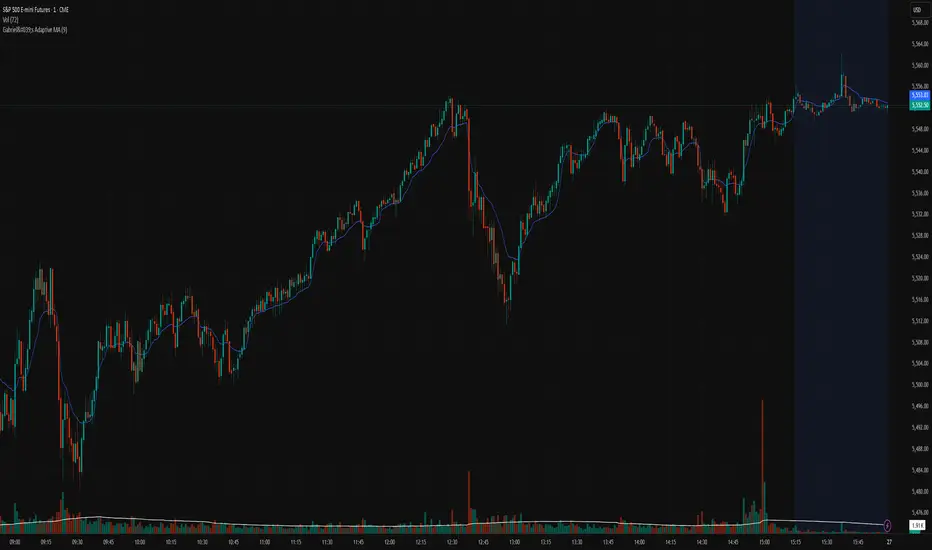
Gabriel's Adaptive MA📜 Gabriel's Adaptive MA — Indicator Description
Gabriel's Adaptive Moving Average (GAMA) is a dynamic trend-following indicator that intelligently adjusts its smoothing based on both trend strength and market volatility.
It is designed to provide faster responsiveness during strong moves while maintaining stability during choppy or consolidating periods.
🧠 What it does:
This indicator plots a custom-built, highly dynamic Moving Average that adapts itself intelligently based on:
Trend Strength (via Perry Kaufman's Efficiency Ratio)
Market Volatility (via Tushar Chande's Volatility Ratio)
It reacts faster when the market is trending strongly and/or highly volatile,
and it smooths out and slows down when the market is choppy or calm.
🔍 How it works (step-by-step):
1. User Inputs:
length: (default 14)
How many bars to look back for calculations.
fastSC: Fastest possible smoothing constant (hardcoded as 2 / (2+1))
slowSC: Slowest possible smoothing constant (hardcoded as 2 / (30+1))
(These are used to control how fast/slow the KAMA can react.)
2. Calculate Trendiness — Kaufman Efficiency Ratio (ER):
Net Change = Absolute difference between current close and close from length bars ago.
Sum of Absolute Changes = Sum of absolute price changes between every bar inside the length window.
Efficiency Ratio (ER) = Net Change divided by Sum of Changes.
✅ If ER is close to 1 → Smooth, trending market.
✅ If ER is close to 0 → Choppy, sideways market.
3. Calculate Bumpiness — Volatility Ratio (VR):
Short-Term Volatility = Standard deviation of close over length.
Long-Term Volatility = Standard deviation of close over length * 2.
Volatility Ratio (VR) = Short-Term Volatility divided by Long-Term Volatility.
✅ If VR is >1 → Market is becoming more volatile recently.
✅ If VR is <1 → Market is calming down.
4. Create the Hybrid Alpha:
Multiply ER × VR.
Then square the result (math.pow(..., 2)).
This hybrid alpha decides how aggressive the MA should be based on both trend and volatility.
If ER and VR are both strong → big alpha → fast movement.
If ER and/or VR are weak → small alpha → slow movement.
5. Calculate the Final Adaptive Smoothing Constant (hybridSC):
hybridSC = slowSC + hybridAlpha × (fastSC - slowSC)
This smoothly interpolates between the slowest and fastest smoothing depending on market conditions.
6. Calculate and Plot the Adaptive MA:
The moving average is manually calculated:
hybridMA := na(hybridMA ) ? close : hybridMA + hybridSC * (close - hybridMA )
It behaves like an EMA but with dynamic smoothing, not a fixed alpha.
✅ If hybridSC is high → MA hugs the price closely.
✅ If hybridSC is low → MA stays smooth and resists noise.
Finally, it plots this Adaptive MA on the chart in blue color.
📊 Visual Summary
Market Type What Happens to GAMA
Trending hard + volatile Follows price quickly
Trending hard + calm Follows steadily but carefully
Sideways + volatile Reacts carefully (won't chase noise)
Sideways + calm Smooths heavily (avoids fakeouts)
✨ Main Strengths:
Adapts automatically without you tuning settings manually every time market changes.
Responds smartly to both trend quality (ER) and market energy (VR).
Reduces lag during real moves.
Filters out false signals during choppy mess.
🧪 Key Innovation compared to normal MAs:
Traditional MA Gabriel's Adaptive MA
Same smoothing every bar Dynamic smoothing every bar
Slow during fast moves Adapts fast during real moves
No understanding of volatility or trendiness Full market sensitivity
⚡ **Simple One-Line Description:**
"Gabriel's Adaptive MA is a dynamic, trend-and-volatility-sensitive moving average that intelligently adjusts its speed to match market conditions."
AllMA Trend Radar [trade_lexx]📈 AllMA Trend Radar is your universal trend analysis tool!
📊 What is AllMA Trend Radar?
AllMA Trend Radar is a powerful indicator that uses various types of Moving Averages (MA) to analyze trends and generate trading signals. The indicator allows you to choose from more than 30 different types of moving averages and adjust their parameters to suit your trading style.
💡 The main components of the indicator
📈 Fast and slow moving averages
The indicator uses two main lines:
- Fast MA (blue line): reacts faster to price changes
- Slow MA (red line): smoother, reflects a long-term trend
The combined use of fast and slow MA allows you to get trend confirmation and entry/exit points from the market.
🔄 Wide range of moving averages
There are more than 30 types of moving averages at your disposal:
- SMA: Simple moving average
- EMA: Exponential moving average
- WMA: Weighted moving average
- DEMA: double exponential MA
- TEMA: triple exponential MA
- HMA: Hull Moving Average
- LSMA: Moving average of least squares
- JMA: Eureka Moving Average
- ALMA: Arnaud Legoux Moving Average
- ZLEMA: moving average with zero delay
- And many others!
🔍 Indicator signals
1️⃣ Fast 🆚 Slow MA signals (intersection and ratio of fast and slow MA)
Up/Down signals (intersection)
- Buy (Up) signal:
- What happens: the fast MA crosses the slow MA from bottom to top
- What does the green triangle with the "Buy" label under the candle look
like - What does it mean: a likely upward trend reversal or an uptrend strengthening
- Sell signal (Down):
- What happens: the fast MA crosses the slow MA from top to bottom
- What does it look like: a red triangle with a "Sell" mark above the candle
- What does it mean: a likely downtrend reversal or an increase in the downtrend
Greater/Less signals (ratio)
- Buy signal (Greater):
- What happens: the fast MA becomes higher than the slow MA
- What does it look like: a green triangle with a "Buy" label under the candle
- What does it mean: the formation or confirmation of an uptrend
- Sell signal (Less):
- What happens: the fast MA becomes lower than the slow MA
- What does it look like: a red triangle with a "Sell" mark above the candle
- What does it mean: the formation or confirmation of a downtrend
2️⃣ Signals ⚡️ Fast MA (fast MA and price)
Up/Down signals (intersection)
- Buy signal (Up Fast):
- What happens: the price crosses the fast MA from bottom to top
- What does it look like: a green triangle with a "Buy" label under the candle
- What does it mean: a short-term price growth signal
- Sell signal (Down Fast):
- What happens: the price crosses the fast MA from top to bottom
- What does it look like: a red triangle with a "Sell" label above the candle
- What does it mean: a short-term price drop signal
Greater/Less signals (ratio)
- Buy signal (Greater Fast):
- What happens: the price is getting higher than the fast MA
- What does it look like: a green triangle with a "Buy" label under the candle
- What does it mean: the price is above the fast MA, which indicates an upward movement
- Sell signal (Less Fast):
- What happens: the price is getting lower than the fast MA
- What does it look like: a red triangle with a "Sell" mark above the candle
- What does it mean: the price is under the fast MA, which indicates a downward movement
3️⃣ Signals 🐢 Slow MA (slow MA and price)
Up/Down signals (intersection)
- Buy signal (Up Slow):
- What happens: the price crosses the slow MA from bottom to top
- What does it look like: a green triangle with a "Buy" label under the candle
- What does it mean: a potential medium-term upward trend reversal
- Sell signal (Down Slow):
- What happens: the price crosses the slow MA from top to bottom
- What does it look like: a red triangle with a "Sell" label above the candle
- What does it mean: a potential medium-term downward trend reversal
Greater/Less signals (ratio)
- Buy signal (Greater Slow):
- What happens: the price is getting above the slow MA
- What does it look like: a green triangle with a "Buy" label under the candle
- What does it mean: the price is above the slow MA, which indicates a strong upward movement
- Sell signal (Less Slow):
- What is happening: the price is getting below the slow MA
- What does it look like: a red triangle with a "Sell" mark above the candle
- What does it mean: the price is under the slow MA, which indicates a strong downward movement
🛠 Filters to filter out false signals
1️⃣ Minimum distance between the signals
- What it does: sets the minimum number of candles between signals of the same type
- Why it is needed: it prevents the appearance of too frequent signals, especially during periods of high volatility
- How to set it up: Set a different value for each signal type (default: 3-5 bars)
- Example: if the value is 3 for Up/Down signals, after the buy signal appears, the next buy signal may appear no earlier than 3 bars later
2️⃣ Advanced indicator filters
🔍 RSI Filter
- What it does: Checks the Relative Strength Index (RSI) value before generating a signal
- Why it is needed: it helps to avoid countertrend entries and catch reversal points
- How to set up:
- For buy signals (🔋 Buy): set the RSI range, usually in the oversold zone (for example, 1-30)
- For sell signals (🪫 Sell): set the RSI range, usually in the overbought zone (for example, 70-100)
- Example: if the RSI = 25 (in the range 1-30), the buy signal will be confirmed
📊 MFI Filter (Cash Flow Index)
- What it does: analyzes volumes and the direction of price movement
- Why it is needed: confirms signals with data on the activity of cash flows
- How to set up:
- For buy signals (🔋 Buy): set the MFI range in the oversold zone (for example, 1-25)
- For sell signals (🪫 Sell): set the MFI range in the overbought zone (for example, 75-100)
- Example: if MFI = 80 (in the range of 75-100), the sell signal will be confirmed
📈 Stochastic Filter
- What it does: analyzes the position of the current price relative to the price range
- Why it is needed: confirms signals based on overbought/oversold conditions
- How to configure:
- You can configure the K Length, D Length and Smoothing parameters
- For buy signals (🔋 Buy): set the stochastic range in the oversold zone (for example, 1-20)
- For sell signals (🪫 Sell): set the stochastic range in the overbought zone (for example, 80-100)
- Example: if stochastic = 15 (is in the range of 1-20), the buy signal will be confirmed
🔌 Connecting to trading strategies
The indicator provides various connectors to connect to your trading strategies.:
1️⃣ Individual connectors for each type of signal
- 🔌Fast vs Slow Up/Down MA Signal🔌: signals for the intersection of fast and slow MA
- 🔌Fast vs Slow Greater/Less MA Signal🔌: signals of the ratio of fast and slow MA
- 🔌Fast Up/Down MA Signal🔌: signals of the intersection of price and fast MA
- 🔌Fast Greater/Less MA Signal🔌: signals of the ratio of price and fast MA
- 🔌Slow Up/Down MA Signal🔌: signals of the intersection of price and slow MA
- 🔌Slow Greater/Less MA Signal🔌: Price versus slow MA signals
2️⃣ Combined connectors
- 🔌Combined Up/Down MA Signal🔌: combines all the crossing signals (Up/Down)
- 🔌Combined Greater/Less MA Signal🔌: combines all the signals of the ratio (Greater/Less)
- 🔌Combined All MA Signals🔌: combines all signals (Up/Down and Greater/Less)
❗️ All connectors return values:
- 1: buy signal
- -1: sell signal
- 0: no signal
📚 How to start using AllMA Trend Radar
1️⃣ Selection of types of moving averages
- Add an indicator to the chart
- Select the type and period for the fast MA (default: DEMA with a period of 14)
- Select the type and period for the slow MA (default: SMA with a period of 14)
- Experiment with different types of MA to find the best combination for your trading style
2️⃣ Signal settings
- Turn on the desired signal types (Up/Down, Greater/Less)
- Set the minimum distance between the signals
- Activate and configure the necessary filters (RSI, MFI, Stochastic)
3️⃣ Checking on historical data
- Analyze how the indicator works based on historical data
- Pay attention to the accuracy of the signals and the presence of false alarms
- Adjust the settings if necessary
4️⃣ Introduction to the trading strategy
- Decide which signals will be used to enter the position.
- Determine which signals will be used to exit the position.
- Connect the indicator to your trading strategy through the appropriate connectors
🌟 Practical application examples
Scalping strategy
- Fast MA: TEMA with a period of 8
- Slow MA: EMA with a period of 21
- Active signals: Fast MA Up/Down
- Filters: RSI (range 1-40 for purchases, 60-100 for sales)
- Signal spacing: 3 bars
Strategy for day trading
- Fast MA: TEMA with a period of 10
- Slow MA: SMA with a period of 20
- Active signals: Fast MA Up/Down and Fast vs Slow Greater/Less
- Filters: MFI (range 1-25 for purchases, 75-100 for sales)
- Signal spacing: 5 bars
Swing Trading Strategy
- Fast MA: DEMA with a period of 14
- Slow MA: VWMA with a period of 30
- Active signals: Fast vs Slow Up/Down and Slow MA Greater/Less
- Filters: Stochastic (range 1-20 for purchases, 80-100 for sales)
- Signal spacing: 8 bars
A strategy for positional trading
- Fast MA: HMA with a period of 21
- Slow MA: SMA with a period of 50
- Active signals: Slow MA Up/Down and Fast vs Slow Greater/Less
- Filters: RSI and MFI at the same time
- The distance between the signals: 10 bars
💡 Tips for using AllMA Trend Radar
1. Select the types of MA for market conditions:
- For trending markets: DEMA, TEMA, HMA (fast MA)
- For sideways markets: SMA, WMA, VWMA (smoothed MA)
- For volatile markets: KAMA, AMA, VAMA (adaptive MA)
2. Combine different types of signals:
- Up/Down signals work better when moving from a sideways trend to a directional
one - Greater/Less signals are optimal for fixing a stable trend
3. Use filters effectively:
- The RSI filter works great in trending markets
- MFI filter helps to confirm the strength of volume movement
- Stochastic filter works well in lateral ranges
4. Adjust the minimum distance between the signals:
- Small values (2-3 bars) for short-term trading
- Average values (5-8 bars) for medium-term trading
- Large values (10+ bars) for long-term trading
5. Use combination connectors:
- For more reliable signals, connect the indicator through the combined connectors
💰 With the AllMA Trend Radar indicator, you get a universal trend analysis tool that can be customized for any trading style and timeframe. The combination of different types of moving averages and advanced filters allows you to significantly improve the accuracy of signals and the effectiveness of your trading strategy!

TTM Squeeze Momentum MTF [Cometreon]TTM Squeeze Momentum MTF combines the core logic of both the Squeeze Momentum by LazyBear and the TTM Squeeze by John Carter into a single, unified indicator. It offers a complete system to analyze the phase, direction, and strength of market movements.
Unlike the original versions, this indicator allows you to choose how to calculate the trend, select from 15 different types of moving averages, customize every parameter, and adapt the visual style to your trading preferences.
If you are looking for a powerful, flexible and highly configurable tool, this is the perfect choice for you.
🔷 New Features and Improvements
🟩 Unified System: Trend Detection + Visual Style
You can decide which logic to use for the trend via the "Show TTM Squeeze Trend" input:
✅ Enabled → Trend calculated using TTM Squeeze
❌ Disabled → Trend based on Squeeze Momentum
You can also customize the visual style of the indicator:
✅ Enable "Show Histogram" for a visual mode using Histogram, Area, or Column
❌ Disable it to display the classic LazyBear-style line
Everything updates automatically and dynamically based on your selection.
🟩 Full Customization
Every base parameter of the original indicator is now fully configurable: lengths, sources, moving average types, and more.
You can finally adapt the squeeze logic to your strategy — not the other way around.
🟩 Multi-MA Engine
Choose from 15 different Moving Averages for each part of the calculation:
SMA (Simple Moving Average)
EMA (Exponential Moving Average)
WMA (Weighted Moving Average)
RMA (Smoothed Moving Average)
HMA (Hull Moving Average)
JMA (Jurik Moving Average)
DEMA (Double Exponential Moving Average)
TEMA (Triple Exponential Moving Average)
LSMA (Least Squares Moving Average)
VWMA (Volume-Weighted Moving Average)
SMMA (Smoothed Moving Average)
KAMA (Kaufman’s Adaptive Moving Average)
ALMA (Arnaud Legoux Moving Average)
FRAMA (Fractal Adaptive Moving Average)
VIDYA (Variable Index Dynamic Average)
🟩 Dynamic Signal Line
Apply a moving average to the momentum for real-time cross signals, with full control over its length and type.
🟩 Multi-Timeframe & Multi-Ticker Support
You're no longer limited to the chart's current timeframe or ticker. Apply the squeeze to any symbol or timeframe without repainting.
🔷 Technical Details and Customizable Inputs
This indicator offers a fully modular structure with configurable parameters for every component:
1️⃣ Squeeze Momentum Settings – Choose the source, length, and type of moving average used to calculate the base momentum.
2️⃣ Trend Mode Selector – Toggle "Show TTM Squeeze Trend" to select the trend logic displayed on the chart:
✅ Enabled – Shows the trend based on TTM Squeeze (Bollinger Bands inside/outside Keltner Channel)
❌ Disabled – Displays the trend based on Squeeze Momentum logic
🔁 The moving average type for the Keltner Channel is handled automatically, so you don't need to select it manually, even if the custom input is disabled.
3️⃣ Signal Line – Toggle the Signal Line on the Squeeze Momentum. Select its length and MA type to generate visual cross signals.
4️⃣ Bollinger Bands – Configure the length, multiplier, source, and MA type used in the bands.
5️⃣ Keltner Channel – Adjust the length, multiplier, source, and MA type. You can also enable or disable the True Range option.
6️⃣ Advanced MA Parameters – Customize the parameters for advanced MAs (JMA, ALMA, FRAMA, VIDYA), including Phase, Power, Offset, Sigma, and Shift values.
7️⃣ Ticker & Input Source – Select the ticker and manage inputs for alternative chart types like Renko, Kagi, Line Break, and Point & Figure.
8️⃣ Style Settings – Choose how the squeeze is displayed:
Enable "Show Histogram" for Histogram, Area, or Column style
Disable it to show the classic LazyBear-style line
Use Reverse Color to invert line colors
Toggle Show Label to highlight Signal Line cross signals
Customize trend colors to suit your preferences
9️⃣ Multi-Timeframe Options - Timeframe – Use the squeeze on higher timeframes for stronger confirmation
🔟 Wait for Timeframe Closes -
✅ Enabled – Prevents multiple signals within the same candle
❌ Disabled – Displays the indicator smoothly without delay
🔧 Default Settings Reference
To replicate the default settings of the original indicators as they appear when first applied to the chart, use the following configurations:
🟩 TTM Squeeze (John Carter Style)
Squeeze
Length: 20
MA Type: SMA
Show TTM Squeeze Trend: Enabled
Bollinger Bands
Length: 20
Multiplier: 2.0
MA Type: SMA
Keltner Channel
Length: 20
Multiplier: 1.0
Use True Range: ON
MA Type: EMA
Style
Show Histogram: Enabled
Reverse Color: Enabled
🟩 Squeeze Momentum (LazyBear Style)
Squeeze
Length: 10
MA Type: SMA
Show TTM Squeeze Trend: Disabled
Bollinger Bands
Length: 20
Multiplier: 1.5
MA Type: SMA
Keltner Channel
Length: 10
Multiplier: 1.5
Use True Range: ON
MA Type: SMA
Style
Show Histogram: Disabled
Reverse Color: Disabled
⚠️ These values are intended as a starting point. The Cometreon indicator lets you fully customize every input to fit your trading style.
🔷 How to Use Squeeze Momentum Pro
🔍 Identifying Trends
Squeeze Momentum Pro supports two different methods for identifying the trend visually, each based on a distinct logic:
Squeeze Momentum Trend (LazyBear-style):
Displays 3 states based on the position of the Bollinger Bands relative to the Keltner Channel:
🔵 Blue = No Squeeze (BB outside KC and KC outside BB)
⚪️ White = Squeeze Active (BB fully inside KC)
⚫️ Gray = Neutral state (none of the above)
TTM Squeeze Trend (John Carter-style):
Calculates the difference in width between the Bollinger Bands and the Keltner Channel:
🟩 Green = BB width is greater than KC → potential expansion phase
🟥 Red = BB are tighter than KC → possible compression or pre-breakout
📈 Interpreting Signals
Depending on the active configuration, the indicator can provide various signals, including:
Trend color → Reflects the current compression/expansion state (based on selected mode)
Momentum value (above or below 0) → May indicate directional pressure
Signal Line cross → Can highlight momentum shifts
Color change in the momentum → May suggest a potential trend reversal
🛠 Integration with Other Tools
Squeeze Momentum Pro works well alongside other indicators to strengthen market context:
✅ Volume Profile / OBV – Helps confirm accumulation or distribution during squeezes
✅ RSI – Useful to detect divergence between momentum and price
✅ Moving Averages – Ideal for defining primary trend direction and filtering signals
☄️ If you find this indicator useful, leave a Boost to support its development!
Every piece of feedback helps improve the tool and deliver an even better trading experience.
🔥 Share your ideas or feature requests in the comments!

SuperTrend MTF Pro [Cometreon]The SuperTrend MTF Pro takes the classic SuperTrend to a whole new level of customization and accuracy. Unlike the standard version, this indicator allows you to select different moving averages, apply it to various chart types, and fine-tune every key parameter.
If you're looking for an advanced, non-repainting, and highly configurable SuperTrend, this is the right choice for you.
🔷 New Features and Improvements
🟩 Multi-MA SuperTrend
Now you can customize the SuperTrend calculation by choosing from 15 different moving averages:
SMA (Simple Moving Average)
EMA (Exponential Moving Average)
WMA (Weighted Moving Average)
RMA (Smoothed Moving Average)
HMA (Hull Moving Average)
JMA (Jurik Moving Average)
DEMA (Double Exponential Moving Average)
TEMA (Triple Exponential Moving Average)
LSMA (Least Squares Moving Average)
VWMA (Volume-Weighted Moving Average)
SMMA (Smoothed Moving Average)
KAMA (Kaufman’s Adaptive Moving Average)
ALMA (Arnaud Legoux Moving Average)
FRAMA (Fractal Adaptive Moving Average)
VIDYA (Variable Index Dynamic Average)
🟩 Multiple Chart Types
You're no longer limited to candlestick charts! Now you can use SuperTrend with different chart formats, including:
Heikin Ashi
Renko
Kagi
Line Break
Point & Figure
🟩 Customizable Timeframe
Now you can adjust the SuperTrend timeframe without repainting issues, avoiding signal distortions.
🔷 Technical Details and Customizable Inputs
SuperTrend offers multiple customization options to fit any trading strategy:
1️⃣ ATR Period – Defines the ATR length, affecting the indicator’s sensitivity.
2️⃣ Source – Selects the price value used for calculations (Close, HL2, Open, etc.).
3️⃣ ATR Mult – Multiplies the ATR to determine band distance. Higher values reduce false signals, lower values make it more reactive.
4️⃣ Change ATR Calculation Method – When enabled, uses the default ATR method; when disabled, allows selecting another Moving Average with "Use Different Type".
5️⃣ Source Break – Defines the price source for trend changes (Close for more stability, High/Low for more reactivity).
6️⃣ Use Different Type – Allows selecting an alternative Moving Average for ATR calculation if "Change ATR Calculation Method" is disabled.
7️⃣ SuperTrend Type – Advanced options for specific MAs (JMA, ALMA, FRAMA, VIDYA), with dedicated parameters like Phase, Sigma, and Offset for optimized responsiveness.
8️⃣ Ticker Settings – Customize parameters for special chart types such as Renko, Heikin Ashi, Kagi, Line Break, and Point & Figure, adjusting reversal, number of lines, and ATR length.
9️⃣ Timeframe – Enables using SuperTrend on a higher timeframe.
🔟 Wait for Timeframe Closes -
✅ Enabled – Prevents multiple signals, useful for precise alerts.
❌ Disabled – Displays SuperTrend smoothly without interruptions.
🔷 How to Use SuperTrend MTF Pro
🔍 Identifying Trends
SuperTrend follows the ongoing trend and provides clear visual signals:
When the price is above the line, the trend is bullish.
When the price is below the line, the trend is bearish.
📈 Interpreting Signals
Line color and position change → Possible trend reversal
Bounce off the line → Potential trend continuation
Strong breakout of the line → Possible reversal
🛠 Integration with Other Tools
RSI or MACD to filter false signals
Moving Averages to confirm trend direction
Support and Resistance to improve entry points
☄️ If you find this indicator useful, leave a Boost to support its development!
Every feedback helps to continuously improve the tool, offering an even more effective trading experience. Share your thoughts in the comments! 🚀🔥

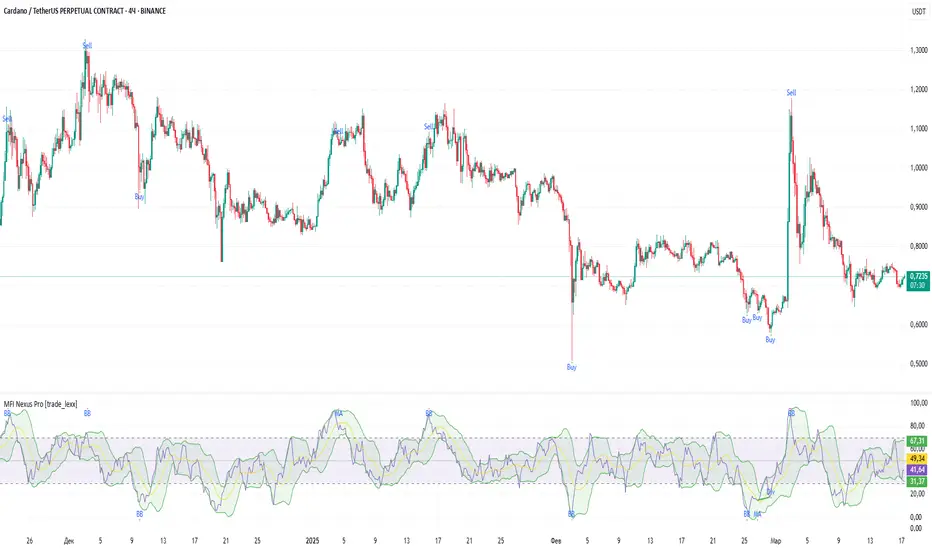
MFI Nexus Pro [trade_lexx]📈 MFI Nexus Pro is your reliable trading assistant!
📊 What is MFI Nexus Pro ?
MFI Nexus Pro is a trading indicator that analyzes cash flows in the market. It shows where money is moving — into or out of an asset, and based on this, generates buy or sell signals.
💡 The main components of the indicator
📊 The MFI Cash Flow Index (MFI)
shows the strength of cash flow into an asset. Values above 70 indicate overbought (an early sale is possible), and values below 30 indicate oversold (an early purchase is possible).
📈 Moving Averages (MA)
The indicator uses 10 different types of moving averages to smooth the MFI line.:
- SMA: Simple moving average
- EMA: Exponential moving average
- WMA: Weighted moving average
And other more complex types (HMA, KAMA, VWMA, ALMA, TEMA, ZLEMA, DEMA)
The choice of the type of moving average affects the speed of the indicator's response to market changes.
🎯 Bollinger Bands (BB)
Bands around the moving average that widen and narrow depending on volatility. They help determine when the MFI is out of the normal range.
🔄 Divergences
Divergences show discrepancies between price and MFI:
- Bullish divergence: the price is falling and the MFI is rising — an upward reversal is possible
- Bearish divergence: the price is rising and the MFI is falling — a downward reversal is possible
🔍 Indicator signals
1️⃣ Moving average signals (MA)
Buy signal
- What happens: MFI crosses its moving average from bottom to top
- What does it look like: the green triangle labeled "MA" under the chart
- What does it mean: money begins to actively flow into the asset, price growth is possible
Sell signal
- What happens: the MFI crosses the moving average from top to bottom
- What does it look like: a red triangle with the label "MA" above the chart
- What does it mean: money starts to leave the asset, the price may fall
2️⃣ Bollinger Band Signals (BB)
Buy signal
- What's happening: The MFI crosses the lower Bollinger band from bottom to top
- What it looks like: the green triangle marked "BB"
- What it means: The MFI was too low and is now starting to recover
Sell Signal
- What's going on: MFI crosses the upper Bollinger band from top to bottom
- What it looks like: a red triangle marked "BB"
- What it means: The MFI was too high and is now starting to decline
3️⃣ Divergence Signals (Div)
Buy Signal (Bullish Divergence)
- What's going on: the price is falling more than the MFI
- What it looks like: a green triangle marked "Div"
- What it means: despite the fall in price, money is already starting to return to the asset
Sell signal (bearish divergence)
- What is happening: the price is rising more strongly than the MFI
- What does it look like: the red triangle with the label "Div"
- What does it mean: despite the price increase, money is already starting to leave the asset
🛠️ Filters to filter out false signals
1️⃣ Minimum distance between the signals
- What it does: sets the minimum number of candles between signals
- Why it is needed: prevents signals from being too frequent during strong market fluctuations
- How to set it up: Set the number from 0 and above (default: 5)
2️⃣ "Waiting for the opposite signal" mode
- What it does: waits for a signal in the opposite direction before generating a new signal
- Why you need it: it helps you not to miss important trend reversals
- How to set up: just turn the function on or off
3️⃣ Filter by MFI levels
- What it does: generates signals only when the MFI is in the specified ranges
- Why it is needed: it helps to catch the moments when the market is oversold or overbought
- How to set up:
- For buy signals: set a range for oversold (e.g. 1-30)
- For sell signals: set a range for overbought (e.g. 70-100)
4️⃣ The RSI filter
- What it does: additionally checks the RSI values to confirm the signals
- Why it is needed: adds additional confirmation from another popular indicator
- How to set up: Similar to the MFI filter, set ranges for buying and selling
🔄 Signal combination modes
1️⃣ Normal mode ("None")
- How it works: all signals (MA, BB, Div) work independently of each other
- When to use it: for general market analysis or when learning how to work with the indicator
2️⃣ "And" mode ("MA and BB and Div")
- How it works: the alarm appears only when several conditions are triggered simultaneously
- Combination options:
- MA+BB: signals from the moving average and Bollinger bands
- MA+Div: signals from the moving average and divergence
- BB+Div: signals from the Bollinger bands and divergence
- MA+BB+Div: all three signals simultaneously
- When to use: for more reliable but rare signals
3️⃣ "OR" mode ("MA or BB or Div")
- How it works: the alarm appears when any of the conditions are triggered
- When to use: for frequent signals when you don't want to miss any opportunity.
🔌 Connecting to trading strategies
The indicator can be connected to your trading strategies using 5 different channels.:
1. Channel for MA signals: connects only signals from moving averages
2. BB signal channel: connects only the signals from the Bollinger bands
3. Channel for divergence signals: connects only divergence signals
4. Channel for "And" mode: connects only combined signals
5. Channel for "OR" mode: connects signals from any source
🔔 Setting up alerts
The indicator can send alerts when alarms appear.:
- Alerts for MA: when the MFI crosses the moving average
- Alerts for BB: when the MFI crosses the Bollinger bands
- Divergence alerts: when a divergence is detected
- Combined alerts: for "AND" and "OR" modes
🎭 What does the indicator look like on the chart ?
- MFI main line: purple line
- Overbought/oversold levels: horizontal lines at levels 30 and 70
- Middle line: dotted line at level 50
- MFI Moving Average: yellow line
- Bollinger bands: green lines around the moving average
- Signals: green and red triangles with corresponding labels
📚 How to start using MFI Nexus Pro
1️⃣ Initial setup
- Add an indicator to your chart
- Select the type of moving average and the period (you can leave it as the default)
- Activate the desired signal types (MA, BB, Div)
2️⃣ Filter settings
- Set the distance between the signals to get rid of unnecessary noise
- Adjust the MFI and RSI levels depending on how volatile your asset is
- If you need more reliable signals, turn on the "Waiting for the opposite signal" mode.
3️⃣ Operation mode selection
- First, use the standard mode to see all possible signals.
- When you get comfortable, try the "And" mode for more reliable signals.
- For active trading, you can use the "OR" mode
4️⃣ Setting up Alerts
- Select the types of signals you want to be notified about
- Set up alerts for "AND" or "OR" modes if you use them
5️⃣ Verification and adaptation
- Check the operation of the indicator on historical data
- Adjust the parameters for a specific asset
- Adapt the settings to your trading style
🌟 Usage examples
For trend trading
- Use MA signals in the direction of the main trend
- Turn on the "Waiting for the opposite signal" mode
- Set stricter levels for filters
For trading in a sideways range
- Use BB signals to detect bounces from the range boundaries
- Use the MFI level filter to confirm overbought/oversold conditions
- Adjust the Bollinger bands according to the width of the range
To determine the pivot points
- Pay attention to the divergence signals
- Use the "And" mode by combining divergences with other signals
- Check the RSI filter for additional confirmation
Cometreon_Public📚 Cometreon Public Library – Advanced Functions for Pine Script
This library contains advanced functions used in my public indicators on TradingView. The goal is to make the code more modular and efficient, allowing users to call pre-built functions for complex calculations without rewriting them from scratch.
🔹 Currently Available Functions:
1️⃣ Moving Average Function – Provides multiple types of moving averages to choose from, including:
SMA (Simple Moving Average)
EMA (Exponential Moving Average)
WMA (Weighted Moving Average)
RMA (Smoothed Moving Average)
HMA (Hull Moving Average)
JMA (Jurik Moving Average)
DEMA (Double Exponential Moving Average)
TEMA (Triple Exponential Moving Average)
LSMA (Least Squares Moving Average)
VWMA (Volume-Weighted Moving Average)
SMMA (Smoothed Moving Average)
KAMA (Kaufman’s Adaptive Moving Average)
ALMA (Arnaud Legoux Moving Average)
FRAMA (Fractal Adaptive Moving Average)
VIDYA (Variable Index Dynamic Average)
2️⃣ Custom RSI – Uses the Moving Average function to modify the calculation method, with an additional option for a dynamic version.
3️⃣ Custom MACD – Uses the Moving Average function to modify the calculation method, with an additional option for a dynamic version.
4️⃣ Custom Alligator – Uses the Moving Average function to modify generic calculations, allowing users to change the calculation method.

[GYTS] FiltersToolkit LibraryFiltersToolkit Library
🌸 Part of GoemonYae Trading System (GYTS) 🌸
🌸 --------- 1. INTRODUCTION --------- 🌸
💮 What Does This Library Contain?
This library is a curated collection of high-performance digital signal processing (DSP) filters and auxiliary functions designed specifically for financial time series analysis. It includes a shortlist of our favourite and best performing filters — each rigorously tested and selected for their responsiveness, minimal lag and robustness in diverse market conditions. These tools form an integral part of the GoemonYae Trading System (GYTS), chosen for their unique characteristics in handling market data.
The library contains two main categories:
1. Smoothing filters (low-pass filters and moving averages) for e.g. denoising, trend following
2. Detrending tools (high-pass and band-pass filters, known as "oscillators") for e.g. mean reversion
This collection is finely tuned for practical trading applications and is therefore not meant to be exhaustive. However, will continue to expand as we discover and validate new filtering techniques. I welcome collaboration and suggestions for novel approaches.
🌸 ——— 2. ADDED VALUE ——— 🌸
💮 Unified syntax and comprehensive documentation
The FiltersToolkit Library brings together a wide array of valuable filters under a unified, intuitive syntax. Each function is thoroughly documented, with clear explanations and academic sources that underline the mathematical rigour behind the methods. This level of documentation not only facilitates integration into trading strategies but also helps underlying the underlying concepts and rationale.
💮 Optimised performance and readability
The code prioritizes computational efficiency while maintaining readability. Key optimizations include:
- Minimizing redundant calculations in recursive filters
- Smart coefficient caching
- Efficient state management
- Vectorized operations where applicable
💮 Enhanced functionality and flexibility
Some filters in this library introduce extended functionality beyond the original publications. For instance, the MESA Adaptive Moving Average (MAMA) and Ehlers’ Combined Bandpass Filter incorporate multiple variations found in the literature, thereby providing traders with flexible tools that can be fine-tuned to different market conditions.
🌸 ——— 3. THE FILTERS ——— 🌸
💮 Hilbert Transform Function
This function implements the Hilbert Transform as utilised by John Ehlers. It converts a real-valued time series into its analytic signal, enabling the extraction of instantaneous phase and frequency information—an essential step in adaptive filtering.
Source: John Ehlers - "Rocket Science for Traders" (2001), "TASC 2001 V. 19:9", "Cybernetic Analysis for Stocks and Futures" (2004)
💮 Homodyne Discriminator
By leveraging the Hilbert Transform, this function computes the dominant cycle period through a Homodyne Discriminator. It extracts the in-phase and quadrature components of the signal, facilitating a robust estimation of the underlying cycle characteristics.
Source: John Ehlers - "Rocket Science for Traders" (2001), "TASC 2001 V. 19:9", "Cybernetic Analysis for Stocks and Futures" (2004)
💮 MESA Adaptive Moving Average (MAMA)
An advanced dual-stage adaptive moving average, this function outputs both the MAMA and its companion FAMA. It combines adaptive alpha computation with elements from Kaufman’s Adaptive Moving Average (KAMA) to provide a responsive and reliable trend indicator.
Source: John Ehlers - "Rocket Science for Traders" (2001), "TASC 2001 V. 19:9", "Cybernetic Analysis for Stocks and Futures" (2004)
💮 BiQuad Filters
A family of second-order recursive filters offering exceptional control over frequency response:
- High-pass filter for detrending
- Low-pass filter for smooth trend following
- Band-pass filter for cycle isolation
The quality factor (Q) parameter allows fine-tuning of the resonance characteristics, making these filters highly adaptable to different market conditions.
Source: Robert Bristow-Johnson's Audio EQ Cookbook, implemented by @The_Peaceful_Lizard
💮 Relative Vigor Index (RVI)
This filter evaluates the strength of a trend by comparing the closing price to the trading range. Operating similarly to a band-pass filter, the RVI provides insights into market momentum and potential reversals.
Source: John Ehlers – “Cybernetic Analysis for Stocks and Futures” (2004)
💮 Cyber Cycle
The Cyber Cycle filter emphasises market cycles by smoothing out noise and highlighting the dominant cyclical behaviour. It is particularly useful for detecting trend reversals and cyclical patterns in the price data.
Source: John Ehlers – “Cybernetic Analysis for Stocks and Futures” (2004)
💮 Butterworth High Pass Filter
Inspired by the classical Butterworth design, this filter achieves a maximally flat magnitude response in the passband while effectively removing low-frequency trends. Its design minimises phase distortion, which is vital for accurate signal interpretation.
Source: John Ehlers – “Cybernetic Analysis for Stocks and Futures” (2004)
💮 2-Pole SuperSmoother
Employing a two-pole design, the SuperSmoother filter reduces high-frequency noise with minimal lag. It is engineered to preserve trend integrity while offering a smooth output even in noisy market conditions.
Source: John Ehlers – “Cybernetic Analysis for Stocks and Futures” (2004)
💮 3-Pole SuperSmoother
An extension of the 2-pole design, the 3-pole SuperSmoother further attenuates high-frequency noise. Its additional pole delivers enhanced smoothing at the cost of slightly increased lag.
Source: John Ehlers – “Cybernetic Analysis for Stocks and Futures” (2004)
💮 Adaptive Directional Volatility Moving Average (ADXVma)
This adaptive moving average adjusts its smoothing factor based on directional volatility. By combining true range and directional movement measurements, it remains exceptionally flat during ranging markets and responsive during directional moves.
Source: Various implementations across platforms, unified and optimized
💮 Ehlers Combined Bandpass Filter with Automated Gain Control (AGC)
This sophisticated filter merges a highpass pre-processing stage with a bandpass filter. An integrated Automated Gain Control normalises the output to a consistent range, while offering both regular and truncated recursive formulations to manage lag.
Source: John F. Ehlers – “Truncated Indicators” (2020), “Cycle Analytics for Traders” (2013)
💮 Voss Predictive Filter
A forward-looking filter that predicts future values of a band-limited signal in real time. By utilising multiple time-delayed feedback terms, it provides anticipatory coupling and delivers a short-term predictive signal.
Source: John Ehlers - "A Peek Into The Future" (TASC 2019-08)
💮 Adaptive Autonomous Recursive Moving Average (A2RMA)
This filter dynamically adjusts its smoothing through an adaptive mechanism based on an efficiency ratio and a dynamic threshold. A double application of an adaptive moving average ensures both responsiveness and stability in volatile and ranging markets alike. Very flat response when properly tuned.
Source: @alexgrover (2019)
💮 Ultimate Smoother (2-Pole)
The Ultimate Smoother filter is engineered to achieve near-zero lag in its passband by subtracting a high-pass response from an all-pass response. This creates a filter that maintains signal fidelity at low frequencies while effectively filtering higher frequencies at the expense of slight overshooting.
Source: John Ehlers - TASC 2024-04 "The Ultimate Smoother"
Note: This library is actively maintained and enhanced. Suggestions for additional filters or improvements are welcome through the usual channels. The source code contains a list of tested filters that did not make it into the curated collection.
Market StructureThis is an advanced, non-repainting Market Structure indicator that provides a robust framework for understanding market dynamics across any timeframe and instrument.
Key Features:
- Non-repainting market structure detection using swing highs/lows
- Clear identification of internal and general market structure levels
- Breakout threshold system for structure adjustments
- Integrated multi-timeframe compatibility
- Rich selection of 30+ moving average types, from basic to advanced adaptive variants
What Makes It Different:
Unlike most market structure indicators that repaint or modify past signals, this implementation uses a fixed-length lookback period to identify genuine swing points.
This means once a structure level or pivot is identified, it stays permanent - providing reliable signals for analysis and trading decisions.
The indicator combines two layers of market structure:
1. Internal Structure (lighter lines) - More sensitive to local price action
2. General Structure (darker lines) - Shows broader market context
Technical Details:
- Uses advanced pivot detection algorithm with customizable swing size
- Implements consecutive break counting for structure adjustments
- Supports both close and high/low price levels for breakout detection
- Includes offset option for better visual alignment
- Each structure break is validated against multiple conditions to prevent false signals
Offset on:
Offset off:
Moving Averages Library:
Includes comprehensive selection of moving averages, from traditional to advanced adaptive types:
- Basic: SMA, EMA, WMA, VWMA
- Advanced: KAMA, ALMA, VIDYA, FRAMA
- Specialized: Hull MA, Ehlers Filter Series
- Adaptive: JMA, RPMA, and many more
Perfect for:
- Price action analysis
- Trend direction confirmation
- Support/resistance identification
- Market structure trading strategies
- Multiple timeframe analysis
This open-source tool is designed to help traders better understand market dynamics and make more informed trading decisions. Feel free to use, modify, and enhance it for your trading needs.

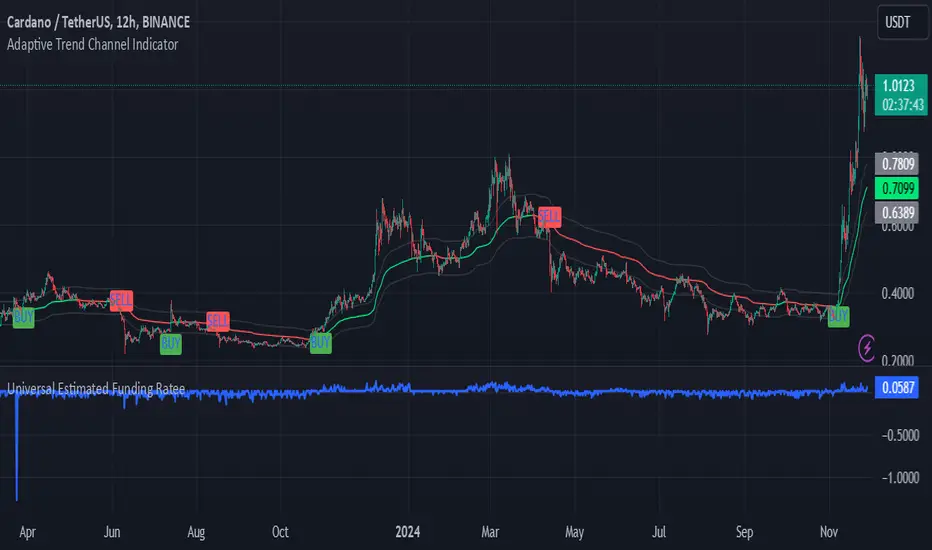
Adaptive Trend Channel IndicatorThe Adaptive Trend Channel Indicator is a trend-following tool designed to help traders identify buy and sell opportunities by analyzing price action in relation to a dynamic basis line with a customizable buffer zone. This indicator leverages an adaptive moving average to create a responsive trend line, providing insight into market direction and trend strength.
How It Works:
Dynamic Basis Calculation: Using a modified Kaufman’s Adaptive Moving Average (KAMA), the indicator calculates a basis line that adapts to price volatility. The basis line turns green during bullish trends and red during bearish trends, helping to visualize market sentiment.
Buffer Zone for Entry Signals: A buffer zone is calculated around the basis line to filter out false signals in low-volatility or sideways markets. Buy and sell signals are generated only when the price moves beyond this buffer zone, enhancing signal accuracy and reducing noise.
Non-Consecutive Signal Logic: To avoid over-trading, the indicator is programmed to prevent consecutive buy or sell signals in the same direction. This ensures that a new buy signal is only issued after a sell signal, and vice versa, for improved control in trending conditions.
Real-Time Alerts: The indicator issues real-time "Buy" and "Sell" alerts as soon as conditions are met, without waiting for the candle to close. This feature is particularly beneficial for intraday and scalping strategies, where timely entries are crucial.
How to Use:
Buy Signal: A buy signal appears when the basis line is green, and the price moves above the upper buffer zone, indicating a potential uptrend.
Sell Signal: A sell signal appears when the basis line is red, and the price falls below the lower buffer zone, signaling a potential downtrend.
The buffer zone’s sensitivity can be adjusted to adapt the indicator to different trading environments and personal risk tolerance.
Disclaimer: This indicator is designed to support your trading decisions and is best used in combination with other technical analysis tools. It is not intended as standalone financial advice.
Multi-Average Trend Indicator (MATI)[FibonacciFlux]Multi-Average Trend Indicator (MATI)
Overview
The Multi-Average Trend Indicator (MATI) is a versatile technical analysis tool designed for traders who aim to enhance their market insights and streamline their decision-making processes across various timeframes. By integrating multiple advanced moving averages, this indicator serves as a robust framework for identifying market trends, making it suitable for different trading styles—from scalping to swing trading.
MATI 4-hourly support/resistance
MATI 1-hourly support/resistance
MATI 15 minutes support/resistance
MATI 1 minutes support/resistance
Key Features
1. Diverse Moving Averages
- COVWMA (Coefficient of Variation Weighted Moving Average) :
- Provides insights into price volatility, helping traders identify the strength of trends in fast-moving markets, particularly useful for 1-minute scalping .
- DEMA (Double Exponential Moving Average) :
- Minimizes lag and quickly responds to price changes, making it ideal for capturing short-term price movements during volatile trading sessions .
- EMA (Exponential Moving Average) :
- Focuses on recent price action to indicate the prevailing trend, vital for day traders looking to enter positions based on current momentum.
- KAMA (Kaufman's Adaptive Moving Average) :
- Adapts to market volatility, smoothing out price action and reducing false signals, which is crucial for 4-hour day trading strategies.
- SMA (Simple Moving Average) :
- Provides a foundational view of the market trend, useful for swing traders looking at overall price direction over longer periods.
- VIDYA (Variable Index Dynamic Average) :
- Adjusts based on market conditions, offering a dynamic perspective that can help traders capture emerging trends.
2. Combined Moving Average
- The MATI's combined moving average synthesizes all individual moving averages into a single line, providing a clear and concise summary of market direction. This feature is especially useful for identifying trend continuations or reversals across various timeframes .
3. Dynamic Color Coding
- Each moving average is visually represented with color coding:
- Green indicates bullish conditions, while Red suggests bearish trends.
- This visual feedback allows traders to quickly assess market sentiment, facilitating faster decision-making.
4. Signal Generation and Alerts
- The indicator generates buy signals when the combined moving average crosses above its previous value, indicating a potential upward trend—ideal for quick entries in scalping.
- Conversely, sell signals are triggered when the combined moving average crosses below its previous value, useful for exiting positions or entering short trades.
Insights and Applications
1. Scalping on 1-Minute Charts
- The MATI excels in fast-paced environments, allowing scalpers to identify quick entry and exit points based on short-term trends. With dynamic signals and alerts, traders can react swiftly to price movements, maximizing profit potential in brief price fluctuations.
2. Day Trading on 4-Hour Charts
- For day traders, the MATI provides essential insights into intraday trends. By analyzing the combined moving average and its relation to individual moving averages, traders can make informed decisions on when to enter or exit positions, capitalizing on daily price swings.
3. Swing Trading on Daily Charts
- The MATI also serves as a valuable tool for swing traders. By evaluating longer-term trends through the combined moving average, traders can identify potential swing points and adjust their strategies accordingly. The flexibility of adjusting the lengths of the moving averages allows for tailored approaches based on market volatility.
Benefits
1. Clarity and Insight
- The combination of diverse moving averages offers a clear visual representation of market trends, aiding traders in making informed decisions across multiple timeframes.
2. Flexibility and Customization
- With adjustable parameters, traders can adapt the MATI to their specific strategies, making it suitable for various market conditions and trading styles.
3. Real-Time Alerts and Efficiency
- Built-in alerts minimize response times, allowing traders to capitalize on opportunities as they arise, regardless of their trading style.
Conclusion
The Multi-Average Trend Indicator (MATI) is an essential tool for traders seeking to enhance their technical analysis capabilities. By seamlessly integrating multiple moving averages with dynamic color coding and real-time alerts, this indicator provides a comprehensive approach to understanding market trends. Its versatility makes it an invaluable asset for scalpers, day traders, and swing traders alike.
Important Note
As with any trading tool, thorough analysis and risk management are crucial when using this indicator. Past performance does not guarantee future results, and traders should always be prepared for market fluctuations.

Fourier Transformed & Kalman Filtered EMA Crossover [Mattes]The Fourier Transformed & Kalman Filtered EMA Crossover (FTKF EMAC) is a trend-following indicator that leverages Fourier Transform approximation, Kalman Filtration, and two Exponential Moving Averages (EMAs) of different lengths to provide accurate and smooth market trend signals. By combining these three components, it captures the underlying market cycles, reduces noise, and produces actionable insights, making it suitable for detecting both emerging trends and confirming existing ones.
TECHNICALITIES:
>>> The Fourier Transform approximation is designed to identify dominant cyclical patterns in price action by focusing on key frequencies, while filtering out noise and less significant movements. It emphasizes the most meaningful price cycles, enabling the indicator to isolate important trends while ignoring minor fluctuations. This cyclical awareness adds an extra layer of depth to trend detection, allowing the EMAs to work with a cleaner and more reliable data set.
>>> The Kalman Filter adds dynamic noise reduction, adjusting its predictions of future price trends based on past and current data. As new price data comes in, the filter recalibrates itself to ensure that the price action remains smooth and devoid of erratic movements. This real-time adjustment is key to minimizing lag while avoiding false signals, which ensures that the EMAs react to more accurate and stable market data. The Kalman Filter’s ability to smooth price data without losing sensitivity to trend changes complements the Fourier approximation, ensuring a high level of precision in volatile and stable market environments.
>>> The EMA Crossover involves using two EMAs: a shorter EMA that reacts quickly to price movements and a longer EMA that responds more slowly. The shorter EMA is responsible for capturing immediate market shifts, detecting potential bullish or bearish trends. The longer EMA smooths out price fluctuations and provides trend confirmation, working with the shorter EMA to ensure the signals are reliable. When the shorter EMA crosses above the longer EMA, it indicates a bullish trend, likewise when it goes below the longer EMA, it signals a bearish trend. This setup provides a clear way to track market direction, with color-coded signals (green for bullish, red for bearish) for visual clarity. The flexibility of adjusting the EMA periods allows traders to fine-tune the indicator to their preferred timeframe and strategy, making it adaptable to different market conditions.
|-> A key technical aspect is that the first EMA should always be shorter than the second one. If the first EMA is longer than the second, the tool’s effectiveness is compromised because the faster EMA is designed to signal long conditions, while the longer one is made for signaling a bearish trend. Reversing their roles would lead to delayed or confused signals, reducing the indicator’s ability to detect trend shifts early and making it less efficient in volatile markets. This is the only key weakness of the indicator, failure to submit to this rule will result in confusion.
>>> These components work together like a clock to create a comprehensive and effective trend-following system. The Fourier approximation highlights key cyclical movements, the Kalman Filter refines these movements by removing noise, and the EMAs interpret the filtered data to generate actionable trend signals. Each component enhances the next, ensuring that the final output is both responsive and reliable, with minimal false signals or lag. creating an indicator using widespread concepts which haven't been combined before.
Summary
This indicator combines Fourier Transform approximation, Kalman Filtration, and two EMAs of different lengths to deliver accurate and timely trend-following signals. The Fourier approximation identifies dominant market cycles, while the Kalman Filter dynamically removes noise and refines the price data in real time. The two EMAs then use this filtered data to generate buy and sell signals based on their crossovers. The shorter EMA reacts quickly to price changes, while the longer EMA provides smoother trend confirmation. The components work in synergy to capture trends with minimal false signals or lag, ensuring traders can act promptly on market shifts. Customizable EMA periods make the tool adaptable to different market conditions, enhancing its versatility for various trading strategies.
To use the indicator, traders should adjust the EMA lengths based on their timeframe and strategy, ensuring that the shorter EMA remains shorter than the longer EMA to preserve the tool’s responsiveness. The color-coded signals offer visual clarity, making it easy to identify potential entry and exit points. This confluence of Fourier, Kalman, and EMA methodologies provides a smooth, highly effective trend-following tool that excels in both trending and ranging markets.
Multi-Regression StrategyIntroducing the "Multi-Regression Strategy" (MRS) , an advanced technical analysis tool designed to provide flexible and robust market analysis across various financial instruments.
This strategy offers users the ability to select from multiple regression techniques and risk management measures, allowing for customized analysis tailored to specific market conditions and trading styles.
Core Components:
Regression Techniques:
Users can choose one of three regression methods:
1 - Linear Regression: Provides a straightforward trend line, suitable for steady markets.
2 - Ridge Regression: Offers a more stable trend estimation in volatile markets by introducing a regularization parameter (lambda).
3 - LOESS (Locally Estimated Scatterplot Smoothing): Adapts to non-linear trends, useful for complex market behaviors.
Each regression method calculates a trend line that serves as the basis for trading decisions.
Risk Management Measures:
The strategy includes nine different volatility and trend strength measures. Users select one to define the trading bands:
1 - ATR (Average True Range)
2 - Standard Deviation
3 - Bollinger Bands Width
4 - Keltner Channel Width
5 - Chaikin Volatility
6 - Historical Volatility
7 - Ulcer Index
8 - ATRP (ATR Percentage)
9 - KAMA Efficiency Ratio
The chosen measure determines the width of the bands around the regression line, adapting to market volatility.
How It Works:
Regression Calculation:
The selected regression method (Linear, Ridge, or LOESS) calculates the main trend line.
For Ridge Regression, users can adjust the lambda parameter for regularization.
LOESS allows customization of the point span, adaptiveness, and exponent for local weighting.
Risk Band Calculation:
The chosen risk measure is calculated and normalized.
A user-defined risk multiplier is applied to adjust the sensitivity.
Upper and lower bounds are created around the regression line based on this risk measure.
Trading Signals:
Long entries are triggered when the price crosses above the regression line.
Short entries occur when the price crosses below the regression line.
Optional stop-loss and take-profit mechanisms use the calculated risk bands.
Customization and Flexibility:
Users can switch between regression methods to adapt to different market trends (linear, regularized, or non-linear).
The choice of risk measure allows adaptation to various market volatility conditions.
Adjustable parameters (e.g., regression length, risk multiplier) enable fine-tuning of the strategy.
Unique Aspects:
Comprehensive Regression Options:
Unlike many indicators that rely on a single regression method, MRS offers three distinct techniques, each suitable for different market conditions.
Diverse Risk Measures: The strategy incorporates a wide range of volatility and trend strength measures, going beyond traditional indicators to provide a more nuanced view of market dynamics.
Unified Framework:
By combining advanced regression techniques with various risk measures, MRS offers a cohesive approach to trend identification and risk management.
Adaptability:
The strategy can be easily adjusted to suit different trading styles, timeframes, and market conditions through its various input options.
How to Use:
Select a regression method based on your analysis of the current market trend (linear, need for regularization, or non-linear).
Choose a risk measure that aligns with your trading style and the market's current volatility characteristics.
Adjust the length parameter to match your preferred timeframe for analysis.
Fine-tune the risk multiplier to set the desired sensitivity of the trading bands.
Optionally enable stop-loss and take-profit mechanisms using the calculated risk bands.
Monitor the regression line for potential trend changes and the risk bands for entry/exit signals.
By offering this level of customization within a unified framework, the Multi-Regression Strategy provides traders with a powerful tool for market analysis and trading decision support. It combines the robustness of regression analysis with the adaptability of various risk measures, allowing for a more comprehensive and flexible approach to technical trading.

Adaptive Moving Average (AMA)The Adaptive Moving Average (AMA), also known as Kaufman's Adaptive Moving Average (KAMA), is a trend-following indicator that adapts to market volatility. It was developed by Perry Kaufman in 1972 to improve upon traditional moving averages by making the smoothing period dynamic based on market conditions.
The AMA aims to:
- Smooth out price data to reduce noise, similar to other moving averages.
- Adapt its smoothing based on market volatility and trend strength.
Here's how the Adaptive Moving Average (AMA) works:
1. Calculate the Efficiency Ratio (ER): The AMA begins by calculating the Efficiency Ratio (ER), which measures the efficiency of a price trend. It's calculated as the absolute change in closing prices over a period (`PeriodEfficiencyRatio`) divided by the sum of absolute changes in closing prices over the same period. The ER value ranges from 0 to 1, with higher values indicating a stronger trend.
2. Determine the Smoothing Constant (sc): Using the ER, the AMA calculates the smoothing constant (sc). This constant ranges between a predefined slow EMA (exponential moving average) and fast EMA, depending on the ER.
3. Compute the AMA value: The AMA is then calculated using the smoothing constant (sc) and the previous AMA value, as well as the current close price. This allows the AMA to adapt its smoothing based on the market's volatility.
4. Plot the AMA: The AMA is plotted on the chart, usually as a line, which follows the price action more closely in periods of strong trends and provides more smoothing in periods of lower volatility.
Usage and Interpretation:
- The Adaptive Moving Average can be used to identify trends and potential entry and exit points.
- When the price is above the AMA line, it may indicate an uptrend, and when the price is below the AMA line, it may indicate a downtrend.
- Crossovers of the price with the AMA line can signal potential buy or sell opportunities.
- The adaptability of the AMA makes it more responsive in trending markets and smoother in range-bound markets, providing an advantage over traditional moving averages.
Parameters:
- Period for EfficiencyRatio calculation (`PeriodEfficiencyRatio`):** The period over which the Efficiency Ratio is calculated.
- Fast EMA Length (`fastLength`) and Slow EMA Length (`slowLength`):** These parameters define the range for the smoothing constant. A shorter fast length makes the AMA more responsive, while a longer slow length makes it smoother.
The AMA can be a useful tool in a trader's toolkit for analyzing market trends and making informed trading decisions. Adjusting the parameters can fine-tune the AMA for different trading styles and market conditions.

Heikin Ashi RSI + OTT [Erebor]Relative Strength Index (RSI)
The Relative Strength Index (RSI) is a popular momentum oscillator used in technical analysis to measure the speed and change of price movements. Developed by J. Welles Wilder, the RSI is calculated using the average gains and losses over a specified period, typically 14 days. Here's how it works:
Description and Calculation:
1. Average Gain and Average Loss Calculation:
- Calculate the average gain and average loss over the chosen period (e.g., 14 days).
- The average gain is the sum of gains divided by the period, and the average loss is the sum of losses divided by the period.
2. Relative Strength (RS) Calculation:
- The relative strength is the ratio of average gain to average loss.
The RSI oscillates between 0 and 100. Traditionally, an RSI above 70 indicates overbought conditions, suggesting a potential sell signal, while an RSI below 30 suggests oversold conditions, indicating a potential buy signal.
Pros of RSI:
- Identifying Overbought and Oversold Conditions: RSI helps traders identify potential reversal points in the market due to overbought or oversold conditions.
- Confirmation Tool: RSI can be used in conjunction with other technical indicators or chart patterns to confirm signals, enhancing the reliability of trading decisions.
- Versatility: RSI can be applied to various timeframes, from intraday to long-term charts, making it adaptable to different trading styles.
Cons of RSI:
- Whipsaws: In ranging markets, RSI can generate false signals, leading to whipsaws (rapid price movements followed by a reversal).
- Not Always Accurate: RSI may give false signals, especially in strongly trending markets where overbought or oversold conditions persist for extended periods.
- Subjectivity: Interpretation of RSI levels (e.g., 70 for overbought, 30 for oversold) is somewhat subjective and can vary depending on market conditions and individual preferences.
Checking RSIs in Different Periods:
Traders often use multiple timeframes to analyze RSI for a more comprehensive view:
- Fast RSI (e.g., 8-period): Provides more sensitive signals, suitable for short-term trading and quick decision-making.
- Slow RSI (e.g., 32-period): Offers a smoother representation of price movements, useful for identifying longer-term trends and reducing noise.
By comparing RSI readings across different periods, traders can gain insights into the momentum and strength of price movements over various timeframes, helping them make more informed trading decisions. Additionally, divergence between fast and slow RSI readings may signal potential trend reversals or continuation patterns.
Heikin Ashi Candles
Let's consider a modification to the traditional “Heikin Ashi Candles” where we introduce a new parameter: the period of calculation. The traditional HA candles are derived from the open 01, high 00 low 00, and close 00 prices of the underlying asset.
Now, let's introduce a new parameter, period, which will determine how many periods are considered in the calculation of the HA candles. This period parameter will affect the smoothing and responsiveness of the resulting candles.
In this modification, instead of considering just the current period, we're averaging or aggregating the prices over a specified number of periods . This will result in candles that reflect a longer-term trend or sentiment, depending on the chosen period value.
For example, if period is set to 1, it would essentially be the same as traditional Heikin Ashi candles. However, if period is set to a higher value, say 5, each candle will represent the average price movement over the last 5 periods, providing a smoother representation of the trend but potentially with delayed signals compared to lower period values.
Traders can adjust the period parameter based on their trading style, the timeframe they're analyzing, and the level of smoothing or responsiveness they prefer in their candlestick patterns.
Optimized Trend Tracker
The "Optimized Trend Tracker" is a proprietary trading indicator developed by TradingView user ANIL ÖZEKŞİ. It is designed to identify and track trends in financial markets efficiently. The indicator attempts to smooth out price fluctuations and provide clear signals for trend direction.
The Optimized Trend Tracker uses a combination of moving averages and adaptive filters to detect trends. It aims to reduce lag and noise typically associated with traditional moving averages, thereby providing more timely and accurate signals.
Some of the key features and applications of the OTT include:
• Trend Identification: The indicator helps traders identify the direction of the prevailing trend in a market. It distinguishes between uptrends, downtrends, and sideways consolidations.
• Entry and Exit Signals: The OTT generates buy and sell signals based on crossovers and direction changes of the trend. Traders can use these signals to time their entries and exits in the market.
• Trend Strength: It also provides insights into the strength of the trend by analyzing the slope and momentum of price movements. This information can help traders assess the conviction behind the trend and adjust their trading strategies accordingly.
• Filter Noise: By employing adaptive filters, the indicator aims to filter out market noise and false signals, thereby enhancing the reliability of trend identification.
• Customization: Traders can customize the parameters of the OTT to suit their specific trading preferences and market conditions. This flexibility allows for adaptation to different timeframes and asset classes.
Overall, the OTT can be a valuable tool for traders seeking to capitalize on trending market conditions while minimizing false signals and noise. However, like any trading indicator, it is essential to combine its signals with other forms of analysis and risk management strategies for optimal results. Additionally, traders should thoroughly back-test the indicator and practice using it in a demo environment before applying it to live trading.
The following types of moving average have been included: "SMA", "EMA", "SMMA (RMA)", "WMA", "VWMA", "HMA", "KAMA", "LSMA", "TRAMA", "VAR", "DEMA", "ZLEMA", "TSF", "WWMA". Thanks to the authors.
Thank you for your indicator “Optimized Trend Tracker”. © kivancozbilgic
Thank you for your programming language, indicators and strategies. © TradingView
Kind regards.
© Erebor_GIT
