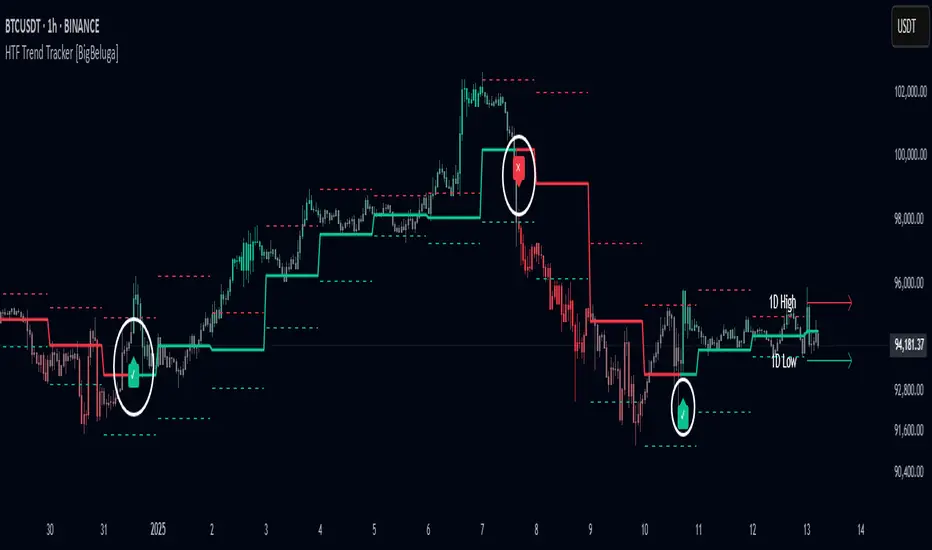
HTF Trend Tracker [BigBeluga]HTF Trend Tracker is a higher timeframe (HTF) trend tracking indicator designed to help traders identify significant trends, key levels, and market sentiment. The indicator dynamically adapts to the current price action, using HTF highs and lows to display trend direction and strength with detailed visuals.
🔵 Key Features:
Dynamic Trend Detection:
Uptrend is identified when the price closes above the HTF high.
Downtrend is detected when the price closes below the HTF low.
Midline changes color dynamically based on the trend direction:
Bullish Green: Indicates an uptrend.
Bearish Red: Indicates a downtrend.
Historical and Active HTF Levels:
Historic HTF highs and lows are displayed as dotted lines.
Current active HTF high and low levels are shown as solid lines.
Timeframe labels (e.g., "1D High" or "1D Low") mark the active levels for clarity.
Trend Change Signals:
A green checkmark (✓) is plotted when an uptrend starts.
A red cross (✕) appears when a downtrend begins.
Trend-Based Candle Coloring:
Candle colors change dynamically based on the trend and the price's distance from the midline:
Intense Bullish Green: Price is far above the midline during an uptrend.
Intense Bearish Red: Price is far below the midline during a downtrend.
Neutral Gray: Price is near the midline.
Users can customize the colors to suit their preferences.
🔵 Usage:
Identify uptrends and downtrends using the midline's color and the position of the close relative to the HTF levels.
Use solid lines and timeframe labels to track current HTF high and low levels.
Observe dotted lines for historical HTF levels to understand past price behavior.
Watch for checkmark (✓) and cross (✕) signals to spot trend changes and key market shifts.
Monitor candle colors to gauge trend intensity and proximity to the midline:
Intense colors signal strong trends, while neutral gray indicates consolidation near the midline.
HTF Trend Tracker is an essential tool for traders aiming to follow higher timeframe trends, identify key levels, and make data-driven decisions based on price dynamics and trend strength. Its customizable features allow for flexible integration into any trading strategy.
Cerca negli script per "key levels"
Lot Size & Risk Calculator (All Pairs)this indicator is designed to simplify and optimize risk management. It automatically calculates the ideal lot size based on your account balance, risk percentage, and defined entry and exit levels. Additionally, it includes visual tools to represent stop-loss (SL) and take-profit (TP) levels, helping you trade with precision and consistency.
WHAT IS THIS INDICATOR FOR?
This indicator is essential for traders who want to:
Maintain consistent risk in their trades.
Quickly calculate lot sizes for Forex, XAUUSD, BTCUSD, and US100.
Visualize key levels (Entry, SL, and TP) on the chart.
Monitor potential losses and gains in real time.
COMPATIBLE ASSETS
The Lot Size Calculator works with the following assets:
Forex: Standard currency pairs.
XAUUSD: Gold versus the US dollar.
BTCUSD: Bitcoin versus the US dollar.
US100: Nasdaq 100 index.
Calculations adjust automatically based on the selected asset.
TAKE-PROFIT (TP) LEVELS
The indicator allows you to define up to three take-profit levels:
TP1
TP2
TP3
.
Each level is configurable based on your exit strategy.
DASHBOARD
The dashboard is a visual tool that consolidates key information about your trade:
Account balance: Total amount available in your account.
Lot size: Calculated based on your risk and parameters.
Potential loss (SL): Amount you could lose if the price hits your stop-loss.
Potential gain (TP): Expected profit if the take-profit level is reached.
SETTINGS
The indicator offers multiple configurable options to adapt to your trading style:
Levels
Entry: Initial trade price.
Stop-Loss (SL): Maximum allowed loss level.
Take-Profit (TP): Up to three configurable levels.
Risk Management
Account balance ($): Enter your total available balance.
Risk percentage: Define how much you're willing to risk per trade
.
Visual Options
Visualization style: Choose between simple lines or visual fills.
Colors: Customize the colors of lines and labels.
Dashboard Settings
Statistics: Enable or disable key data display.
Size and position: Adjust the dashboard's size and location on the chart.
HOW TO CHANGE AN ENTRY?
Open the indicator settings in TradingView and entering the new data manually
Removing and re-adding the indicator to the chart

Auto Volume Spread Analysis (VSA) [TANHEF]Auto Volume Spread Analysis (visible volume and spread bars auto-scaled): Understanding Market Intentions through the Interpretation of Volume and Price Movements.
All the sections below contain the same descriptions as my other indicator "Volume Spread Analysis" with the exception of 'Auto Scaling'.
█ Auto-Scaling
This indicator auto-scales spread bars to match the visible volume bars, unlike the previous "Volume Spread Analysis " version which limited the number of visible spread bars to a fixed count. The auto-scaling feature allows for easier navigation through historical data, enabling both more historical spread bars to be viewed and more historical VSA pattern labels being displayed without requiring using the bar replay tool. Please note that this indicator’s auto-scaling feature recalculates the visible bars on the chart, causing the indicator to reload whenever the chart is moved.
Auto-scaled spread bars have two display options (set via 'Spread Bars Method' setting):
Lines: a bar lookback limit of 500 bars.
Polylines: no bar lookback limit as only plotted on visible bars on chart, which uses multiple polylines are used.
█ Simple Explanation:
The Volume Spread Analysis (VSA) indicator is a comprehensive tool that helps traders identify key market patterns and trends based on volume and spread data. This indicator highlights significant VSA patterns and provides insights into market behavior through color-coded volume/spread bars and identification of bars indicating strength, weakness, and neutrality between buyers and sellers. It also includes powerful volume and spread forecasting capabilities.
█ Laws of Volume Spread Analysis (VSA):
The origin of VSA begins with Richard Wyckoff, a pivotal figure in its development. Wyckoff made significant contributions to trading theory, including the formulation of three basic laws:
The Law of Supply and Demand: This fundamental law states that supply and demand balance each other over time. High demand and low supply lead to rising prices until demand falls to a level where supply can meet it. Conversely, low demand and high supply cause prices to fall until demand increases enough to absorb the excess supply.
The Law of Cause and Effect: This law assumes that a 'cause' will result in an 'effect' proportional to the 'cause'. A strong 'cause' will lead to a strong trend (effect), while a weak 'cause' will lead to a weak trend.
The Law of Effort vs. Result: This law asserts that the result should reflect the effort exerted. In trading terms, a large volume should result in a significant price move (spread). If the spread is small, the volume should also be small. Any deviation from this pattern is considered an anomaly.
█ Volume and Spread Analysis Bars:
Display: Volume and spread bars that consist of color coded levels, with the spread bars scaled to match the volume bars. A displayable table (Legend) of bar colors and levels can give context and clarify to each volume/spread bar.
Calculation: Levels are calculated using multipliers applied to moving averages to represent key levels based on historical data: low, normal, high, ultra. This method smooths out short-term fluctuations and focuses on longer-term trends.
Low Level: Indicates reduced volatility and market interest.
Normal Level: Reflects typical market activity and volatility.
High Level: Indicates increased activity and volatility.
Ultra Level: Identifies extreme levels of activity and volatility.
This illustrates the appearance of Volume and Spread bars when scaled and plotted together:
█ Forecasting Capabilities:
Display: Forecasted volume and spread levels using predictive models.
Calculation: Volume and Spread prediction calculations differ as volume is linear and spread is non-linear.
Volume Forecast (Linear Forecasting): Predicts future volume based on current volume rate and bar time till close.
Spread Forecast (Non-Linear Dynamic Forecasting): Predicts future spread using a dynamic multiplier, less near midpoint (consolidation) and more near low or high (trending), reflecting non-linear expansion.
Moving Averages: In forecasting, moving averages utilize forecasted levels instead of actual levels to ensure the correct level is forecasted (low, normal, high, or ultra).
The following compares forecasted volume with actual resulting volume, highlighting the power of early identifying increased volume through forecasted levels:
█ VSA Patterns:
Criteria and descriptions for each VSA pattern are available as tooltips beside them within the indicator’s settings. These tooltips provide explanations of potential developments based on the volume and spread data.
Signs of Strength (🟢): Patterns indicating strong buying pressure and potential market upturns.
Down Thrust
Selling Climax
No Effort ➤ Bearish Result
Bearish Effort ➤ No Result
Inverse Down Thrust
Failed Selling Climax
Bull Outside Reversal
End of Falling Market (Bag Holder)
Pseudo Down Thrust
No Supply
Signs of Weakness (🔴): Patterns indicating strong selling pressure and potential market downturns.
Up Thrust
Buying Climax
No Effort ➤ Bullish Result
Bullish Effort ➤ No Result
Inverse Up Thrust
Failed Buying Climax
Bear Outside Reversal
End of Rising Market (Bag Seller)
Pseudo Up Thrust
No Demand
Neutral Patterns (🔵): Patterns indicating market indecision and potential for continuation or reversal.
Quiet Doji
Balanced Doji
Strong Doji
Quiet Spinning Top
Balanced Spinning Top
Strong Spinning Top
Quiet High Wave
Balanced High Wave
Strong High Wave
Consolidation
Bar Patterns (🟡): Common candlestick patterns that offer insights into market sentiment. These are required in some VSA patterns and can also be displayed independently.
Bull Pin Bar
Bear Pin Bar
Doji
Spinning Top
High Wave
Consolidation
This demonstrates the acronym and descriptive options for displaying bar patterns, with the ability to hover over text to reveal the descriptive text along with what type of pattern:
█ Alerts:
VSA Pattern Alerts: Notifications for identified VSA patterns at bar close.
Volume and Spread Alerts: Alerts for confirmed and forecasted volume/spread levels (Low, High, Ultra).
Forecasted Volume and Spread Alerts: Alerts for forecasted volume/spread levels (High, Ultra) include a minimum percent time elapsed input to reduce false early signals by ensuring sufficient bar time has passed.
█ Inputs and Settings:
Indicator Bar Color: Select color schemes for bars (Normal, Detail, Levels).
Indicator Moving Average Color: Select schemes for bars (Fill, Lines, None).
Price Bar Colors: Options to color price bars based on VSA patterns and volume levels.
Legend: Display a table of bar colors and levels for context and clarity of volume/spread bars.
Forecast: Configure forecast display and prediction details for volume and spread.
Average Multipliers: Define multipliers for different levels (Low, High, Ultra) to refine the analysis.
Moving Average: Set volume and spread moving average settings.
VSA: Select the VSA patterns to be calculated and displayed (Strength, Weakness, Neutral).
Bar Patterns: Criteria for bar patterns used in VSA (Doji, Bull Pin Bar, Bear Pin Bar, Spinning Top, Consolidation, High Wave).
Colors: Set exact colors used for indicator bars, indicator moving averages, and price bars.
More Display Options: Specify how VSA pattern text is displayed (Acronym, Descriptive), positioning, and sizes.
Alerts: Configure alerts for VSA patterns, volume, and spread levels, including forecasted levels.
█ Usage:
The Volume Spread Analysis indicator is a helpful tool for leveraging volume spread analysis to make informed trading decisions. It offers comprehensive visual and textual cues on the chart, making it easier to identify market conditions, potential reversals, and continuations. Whether analyzing historical data or forecasting future trends, this indicator provides insights into the underlying factors driving market movements.

Higher Timeframe High & Low [ChartPrime]The Higher Timeframe High & Low Indicator plots key levels (high, low, and average price) from a higher timeframe onto the current chart, aiding traders in identifying significant support and resistance zones.
The indicator also detects and labels breakout points and can display trend directions based on these higher timeframe levels breakout points.
Key Features:
◆ Higher Timeframe Levels:
Plots the high, low, and average price from a selected higher timeframe onto the current chart.
Extends these levels into the future for better visualization.
◆ Breakout Detection:
Identifies and labels breakouts above the higher timeframe high or below the higher timeframe low.
Breakout points are clearly marked with labels indicating "High Break" or "Low Break" with timeframe mark.
If the following break out type is the same that previous, it does not marked by labels, but still marked by bar color.
◆ Trend Visualization:
Optionally displays trend direction by changing bar colors and line styles based on breakout conditions.
Trend indication helps in identifying bullish or bearish market conditions.
◆ Support and Resistance Indication:
Marks support and resistance points with '◆' symbols when the current timeframe's high or low interacts with the higher timeframe's levels.
◆ Period separation:
Background color changes to indicate period separation if enabled.
◆ Inputs:
Extension to the right of High and Low: Sets the number of bars to extend the high and low lines into the future.
Timeframe: Selects the higher timeframe (e.g., Daily) to use for plotting high and low levels.
Period Separator: Toggles the visual separator for periods.
Show Trend?: Toggles the trend visualization, changing bar colors and plot styles based on breakouts.
Show Breakout Labels?: Toggles the Breakout Labels visualization.
Indicator Logic:
Historical vs. Real-Time Bars: Adjusts values based on whether the bar is historical or real-time to ensure accurate plotting.
High and Low Prices: Retrieves the high and low prices from the selected higher timeframe.
Breakout Conditions: Determines if the current price has crossed above the higher timeframe high (high break) or below the higher timeframe low (low break).
Color and Trend Logic: Adjusts colors and checks for breakouts to avoid multiple labels and indicate trend direction.
Usage Notes:
This indicator is ideal for traders looking to integrate multi-timeframe analysis into their strategy.
The higher timeframe levels act as significant support and resistance zones, helping traders identify potential reversal or continuation points.
The breakout labels and trend visualization provide additional context for trading decisions, indicating when the price has breached key levels and is likely to continue in that direction.
This indicator enhances chart analysis by providing clear, visual cues from higher timeframe data, helping traders make more informed decisions based on a broader market perspective.

ICT Immediate Rebalance Toolkit [LuxAlgo]The ICT Immediate Rebalance Toolkit is a comprehensive suite of tools crafted to aid traders in pinpointing crucial trading zones and patterns within the market.
The ICT Immediate Rebalance, although frequently overlooked, emerges as one of ICT's most influential concepts, particularly when considered within a specific context. The toolkit integrates commonly used price action tools to be utilized in conjunction with the Immediate Rebalance patterns, enriching the capacity to discern context for improved trading decisions.
The ICT Immediate Rebalance Toolkit encompasses the following Price Action components:
ICT Immediate Rebalance
Buyside/Sellside Liquidity
Order Blocks & Breaker Blocks
Liquidity Voids
ICT Macros
🔶 USAGE
🔹 ICT Immediate Rebalance
What is an Immediate Rebalance?
Immediate rebalances, a concept taught by ICT, hold significant importance in decision-making. To comprehend the concept of immediate rebalance, it's essential to grasp the notion of the fair value gap. A fair value gap arises from market inefficiencies or imbalances, whereas an immediate rebalance leaves no gap, no inefficiencies, or no imbalances that the price would need to return to.
Rule of Thumb
After an immediate rebalance, the expectation is for two extension candles to follow; otherwise, the immediate rebalance is considered failed. It's important to highlight that both failed and successful immediate rebalances, when considered within a context, are significant signatures in trading.
Immediate rebalances can occur anywhere and in any timeframe.
🔹 Buyside/Sellside Liquidity
In the context of Inner Circle Trader's teachings, liquidity primarily refers to the presence of stop losses or pending orders, that indicate concentrations of buy or sell orders at specific price levels. Institutional traders, like banks and large financial entities, frequently aim for these liquidity levels or pools to accumulate or distribute their positions.
Buyside liquidity denotes a chart level where short sellers typically position their stops, while Sellside liquidity indicates a level where long-biased traders usually place their stops. These zones often serve as support or resistance levels, presenting potential trading opportunities.
The presentation applied here is the multi-timeframe version of our previously published Buyside-Sellside-Liquidity script.
🔹 Order Blocks & Breaker Blocks
Order Blocks and Breaker Blocks hold significant importance in technical analysis and play a crucial role in shaping market behavior.
Order blocks are fundamental elements of price action analysis used by traders to identify key levels in the market where significant buying or selling activity has occurred. These blocks represent areas on a price chart where institutional traders, banks, or large market participants have placed substantial buy or sell orders, leading to a temporary imbalance in supply and demand.
Breaker blocks, also known as liquidity clusters or pools, complement order blocks by identifying zones where liquidity is concentrated on the price chart. These areas, formed from mitigated order blocks, often act as significant barriers to price movement, potentially leading to price stalls or reversals in the future.
🔹 Liquidity Voids
Liquidity voids are sudden price changes when the price jumps from one level to another. Liquidity voids will appear as a single or a group of candles that are all positioned in the same direction. These candles typically have large real bodies and very short wicks, suggesting very little disagreement between buyers and sellers.
Here is our previously released Liquidity-Voids script.
🔹 ICT Macros
In the context of ICT's teachings, a macro is a small program or set of instructions that unfolds within an algorithm, which influences price movements in the market. These macros operate at specific times and can be related to price runs from one level to another or certain market behaviors during specific time intervals. They help traders anticipate market movements and potential setups during specific time intervals.
Here is our previously released ICT-Macros script.
🔶 SETTINGS
🔹 Immediate Rebalances
Immediate Rebalances: toggles the visibility of the detected immediate rebalance patterns.
Bullish, and Bearish Immediate Rebalances: color customization options.
Wicks 75%, %50, and %25: color customization options of the wick price levels for the detected immediate rebalance.
Ignore Price Gaps: ignores price gaps during calculation.
Confirmation (Bars): specifies the number of bars required to confirm the validation of the detected immediate rebalance.
Immediate Rebalance Icon: allows customization of the size of the icon used to represent the immediate rebalance.
🔹 Buyside/Sellside Liquidity
Buyside/Sellside Liquidity: toggles the visibility of the buy-side/sell-side liquidity levels.
Timeframe: this option is to identify liquidity levels from higher timeframes. If a timeframe lower than the chart's timeframe is selected, calculations will be based on the chart's timeframe.
Detection Length: lookback period used for the detection.
Margin: sets margin/sensitivity for the liquidity levels.
Buyside/Sellside Liquidity Color: color customization option for buy-side/sell-side liquidity levels.
Visible Liquidity Levels: allows customization of the visible buy-side/sell-side liquidity levels.
🔹 Order Blocks & Breaker Blocks
Order Blocks: toggles the visibility of the order blocks.
Breaker Blocks: toggles the visibility of the breaker blocks.
Swing Detection Length: lookback period used for the detection of the swing points used to create order blocks & breaker blocks.
Mitigation Price: allows users to select between the closing price or the wick of the candle.
Use Candle Body in Detection: allows users to use candle bodies as order block areas instead of the full candle range.
Remove Mitigated Order Blocks & Breaker Blocks: toggles the visibility of the mitigated order blocks & breaker blocks.
Order Blocks: Bullish, Bearish Color: color customization option for order blocks.
Breaker Blocks: Bullish, Bearish Color: color customization option for breaker blocks.
Visible Order & Breaker Blocks: allows customization of the visible order & breaker blocks.
Show Order Blocks & Breaker Blocks Labels: toggles the visibility of the order blocks & breaker blocks labels.
🔹 Liquidity Voids
Liquidity Voids: toggles the visibility of the liquidity voids.
Liquidity Voids Width Filter: filtering threshold while detecting liquidity voids.
Ignore Price Gaps: ignores price gaps during calculation.
Remove Mitigated Liquidity Voids: remove mitigated liquidity voids.
Bullish, Bearish, and Mitigated Liquidity Voids: color customization option..
Liquidity Void Labels: toggles the visibility of the liquidity voids labels.
🔹 ICT Macros
London and New York (AM, Launch, and PM): toggles the visibility of specific macros, allowing users to customize macro colors.
Macro Top/Bottom Lines, Extend: toggles the visibility of the macro's pivot high/low lines and allows users to extend the pivot lines.
Macro Mean Line: toggles the visibility of the macro's mean (average) line.
Macro Labels: toggles the visibility of the macro labels, allowing customization of the label size.
🔶 RELATED SCRIPTS
ICT-Killzones-Toolkit
Smart-Money-Concepts
Thanks to our community for recommending this script. For more conceptual scripts and related content, we welcome you to explore by visiting >>> LuxAlgo-Scripts .

Momentum Day Trading ToolkitMomentum Day Trading Toolkit
Complete User Guide
Table of Contents
Overview
Quick Start
The Dashboard
Module 1: 5 Pillars Screener
Module 2: Gap & Go
Module 3: Bull Flag / Flat Top
Module 4: Float Rotation
Module 5: R2G / G2R
Module 6: Micro Pullback
Signal Reference
Quality Score
Settings Guide
Alerts Setup
Trading Workflows
Troubleshooting
Overview
The Momentum Day Trading Toolkit combines 6 powerful indicators into one unified system for day trading momentum stocks.
ModulePurpose① 5 PillarsConfirms stock is "in play"② Gap & GoPre-market levels & gap analysis③ Bull Flag / Flat TopClassic breakout patterns④ Float RotationMeasures true interest level⑤ R2G / G2RTracks prior close crosses⑥ Micro PullbackPrecision continuation entries
All modules work together - the dashboard shows you everything at a glance, and you can enable/disable any module you don't need.
Quick Start
Step 1: Add to Chart
Add the indicator to any stock chart
Recommended timeframes: 1-minute, 5-minute, or 15-minute
Step 2: Check the Dashboard (Top Right)
Look for:
Status = Current state (Scanning, Entry Signal, etc.)
Quality Score = Setup rating out of 10
Green checkmarks (✓) = Criteria passing
Step 3: Watch for Entry Signals
Triangles, circles, diamonds below bars = Entry signals
Arrows = R2G/G2R crosses
Step 4: Set Alerts
Right-click chart → Add Alert
Select "Momentum Day Trading Toolkit"
Choose your alert condition
The Dashboard
The dashboard in the top-right corner gives you instant analysis:
┌─────────────────────────────┐
│ MOMENTUM TOOLKIT │
├─────────────────────────────┤
│ Status │ 🎯 ENTRY SIGNAL │
│ Day │ 🟢 GREEN │
│ Gap │ +8.5% 🔥 │
│ RVol │ 3.2x ✓ │
│ Rotation │ 1.45x 🔥 │
│ Float │ 5.2M 🔥 │
│ Change │ +12.3% ✓ │
│ Pattern │ BULL FLAG! │
│ EMA 9/20 │ Above Both ✓ │
│ VWAP │ Above ✓ │
│ Prior Cl │ 5.91 │
│ PM High │ 9.11 ✓ │
│ Price │ 9.46 ✓ │
└─────────────────────────────┘
Dashboard Row Reference
RowWhat It ShowsGood ValuesStatusCurrent state🎯 ENTRY SIGNALDayGreen/Red vs prior close🟢 GREENGapGap % from prior close🔥 (5%+) or 🔥🔥 (10%+)RVolRelative volume✓ (2x+) or ✓✓ (5x+)RotationFloat rotation🔥 (1x) or 🔥🔥 (2x+)FloatFloat in millions🔥 (<5M) or Low (<10M)ChangeDaily % change✓ (meets minimum)PatternPattern statusBREAKOUT!EMA 9/20Trend positionAbove Both ✓VWAPVWAP positionAbove ✓Prior CloseKey R2G levelReference pricePM HighPre-market high✓ = Above itPriceCurrent price✓ = In range
Status Messages
StatusMeaningActionScanning...Looking for setupsWait✅ ALL PILLARSStock qualifiesWatch for pattern⏳ PATTERN FORMINGSetup developingGet ready🎯 ENTRY SIGNALSignal triggeredExecute trade
Module 1: 5 Pillars Screener
What It Does
Confirms the stock meets basic criteria to be worth trading.
The 5 Pillars
PillarDefaultWhy It MattersRelative Volume2x+ (5x for "strong")Confirms unusual interestDaily Change5%+Stock is movingPrice Range$1-$20Sweet spot for momentumFloat Size<20M sharesLower float = bigger moves
Visual Indicator
Green background appears when ALL pillars pass
Dashboard Shows
Individual pillar status with ✓ checkmarks
Quality score includes pillar factors
Settings
SettingDefaultDescriptionMin RVol2.0xMinimum relative volumeStrong RVol5.0xVolume for full qualificationMin Change5%Minimum daily moveMin Price$1Minimum stock priceMax Price$20Maximum stock priceMax Float20MMaximum float size
Module 2: Gap & Go
What It Does
Analyzes pre-market gaps and displays key price levels.
Key Levels Displayed
LevelColorDescriptionPrior CloseOrangeYesterday's close - THE key levelPM HighGreenPre-market high - breakout levelPM LowRedPre-market low - support
Gap Classification
Gap SizeRatingMeaning5-9.9%🔥 QualifyingWorth watching10%+🔥🔥 StrongHigh priority
Entry Signal
Small green triangle = PM High Breakout
How to Trade
Stock gaps up in pre-market
Wait for market open
Look for break above PM High
Enter on breakout with stop below PM Low
Settings
SettingDefaultDescriptionMin Gap %5%Qualifying gap thresholdStrong Gap %10%Strong gap thresholdShow PM LevelsONDisplay PM high/low lines
Module 3: Bull Flag / Flat Top
What It Does
Detects classic continuation patterns and signals breakouts.
Bull Flag Pattern
▲ BREAKOUT (Entry Signal)
│
┌────┴────┐
│ Pullback │ ← 2-5 red candles
│ (flag) │ Max 50% retrace
└─────────┘
│
┌────┴────┐
│ Pole │ ← 3+ green candles
│ (move) │ Strong momentum
└─────────┘
Flat Top Pattern
═══════════════ Resistance (2+ touches)
│
▲ BREAKOUT above resistance
Entry Signals
SignalShapeColorPatternBull Flag Breakout▲ TriangleLimeFlag breaks upFlat Top Breakout◆ DiamondAquaResistance breaks
How to Trade Bull Flag
See 3+ green candles (the pole)
Price pulls back 2-5 red candles
Pullback stays above 50% of move
Enter on break above pullback high
Stop below pullback low
Settings
SettingDefaultDescriptionMin Pole Candles3Green candles neededMax Pullback5Max red candles allowedMax Retrace50%Max pullback depthFT Touches2Resistance touches neededFT Lookback10Bars to check for resistance
Module 4: Float Rotation
What It Does
Tracks how many times the entire float has traded hands today.
The Formula
Rotation = Cumulative Day Volume ÷ Float
Rotation Levels
RotationEmojiMeaning0.5x—Half float traded1.0x🔥FULL rotation - significant!2.0x🔥🔥Double rotation - extreme3.0x+🔥🔥🔥Triple rotation - rare event
Why It Matters
High rotation = Extreme interest
Everyone who owns shares has likely traded
Often precedes explosive moves
Shows "real" demand beyond just volume
Dashboard Shows
Current rotation level
Fire emojis for milestones
Settings
SettingDefaultDescriptionFloat SourceAutoAuto-detect or manualManual Float10MIf auto fails, use thisAlert Level1.0xAlert when rotation hits this
Module 5: R2G / G2R
What It Does
Tracks when price crosses the prior day's close - a key psychological level.
Red to Green (R2G) 🟢
Prior Close ─────────────────
↗ CROSS TO GREEN
↗
(opened red)
Stock opened below prior close (red)
Crosses above prior close (green)
BULLISH signal
Green to Red (G2R) 🔴
(opened green)
↘
↘ CROSS TO RED
Prior Close ─────────────────
Stock opened above prior close (green)
Crosses below prior close (red)
BEARISH signal
Entry Signals
SignalShapeColorMeaningR2G↑ ArrowLimeCrossed to greenG2R↓ ArrowRedCrossed to red
Why R2G Matters
Bears who shorted get squeezed
Creates FOMO buying
Prior close becomes support
Momentum often continues
Dashboard Shows
Current day status (🟢 GREEN / 🔴 RED)
Whether R2G or G2R occurred (R2G ✓ or G2R ✓)
Settings
SettingDefaultDescriptionRequire Opposite OpenONR2G needs red openShow Prior CloseONDisplay the line
Module 6: Micro Pullback
What It Does
Finds precision entries on brief 1-3 candle pullbacks after strong moves.
The Pattern
▲ ENTRY (break pullback high)
│
┌──┴───┐
│ 1-3 │ ← Micro pullback (brief!)
│ red │ Stop = low of this
└──────┘
│
┌──┴───┐
│ 3+ │ ← Strong move
│green │ Momentum building
└──────┘
Why Micro Pullbacks Work
Tight stop = Pullback low is close
Momentum intact = Only paused briefly
Early entry = Catch continuation early
Clear trigger = Break of pullback high
Entry Signal
SignalShapeColorMicro Pullback Entry● CircleYellow
How to Trade
See 3+ green candles (strong move)
1-3 red candles (brief pause)
Pullback stays above 50% retrace
Enter when green candle breaks pullback high
Stop at pullback low
Settings
SettingDefaultDescriptionMin Green Candles3Candles before pullbackMax Pullback3Max red candlesMax Retrace50%Max pullback depth
Signal Reference
All Entry Signals (Below Bar)
ShapeColorSignalModule▲ Large TriangleLimeBull Flag BreakoutPatterns◆ DiamondAquaFlat Top BreakoutPatterns● CircleYellowMicro Pullback EntryMicro PB▲ Small TriangleGreenPM High BreakoutGap & Go↑ ArrowLimeRed to GreenR2G/G2R
Warning Signals (Above Bar)
ShapeColorSignalModule↓ ArrowRedGreen to RedR2G/G2R
Optional Forming Signals (Disabled by Default)
ShapeColorSignal🚩 FlagFaded LimeBull Flag Forming● CircleFaded YellowMicro PB Forming
Enable "Show 'Forming' Markers" in settings to see these
Quality Score
The quality score (0-10) rates the overall setup strength.
Scoring Breakdown
FactorPointsRVol 5x++2RVol 2x++1Daily change 5%++1Low float (<20M)+1Strong gap (10%+)+2Qualifying gap (5%+)+1Rotation 1x++2Rotation 0.5x++1Above EMA 20+1
Score Interpretation
ScoreGradeAction8-10A+Best setups - full position6-7AGood setups - standard size4-5BAverage - reduced size0-3CWeak - skip or paper trade
Settings Guide
Module Toggles
Turn each module ON/OFF:
SettingDefaultDescription① 5 Pillars ScreenerONStock qualification② Gap & Go AnalysisONGap & level analysis③ Bull Flag / Flat TopONPattern detection④ Float RotationONRotation tracking⑤ R2G / G2R TrackerONPrior close crosses⑥ Micro PullbackONPullback entries
Visual Settings
SettingDefaultDescriptionShow DashboardONDisplay info tableTable SizeNormalSmall/Normal/LargeShow Entry SignalsONDisplay entry shapesShow 'Forming' MarkersOFFShow pattern formingShow Key LevelsONPrior close, PM levelsShow EMA 9/20ONTrend EMAsShow VWAPONVWAP line
Recommended Presets
Minimal (Clean Chart)
Show Dashboard: ON
Show Entry Signals: ON
Show 'Forming' Markers: OFF
Show Key Levels: OFF
Show EMA: OFF
Show VWAP: OFF
Standard (Balanced)
All defaults
Full Analysis
All settings ON
Alerts Setup
Available Alerts
AlertTriggerAny Bullish EntryAny entry signal firesBull Flag BreakoutBull flag breaks outFlat Top BreakoutFlat top breaks outMicro Pullback EntryMicro PB triggersPM High BreakoutBreaks above PM highRed to GreenR2G crossGreen to RedG2R crossFloat RotationHits rotation level5 Pillars PassAll pillars qualifyPattern FormingPattern starts formingHigh Quality EntryEntry with score 7+/10
How to Set Alerts
Right-click on chart
Select "Add Alert"
Condition: "Momentum Day Trading Toolkit"
Select alert type from dropdown
Set expiration and notifications
Click "Create"
Recommended Alerts
For Active Trading:
Any Bullish Entry
High Quality Entry
For Watchlist Monitoring:
5 Pillars Pass
Float Rotation
Trading Workflows
Workflow 1: Full Qualification
Step 1: 5 PILLARS
└─→ Wait for "✅ ALL PILLARS" status
Step 2: CHECK SETUP
└─→ Quality score 6+?
└─→ Above EMA and VWAP?
Step 3: WAIT FOR ENTRY
└─→ Bull Flag, Flat Top, or Micro PB signal
Step 4: EXECUTE
└─→ Enter on signal
└─→ Stop below pattern low
└─→ Target 2:1 minimum
Workflow 2: Gap & Go
Step 1: PRE-MARKET
└─→ Stock gaps 5%+ (shows in Gap row)
Step 2: MARKET OPEN
└─→ Note PM High level (green line)
Step 3: WAIT FOR BREAK
└─→ PM High Breakout signal (small triangle)
Step 4: CONFIRM
└─→ R2G if opened red (double confirmation)
└─→ RVol 2x+
Step 5: EXECUTE
└─→ Enter on PM High break
└─→ Stop below PM Low
Workflow 3: Micro Pullback Scalp
Step 1: FIND MOMENTUM
└─→ Stock moving, 3+ green candles
Step 2: WAIT FOR PAUSE
└─→ 1-3 red candles (brief pullback)
Step 3: ENTRY
└─→ Yellow circle signal appears
Step 4: QUICK TRADE
└─→ Enter at signal
└─→ Tight stop at pullback low
└─→ Quick target (1:1 to 2:1)
Troubleshooting
Q: Lines are moving/jumping on real-time chart?
A: This was fixed in latest version. Make sure you have the newest code. Lines now lock in place at market open.
Q: Too many signals, chart is cluttered?
A:
Turn off "Show 'Forming' Markers"
Disable modules you don't need
Use "Minimal" visual preset
Q: No signals appearing?
A:
Check if "Show Entry Signals" is ON
Make sure relevant module is enabled
Stock may not meet pattern criteria
Q: Dashboard shows wrong float?
A:
TradingView float data isn't available for all stocks
Switch Float Source to "Manual"
Enter correct float in millions
Q: PM High/Low not showing?
A:
Only appears during market hours
Needs pre-market data to calculate
Check if "Show Key Levels" is ON
Q: Quality score seems wrong?
A:
Score updates in real-time
Check individual factors in dashboard
RVol and rotation change throughout day
Q: Alert not triggering?
A:
Make sure alert is set on correct symbol
Check alert hasn't expired
Verify condition is set correctly
Quick Reference Card
Entry Signals
▲ Lime Triangle = Bull Flag Breakout
◆ Aqua Diamond = Flat Top Breakout
● Yellow Circle = Micro Pullback
▲ Green Triangle = PM High Break
↑ Lime Arrow = R2G (bullish)
↓ Red Arrow = G2R (bearish)
Dashboard Quick Read
🎯 = Entry signal active
✅ = All pillars pass
🟢 = Day is green
🔥 = Strong (gap/rotation)
✓ = Criteria met
✗ = Criteria failed
Quality Score
8-10 = A+ (Best)
6-7 = A (Good)
4-5 = B (Average)
0-3 = C (Weak)
Key Levels
Orange Line = Prior Close (R2G level)
Green Line = PM High (breakout level)
Red Line = PM Low (support)
Purple Line = VWAP
Yellow/Orange = EMA 9/20
Happy Trading! 🎯📈
For questions or issues, use TradingView's comment section on the indicator page.

TPO Levels [VAH/POC/VAL] with Poor H/L, Single Prints & NPOCs### 🎯 Advanced Market Profile & Key Level Analysis
This script is a unique and comprehensive technical analysis tool designed to help traders understand market structure, value, and key liquidity levels using the principles of **Auction Market Theory** and **Market Profile**.
This script is unique (and shouldn't be censored) because :
It allows large history of levels to be displayed
Accurate as possible tick size
Doesn't draw a profile but only the actual levels
Supports multi-timeframe levels even on the daily mode giving macro context
There is no indicator out there that does it
While these concepts are universal, this indicator was built primarily for the dynamic, 24/7 nature of the **cryptocurrency market**. It helps you move beyond simple price action to understand *why* the market is moving, which is especially crucial in the volatile crypto space.
### ## 📊 The Concepts Behind the Calculations
To use this script effectively, it's important to understand the core concepts it is built upon. The entire script is self-contained and does not require other indicators.
* **What is Market Profile?**
Market Profile is a unique charting technique that organizes price and time data to reveal market structure. It's built from **Time Price Opportunities (TPOs)**, which are 30-minute periods of market activity. By stacking these TPOs, the script builds a distribution, showing which price levels were most accepted (heavily traded) and which were rejected (lightly traded) during a session.
* **What is the Value Area (VA)?**
The Value Area is the heart of the profile. It represents the price range where **70%** of the session's trading volume occurred. This is considered the "fair value" zone where both buyers and sellers were in general agreement.
* **Point of Control (POC):** The single price level with the most TPOs. This was the most accepted or "fairest" price of the session and acts as a gravitational line for price.
* **Value Area High (VAH):** The upper boundary of the 70% value zone.
* **Value Area Low (VAL):** The lower boundary of the 70% value zone.
VAH and VAL are dynamic support and resistance levels. Trading outside the previous session's value area can signal the start of a new trend.
***
### ## 📈 Key Features Explained
This script automatically calculates and displays the following critical market-generated information:
* **Multi-Timeframe Market Profile**
Automatically draws Daily, Weekly, and Monthly profiles, allowing you to analyze market structure across different time horizons. The script preserves up to 20 historical sessions to provide deep market context.
* **Naked Point of Control (nPOC)**
A "Naked" POC is a Point of Control from a previous session that has **not** been revisited by price. These levels often act as powerful magnets for price, representing areas of unfinished business that the market may seek to retest. The script tracks and displays Daily, Weekly, and Monthly nPOCs until they are touched.
* **Single Prints (Imbalance Zones)**
A Single Print is a price level where only one TPO traded during the session's development. This signifies a rapid, aggressive price move and an imbalanced market. These areas, like gaps in a traditional chart, are frequently revisited as the market seeks to "fill in" these thin parts of the profile.
* **Poor Structure (Unfinished Auctions)**
A **Poor High** or **Poor Low** occurs when the top or bottom of a profile is flat, with two or more TPOs at the extreme price. This suggests that the auction in that direction was weak and inconclusive. These weak structures often signal a high probability that price will eventually break that high or low.
***
### ## 💡 How to Use This Indicator
This tool is not a signal generator but an analytical framework to improve your trading decisions.
1. **Determine Market Context:** Start by asking: Is the current price trading *inside* or *outside* the previous session's Value Area?
* **Inside VA:** The market is in a state of balance or range-bound. Look for trades between the VAH and VAL.
* **Outside VA:** The market is in a state of imbalance and may be starting a trend. Look for continuation or acceptance of prices outside the prior value.
2. **Identify Key Levels:**
* Use historical **nPOCs** as potential profit targets or areas to watch for a price reaction.
* Treat historical **VAH** and **VAL** levels as significant support and resistance zones.
* Note where **Single Prints** are. These are often price magnets that may get "filled" in the future.
3. **Spot Weakness:**
* A **Poor High** suggests weak resistance that may be easily broken.
* A **Poor Low** suggests weak support, signaling a potential for a continued move lower if broken.
***
### ## ⚙️ Customization & Crypto Presets
The indicator is highly customizable, allowing you to change colors, transparency, the number of historical sessions, and more.
To help traders get started quickly, the indicator includes **built-in layout presets** specifically calibrated for major cryptocurrencies: ** BINANCE:BTCUSDT.P , BINANCE:ETHUSDT.P , and BINANCE:SOLUSDT.P **. These presets automatically adjust key visual parameters to better suit the unique price characteristics and volatility of each asset, providing an optimized view right out of the box.
***
### ## ⚠️ Disclaimer
This indicator is a tool for market analysis and should not be interpreted as direct buy or sell signals. It provides information based on historical price action, which does not guarantee future results. Trading involves significant risk, and you should always use proper risk management. This script is designed for use on standard chart types (e.g., Candlesticks, Bar) and may produce misleading information on non-standard charts.

Advanced Volume Profile Pro Delta + POC + VAH/VAL# Advanced Volume Profile Pro - Delta + POC + VAH/VAL Analysis System
## WHAT THIS SCRIPT DOES
This script creates a comprehensive volume profile analysis system that combines traditional volume-at-price distribution with delta volume calculations, Point of Control (POC) identification, and Value Area (VAH/VAL) analysis. Unlike standard volume indicators that show only total volume over time, this script analyzes volume distribution across price levels and estimates buying vs selling pressure using multiple calculation methods to provide deeper market structure insights.
## WHY THIS COMBINATION IS ORIGINAL AND USEFUL
**The Problem Solved:** Traditional volume indicators show when volume occurs but not where price finds acceptance or rejection. Standalone volume profiles lack directional bias information, while basic delta calculations don't provide structural context. Traders need to understand both volume distribution AND directional sentiment at key price levels.
**The Solution:** This script implements an integrated approach that:
- Maps volume distribution across price levels using configurable row density
- Estimates delta (buying vs selling pressure) using three different methodologies
- Identifies Point of Control (highest volume price level) for key support/resistance
- Calculates Value Area boundaries where 70% of volume traded
- Provides real-time alerts for key level interactions and volume imbalances
**Unique Features:**
1. **Developing POC Visualization**: Real-time tracking of Point of Control migration throughout the session via blue dotted trail, revealing institutional accumulation/distribution patterns before they complete
2. **Multi-Method Delta Calculation**: Price Action-based, Bid/Ask estimation, and Cumulative methods for different market conditions
3. **Adaptive Timeframe System**: Auto-adjusts calculation parameters based on chart timeframe for optimal performance
4. **Flexible Profile Types**: N Bars Back (precise control), Days Back (calendar-based), and Session-based analysis modes
5. **Advanced Imbalance Detection**: Identifies and highlights significant buying/selling imbalances with configurable thresholds
6. **Comprehensive Alert System**: Monitors POC touches, Value Area entry/exit, and major volume imbalances
## HOW THE SCRIPT WORKS TECHNICALLY
### Core Volume Profile Methodology:
**1. Price Level Distribution:**
- Divides price range into user-defined rows (10-50 configurable)
- Calculates row height: `(Highest Price - Lowest Price) / Number of Rows`
- Distributes each bar's volume across price levels it touched proportionally
**2. Delta Volume Calculation Methods:**
**Price Action Method:**
```
Price Range = High - Low
Buy Pressure = (Close - Low) / Price Range
Sell Pressure = (High - Close) / Price Range
Buy Volume = Total Volume × Buy Pressure
Sell Volume = Total Volume × Sell Pressure
Delta = Buy Volume - Sell Volume
```
**Bid/Ask Estimation Method:**
```
Average Price = (High + Low + Close) / 3
Buy Volume = Close > Average ? Volume × 0.6 : Volume × 0.4
Sell Volume = Total Volume - Buy Volume
```
**Cumulative Method:**
```
Buy Volume = Close > Open ? Volume : Volume × 0.3
Sell Volume = Close ≤ Open ? Volume : Volume × 0.3
```
**3. Point of Control (POC) Identification:**
- Scans all price levels to find maximum volume concentration
- POC represents the price level with highest trading activity
- Acts as significant support/resistance level
- **Developing POC Feature**: Tracks POC evolution in real-time via blue dotted trail, showing how institutional interest migrates throughout the session. Upward POC migration indicates accumulation patterns, downward migration suggests distribution, providing early trend signals before price confirmation.
**4. Value Area Calculation:**
- Starts from POC and expands up/down to encompass 70% of total volume
- VAH (Value Area High): Upper boundary of value area
- VAL (Value Area Low): Lower boundary of value area
- Expansion algorithm prioritizes direction with higher volume
**5. Adaptive Range Selection:**
Based on profile type and timeframe optimization:
- **N Bars Back**: Fixed lookback period with performance optimization (20-500 bars)
- **Days Back**: Calendar-based analysis with automatic timeframe adjustment (1-365 days)
- **Session**: Current trading session or custom session times
### Performance Optimization Features:
- **Sampling Algorithm**: Reduces calculation load on large datasets while maintaining accuracy
- **Memory Management**: Clears previous drawings to prevent performance degradation
- **Safety Constraints**: Prevents excessive memory usage with configurable limits
## HOW TO USE THIS SCRIPT
### Initial Setup:
1. **Profile Configuration**: Select profile type based on trading style:
- N Bars Back: Precise control over data range
- Days Back: Intuitive calendar-based analysis
- Session: Real-time session development
2. **Row Density**: Set number of rows (30 default) - more rows = higher resolution, slower performance
3. **Delta Method**: Choose calculation method based on market type:
- Price Action: Best for trending markets
- Bid/Ask Estimate: Good for ranging markets
- Cumulative: Smoothed approach for volatile markets
4. **Visual Settings**: Configure colors, position (left/right), and display options
### Reading the Profile:
**Volume Bars:**
- **Length**: Represents relative volume at that price level
- **Color**: Green = net buying pressure, Red = net selling pressure
- **Intensity**: Darker colors indicate volume imbalances above threshold
**Key Levels:**
- **POC (Blue Line)**: Highest volume price - major support/resistance
- **VAH (Purple Dashed)**: Value Area High - upper boundary of fair value
- **VAL (Orange Dashed)**: Value Area Low - lower boundary of fair value
- **Value Area Fill**: Shaded region showing main trading range
**Developing POC Trail:**
- **Blue Dotted Lines**: Show real-time POC evolution throughout the session
- **Migration Patterns**: Upward trail indicates bullish accumulation, downward trail suggests bearish distribution
- **Early Signals**: POC movement often precedes price movement, providing advance warning of institutional activity
- **Institutional Footprints**: Reveals where smart money concentrated volume before final POC establishment
### Trading Applications:
**Support/Resistance Analysis:**
- POC acts as magnetic price level - expect reactions
- VAH/VAL provide intermediate support/resistance levels
- Profile edges show areas of low volume acceptance
**Developing POC Analysis:**
- **Upward Migration**: POC moving higher = institutional accumulation, bullish bias
- **Downward Migration**: POC moving lower = institutional distribution, bearish bias
- **Stable POC**: Tight clustering = balanced market, range-bound conditions
- **Early Trend Detection**: POC direction change often precedes price breakouts
**Entry Strategies:**
- Buy at VAL with POC as target (in uptrends)
- Sell at VAH with POC as target (in downtrends)
- Breakout plays above/below profile extremes
**Volume Imbalance Trading:**
- Strong buying imbalance (>60% threshold) suggests continued upward pressure
- Strong selling imbalance suggests continued downward pressure
- Imbalances near key levels provide high-probability setups
**Multi-Timeframe Context:**
- Use higher timeframe profiles for major levels
- Lower timeframe profiles for precise entries
- Session profiles for intraday trading structure
## SCRIPT SETTINGS EXPLANATION
### Volume Profile Settings:
- **Profile Type**: Determines data range for calculation
- N Bars Back: Exact number of bars (20-500 range)
- Days Back: Calendar days with timeframe adaptation (1-365 days)
- Session: Trading session-based (intraday focus)
- **Number of Rows**: Profile resolution (10-50 range)
- **Profile Width**: Visual width as chart percentage (10-50%)
- **Value Area %**: Volume percentage for VA calculation (50-90%, 70% standard)
- **Auto-Adjust**: Automatically optimizes for different timeframes
### Delta Volume Settings:
- **Show Delta Volume**: Enable/disable delta calculations
- **Delta Calculation Method**: Choose methodology based on market conditions
- **Highlight Imbalances**: Visual emphasis for significant volume imbalances
- **Imbalance Threshold**: Percentage for imbalance detection (50-90%)
### Session Settings:
- **Session Type**: Daily, Weekly, Monthly, or Custom periods
- **Custom Session Time**: Define specific trading hours
- **Previous Sessions**: Number of historical sessions to display
### Days Back Settings:
- **Lookback Days**: Number of calendar days to analyze (1-365)
- **Automatic Calculation**: Script automatically converts days to bars based on timeframe:
- Intraday: Accounts for 6.5 trading hours per day
- Daily: 1 bar per day
- Weekly/Monthly: Proportional adjustment
### N Bars Back Settings:
- **Lookback Bars**: Exact number of bars to analyze (20-500)
- **Precise Control**: Best for systematic analysis and backtesting
### Visual Customization:
- **Colors**: Bullish (green), Bearish (red), and level colors
- **Profile Position**: Left or Right side of chart
- **Profile Offset**: Distance from current price action
- **Labels**: Show/hide level labels and values
- **Smooth Profile Bars**: Enhanced visual appearance
### Alert Configuration:
- **POC Touch**: Alerts when price interacts with Point of Control
- **VA Entry/Exit**: Alerts for Value Area boundary interactions
- **Major Imbalance**: Alerts for significant volume imbalances
## VISUAL FEATURES
### Profile Display:
- **Horizontal Bars**: Volume distribution across price levels
- **Color Coding**: Delta-based coloring for directional bias
- **Smooth Rendering**: Optional smoothing for cleaner appearance
- **Transparency**: Configurable opacity for chart readability
### Level Lines:
- **POC**: Solid blue line with optional label
- **VAH/VAL**: Dashed colored lines with value displays
- **Extension**: Lines extend across relevant time periods
- **Value Area Fill**: Optional shaded region between VAH/VAL
### Information Table:
- **Current Values**: Real-time POC, VAH, VAL prices
- **VA Range**: Value Area width calculation
- **Positioning**: Multiple table positions available
- **Text Sizing**: Adjustable for different screen sizes
## IMPORTANT USAGE NOTES
**Realistic Expectations:**
- Volume profile analysis provides structural context, not trading signals
- Delta calculations are estimations based on price action, not actual order flow
- Past volume distribution does not guarantee future price behavior
- Combine with other analysis methods for comprehensive market view
**Best Practices:**
- Use appropriate profile types for your trading style:
- Day Trading: Session or Days Back (1-5 days)
- Swing Trading: Days Back (10-30 days) or N Bars Back
- Position Trading: Days Back (60-180 days)
- Consider market context (trending vs ranging conditions)
- Verify key levels with additional technical analysis
- Monitor profile development for changing market structure
**Performance Considerations:**
- Higher row counts increase calculation complexity
- Large lookback periods may affect chart performance
- Auto-adjust feature optimizes for most use cases
- Consider using session profiles for intraday efficiency
**Limitations:**
- Delta calculations are estimations, not actual transaction data
- Profile accuracy depends on available price/volume history
- Effectiveness varies across different instruments and market conditions
- Requires understanding of volume profile concepts for optimal use
**Data Requirements:**
- Requires volume data for accurate calculations
- Works best on liquid instruments with consistent volume
- May be less effective on very low volume or exotic instruments
This script serves as a comprehensive volume analysis tool for traders who need detailed market structure information with integrated directional bias analysis and real-time POC development tracking for informed trading decisions.

Key Session Levels (KUUUMZ)
📜 Summary
Tired of manually drawing the same key levels every single trading day? The KUUMZ-Key Session Levels indicator automates this entire process, plotting the most critical intraday and previous day levels directly on your chart. This tool provides a clean, dynamic framework of potential support and resistance zones, allowing you to focus on your trading strategy, not on chart setup.
Built for day traders and scalpers of US equities, this indicator helps you instantly visualize the market's structure from the moment the session begins.
🎯 Key Levels Plotted
This indicator automatically identifies and draws horizontal lines for the following session levels:
Previous Day High (PDH) & Low (PDL): The highest and lowest points of the prior trading day, which often act as major psychological support and resistance magnets.
Pre-Market High & Low (PMH/PML): The range established during the pre-market session (4:00 - 9:30 AM ET). A breakout from this range can often signal the initial directional bias.
5-Minute Opening Range High & Low (OR5): The high and low of the first 5 minutes of the regular session (9:30 - 9:35 AM ET). A crucial level for opening range breakout (ORB) strategies.
15-Minute Opening Range High & Low (OR15): The high and low of the first 15 minutes (9:30 - 9:45 AM ET), providing a slightly broader view of the initial balance area.
📈 How to Use This Indicator
These levels are fundamental to many intraday trading strategies:
Support & Resistance: Watch how price reacts as it approaches these levels. A bounce or rejection can signal a potential reversal, while a clean break can indicate continuation.
Breakout Trading: A strong, high-volume move through one of these levels (e.g., breaking above the Pre-Market High) can be an entry signal for a breakout trade.
Market Context: Quickly gauge market sentiment. Is the price trading above or below the previous day's range? Is it trapped within the opening range? These levels provide immediate context to the current price action.
Setting Targets & Stops: Use these levels to set logical profit targets or place stop-loss orders. For example, if you go long on a breakout of the 5-min OR, the Pre-Market High or Previous Day High could be your first target.
⚙️ Features & Customization
The script is designed to be flexible and clean, allowing you to tailor it to your specific charting style.
Toggle Any Level: Enable or disable any set of levels (Previous Day, Pre-Market, etc.) to reduce clutter.
Full Style Control: Customize the Color, Width, and Style (Solid, Dotted, Dashed) for each pair of high/low lines independently.
Optional Labels: A master switch allows you to show or hide all price labels (like "PDH", "PM Low", etc.) with a single click.
Automatic & Dynamic: Levels are calculated and drawn in real-time as each session concludes and are automatically cleared and reset for the next trading day.

Fibonacci ReRSI LevelsOverview
The Fibonacci RSI Levels indicator plots key Fibonacci-based RSI levels directly on the price chart, offering a unique perspective on market momentum, potential reversal points, and support/resistance zones. By combining the Relative Strength Index (RSI) with Fibonacci retracement levels, this indicator helps traders identify overbought/oversold conditions, trend strength, and critical price levels for potential trading opportunities.
Key Features
Fibonacci RSI Levels: Plots five key levels—23.6% (Oversold), 38.2% (Downtrend Limit), 50.0% (Mid Level), 61.8% (Uptrend Limit), and 78.6% (Overbought)—based on a logarithmic RSI calculation.
Customizable Settings: Adjust the RSI length, line extension, timeframe, and level colors to suit your trading style.
Gradient Fills: Optional gradient fills between levels provide a visual representation of the price's position relative to key zones.
Multi-Timeframe Support: Use the current chart resolution or specify a custom timeframe (e.g., 1M, 5D, 240 for 4 hours) for flexible analysis.
Logarithmic RSI Calculation: Ideal for assets with exponential price movements, such as cryptocurrencies.
How It Works
The indicator uses a reverse-engineered RSI calculation, inspired by Giorgos Siligardos' concept, to determine price levels corresponding to specific Fibonacci RSI values. These levels are plotted as horizontal lines on the chart, each with a label showing the Fibonacci percentage and the exact price level. If enabled, gradient fills between the levels change color based on the price's position, enhancing visual interpretation.
Usage
Support and Resistance: The 38.2% and 61.8% levels often act as support and resistance in trending markets.
Overbought/Oversold Conditions: The 23.6% and 78.6% levels can indicate potential reversal points due to oversold or overbought conditions.
Trend Confirmation: The 50% level serves as a neutral zone or pivot point. Prices above this level may indicate an uptrend, while prices below suggest a downtrend.
Gradient Fills: Use the gradient fills to quickly assess the price's position within the key zones, aiding in decision-making for entries, exits, or reversals.
Interpretation
Uptrend: When the price is above the 50% level and approaching the 61.8% level, it may signal a strong uptrend.
Downtrend: When the price is below the 50% level and nearing the 38.2% level, it may indicate a downtrend.
Reversal Zones: Watch for price reactions near the 23.6% and 78.6% levels, as these can be areas of potential reversals.
Customization
RSI Length: Adjust the RSI period to fine-tune the sensitivity of the levels.
Line Extension: Control how far the levels extend into the future for better visualization.
Timeframe: Choose between the current chart resolution or a custom timeframe for multi-timeframe analysis.
Colors: Customize the colors of each level and enable gradient fills for enhanced visual clarity.

Leverage Aware Trade OptimizerWelcome to the Leverage-Aware Trade Optimizer (LATO)! I’m thrilled to have you exploring this dynamic algorithm! LATO combines advanced market oscillation tracking, leverage-aware trade optimization, and real-time market analysis to help you make smarter, more informed trading decisions. Whether you're just starting or you’re an experienced trader, LATO provides powerful tools and insights to enhance your strategies. LATO is here to support you in optimizing your trades with precision, so feel free to dive in and explore all the features. Let’s make your trading experience as effective and rewarding as possible. Safe trading!
Leverage-Aware Trade Optimizer (LATO)
Short Title: LATO
Category: Trading Tools / Technical Analysis
Overview
The Leverage-Aware Trade Optimizer (LATO) is a powerful algorithm designed to track and analyze market oscillations, identify reversal zones, and provide dynamic trading levels for optimal decision-making. With built-in risk management features, LATO enhances traders’ ability to make well-informed decisions based on a comprehensive range of market indicators, including price oscillations, probabilities, and leverage-related risks.
Key Features
Comprehensive Market Oscillation Tracking: LATO utilizes advanced indicators such as the Indexed Position Oscillator (IPO), Candle Relative Percentage (CRP), and Oscillating Range Indicator (ORI) to track price fluctuations and detect key market oscillations, providing a detailed view of price movements.
Dynamic Price Levels for Trading Decisions: The script calculates critical price levels such as WAP, WBP, XAP, and XBP. These weighted and expanded prices help identify potential support and resistance zones for accurate trade entries and exits.
Reversal Detection and Trend Identification: LATO is designed to recognize top and bottom reversal zones using user-defined thresholds (e.g., upper_reversal, lower_reversal). The algorithm signals potential trend changes with event markers such as UP, DOWN, UIP, and DIP, enabling traders to anticipate market reversals.
Risk and Leverage Mapping: By estimating liquidation levels for various leverage values (5x, 10x, 20x, etc.), LATO assists in risk management, helping traders visualize leverage exposure and optimize their trades according to risk tolerance.
Integrated Visualization and Event Labels: LATO enhances visual analysis by plotting key levels, trend lines, and event markers on the chart. Custom labels summarize critical values, including SOD (Sell Odds), BOD (Buy Odds), ORI (Oscillating Range Indicator), and PVI (Price Volatility Index), offering a quick, actionable summary for traders.
User Inputs
Orders Deviation (order_deviation): Controls the deviation for calculating trade levels.
Top Reversal (upper_reversal): Sets the threshold for the upper reversal zone.
Bottom Reversal (lower_reversal): Sets the threshold for the lower reversal zone.
How It Works
LATO tracks market oscillations through the Indexed Position Oscillator (IPO) and Candle Relative Percentage (CRP), dynamically adjusting as the market fluctuates. The algorithm then identifies key levels using weighted prices (e.g., WAP, WBP) and generates reversal signals based on defined thresholds.
Once the Leverage-Aware Trade Optimizer (LATO) is applied to a chart, it automatically calculates dynamic support and resistance levels and identifies potential buying or selling opportunities. The script also plots liquidation zones based on different leverage levels and visualizes these areas through color-coded lines.
Use Case Scenarios
Trend Reversal Detection: Identify when the market is likely to reverse based on the ORI and price action.
Dynamic Price Levels: Use the weighted price levels and trend lines to pinpoint entry/exit points.
Leverage Risk Management: Monitor liquidation levels and use them for managing risk while trading with leverage.
Oscillation Tracking: Track key oscillations for detecting overbought or oversold conditions.
Alert Setup for LATO
You can set up alerts based on the key conditions like UP, DOWN, UIP, and DIP, as well as specific market movements.
Down Trend Alert (DOWN): Alerts when there’s a downtrend, triggered by a crossover of WBP and BL5, with specific conditions for ORI and SOD.
Up Trend Alert (UP): Alerts when there’s an uptrend, triggered by a crossunder of WAP and SL5, with ORI below -0.5.
Upper Reversal Alert (UIP): Alerts when ORI crosses below the lower_reversal threshold.
Downward Reversal Alert (DIP): Alerts when ORI crosses above the upper_reversal threshold.
Conclusion
The Leverage-Aware Trade Optimizer (LATO) is a comprehensive trading tool designed for traders seeking to optimize their trade entries and exits. By combining multiple indicators, dynamic price levels, and reversal zone detection, LATO offers an advanced approach to market analysis and decision-making. Whether you’re trading with leverage or simply looking for trend confirmation, LATO provides the insights you need to maximize your trading potential.
Notes
This script is designed to be used on any time frame.
Adjust the order_deviation parameter based on the asset volatility you are trading.
The reversal thresholds (upper and lower) should be fine-tuned depending on market conditions.

Williams Fractals for ExtremesThis script, written in Pine Script (version 5), implements an indicator for the automatic detection and visualization of fractal extremes on the price chart. The core algorithm is based on Bill Williams' fractal theory and identifies local highs and lows, which are often used to determine potential reversal points and support/resistance levels in the market.
### Key Features:
#### Fractal Detection:
- The indicator identifies a fractal high if the middle candle in a sequence of five candles (two on the left and two on the right) has the highest value.
- A fractal low is identified if the middle candle in the same type of five-candle sequence has the lowest value.
#### Extreme Visualization:
- Fractal highs are displayed as red dots on the chart, signaling potential local peaks.
- Fractal lows are shown as green dots, indicating local troughs.
### Usage:
- The indicator is designed for use across all timeframes and can be applied to both cryptocurrency and traditional financial markets.
- Highlighted points allow traders to quickly spot key levels, aiding in identifying potential zones for trade entry or exit.
### Application in Trading:
#### Identifying Key Levels:
- Fractal highs and lows can serve as resistance and support levels. A breakout beyond a fractal in either direction may signal a continuation of movement in that direction.
#### Finding Reversal Points:
- Fractal extremes indicate potential market reversals, making them useful in counter-trend trading strategies.
#### Adaptability to Market Conditions:
- The indicator updates dynamically with the appearance of new candles, providing traders with real-time fractal extreme levels.
### Settings and Parameters:
- In its current version, the script does not include customizable settings as it implements the standard concept of Williams' fractals.

Rounded Grid Levels🟩 Rounded Grid Levels is a visual tool that helps traders quickly identify key psychological price levels on any chart. By dynamically adapting to the user's visible screen area, it provides consistent, easy-to-read round number grids that align with price action. The indicator offers a traditional visualization of horizontal round level grids, along with enhanced options such as tilted grids that align with market sentiment, and fan-shaped grids for alternative price interaction views. It serves purely as a visual aid, providing an adaptable way to observe rounded price levels without making predictions or generating trading signals.
⚡ OVERVIEW ⚡
The Rounded Grid Levels indicator is a visual tool designed to help traders identify and track price levels that may hold psychological significance, such as round numbers or significant milestones. These levels often serve as potential areas for price reactions, including support, resistance, or points of market interest. The indicator's gridlines are determined by user-defined settings and adjust dynamically based on the visible chart area, meaning they are influenced by the user's current zoom level and perspective. This behavior is similar to TradingView's built-in grid lines found in the chart settings canvas, which also adjust in real-time based on the visible screen, ensuring the most relevant price levels are displayed. By default, the indicator provides consistent gridlines to represent traditional round number levels, offering a straightforward view of key psychological areas. Additionally, users have access to experimental and novel configurations, such as fan-shaped layouts, which expand from a central point and adapt directionally based on user settings. This configuration can provide an alternate perspective for traders, especially useful in analyzing broader market moves and visualizing expansion relative to the current price.
Users can display the gridlines in a variety of configurations, including horizontal, neutral, auto, or fan-shaped layouts, depending on their preferred method of analysis. This flexibility allows traders to focus on different types of price action without overcrowding the visual representation of price movements.
This indicator is intended purely as a visual aid for understanding how price interacts with rounded levels over time. It does not generate predictive trading signals or recommendations but rather provides traders with a customizable framework to enhance their market analysis.
⭕ ROUND NUMBERS IN MARKET PSYCHOLOGY ⭕
Round numbers hold a significant place in financial markets, largely due to the psychological tendencies of traders and investors. These levels often represent areas of interest where human behavior, market biases, and trading strategies converge. Whether it's prices ending in 000, 500, or other recognizable values, these levels naturally attract more attention and influence decision-making.
Round numbers can act as key support or resistance levels and often become focal points in market activity. They are frequently highlighted by financial media, embedded in products like options, and serve as foundations for various trading theories. Their impact extends across different market participants and strategies, making them important focal points in both short-term and long-term market analysis.
Round numbers play an important role in guiding trader behavior and market activity. To better understand why these levels are so impactful, there are several key factors that highlight their significance in trading and price dynamics:
Psychological Impact : Humans naturally gravitate toward round numbers, such as prices ending in 000, 500, or 00. These levels tend to draw attention as traders perceive them as psychologically significant. This behavior is rooted in the cognitive bias known as "left-digit bias," where people assign greater importance to rounded, more recognizable numbers. In trading, this means that prices at these levels are more memorable and thus more likely to attract attention, creating an area where traders focus their buying or selling decisions.
Order Clustering : Traders often place buy and sell orders around these rounded levels, either manually or automatically through stop and limit orders. This clustering leads to the formation of visible support or resistance zones, as the concentrated orders tend to influence price behavior around these key levels. Market participants tend to converge their orders around these price points because of their perceived psychological importance, creating a liquidity pocket. As a result, these areas often act as barriers that the price either struggles to cross or uses as springboards for further movement.
External Influences : Financial media frequently highlights round-number milestones, amplifying market sentiment and drawing traders' attention to these levels. Additionally, algorithmic trading systems often react to round-number thresholds, which can further reinforce price movements, creating self-reinforcing reactions at these levels. As media and analysts emphasize these milestones, more traders pay attention to them, leading to increased volume and often heightened volatility at those points. This self-reinforcing cycle makes round numbers an area where price movement can either accelerate due to a breakout or stall because of clustering interest.
Option Strike Prices : Options contracts typically have strike prices set at round numbers, and as expiration approaches, these levels can influence the price of the underlying asset due to concentrated trading activity. The behavior around these levels, often called "pinning," happens because traders adjust their positions to avoid unfavorable scenarios at these key strikes. This activity tends to concentrate price movement toward these levels as traders hedge their positions, leading to increased liquidity and the potential for abrupt price reactions near option expiration dates.
Whole Number Theory : This theory suggests that whole numbers act as natural psychological barriers, where traders tend to make decisions, place orders, or expect price reactions, making these levels crucial for analysis. Whole numbers are simple to remember and are often used as informal targets for profit-taking or stop placement. This behavior leads to a natural ebb and flow around these levels, where the market finds equilibrium temporarily before deciding on a future direction. Whole numbers tend to work like magnets, drawing price to them and often creating reactions that are visible across different timeframes.
Quarters Theory : Commonly used in Forex markets, this theory focuses on quarter-point increments (e.g., 1.0000, 1.2500, 1.5000) as key levels where price often pauses or reverses. These quarter levels are treated as important psychological barriers, with price frequently interacting at these intervals. Traders use these points to gauge market strength or weakness because quarter levels divide larger round-number ranges into more manageable and meaningful segments. For example, in highly traded forex pairs like EUR/USD, traders might treat 1.2500 as a significant barrier because it represents a halfway point between 1.0000 and 1.5000, offering a balanced reference point for decision-making.
Big Round Numbers : Major round numbers, such as 100, 500, or 1000, often attract significant attention and serve as psychological thresholds. Traders anticipate strong reactions when prices approach or cross these levels. This is often because large round numbers symbolize major milestones, and price behavior around them tends to signal important market sentiment shifts. When price crosses a major level, such as a stock moving above $100 or Bitcoin crossing $50,000, it often creates a surge in trading activity as it is viewed as a validation or invalidation of market trends, drawing in momentum traders and triggering both retail and institutional responses.
By visualizing these round levels on the chart, the Rounded Grid Levels indicator helps traders identify areas where price may pause, reverse, or gain momentum. While round numbers provide useful insights, they should be used in conjunction with other technical analysis tools for a comprehensive trading strategy.
🛠️ CONFIGURATION AND SETTINGS 🛠️
The Rounded Grid Levels indicator offers a variety of configurable settings to tailor the visualization according to individual trader preferences. Below are the key settings available for customization:
Custom Settings
Rounding Step : The Rounding Step parameter sets the minimum interval between gridlines. This value determines how closely spaced the rounded levels are on the chart. For example, if the Rounding Step is set to 100, gridlines will be displayed at every 100 points (e.g., $100, $200, $300) relative to the current price level. The Rounding Step is scaled to the chart's visible area, meaning users should adjust it appropriately for different assets to ensure effective visualization. Lower values provide a more granular view, while larger values give a broader, higher-level perspective.
Major Grids : Defines the interval at which major gridlines will appear compared to minor ones. For example, if the Rounding Step is 100 and Major Grids is set to 10, major gridlines will be displayed every $1,000, while minor gridlines will be at every $100. This distinction allows traders to better visualize key psychological levels by emphasizing significant price intervals.
Direction : Users can select the gridline direction, choosing between options such as 'Up', 'Down', 'Auto', or 'Neutral'. This setting controls how the gridlines extend relative to the current price level, which can help in analyzing directional trends.
Neutral Direction : This option provides balanced gridlines both above and below the current price, allowing traders to visualize support and resistance levels symmetrically. This is useful for analyzing sideways or ranging markets without directional bias.
Up Direction : The gridlines are tilted upwards, starting from visible lows and extending toward the rounded level at the current price. By choosing Up , traders emphasize an upward sentiment, visualizing price action that aligns with rising trends. This option helps illustrate potential areas where pullbacks may occur, as well as how price might expand upwards in the current market context.
Down Direction : The gridlines are tilted downwards, starting from visible highs and extending toward the rounded level at the current price. Selecting Down allows traders to emphasize a downward sentiment, visualizing how price may expand downwards, which is particularly useful when analyzing downtrends or potential correction levels. The gridlines provide an illustrative view of how price interacts with lower levels during market declines.
Auto Direction : The gridlines automatically adjust their direction based on recent market trends. This adaptive option allows traders to visualize gridlines that dynamically change according to price action, making it suitable for evolving market conditions where the direction is uncertain. It’s useful for traders looking for an indicator that moves in sync with market shifts and doesn’t require manual adjustment.
Grid Type : Allows users to choose between 'Linear' or 'Fan' grid types. The Linear type creates evenly spaced gridlines that can be either horizontal or tilted, depending on the chosen direction setting, providing a straightforward view of price levels. The Fan type radiates lines from a central point, offering a more dynamic perspective for analyzing price expansions relative to the current price. These grid types introduce experimental visualizations influenced by chart properties, including visible highs, lows, and the current price. Regardless of the configuration, the gridlines will always end at the current bar, which represents a rounded price level, ensuring consistency in how key price areas are displayed.
Extend : This setting allows gridlines to be projected into the future, helping traders see potential levels beyond the current bar. When enabled, the behavior of the extended lines varies based on the selected grid type and direction. For Neutral and Horizontal Linear settings, the extended gridlines maintain their round-number alignment indefinitely. However, for Up , Down , or Auto directions, the angle of the extended gridlines can change dynamically based on the chart’s visible high and low or the latest price action. As a result, extended lines may not continue to align with round-number levels beyond the current bar, reflecting instead the current trend and sentiment of the market. Regardless of direction, extended gridlines remain consistently spaced and either parallel or evenly distributed, ensuring a structured visual representation.
Color Settings : Users can customize the colors for resistance, support, and minor gridlines at the current price. This helps in visually distinguishing between different grid types and their significance on the chart.
Color Options
These configuration options make the Rounded Grid Levels indicator a versatile tool for traders looking to customize their charts based on their personal trading strategies and analytical preferences.
🖼️ CHART EXAMPLES 🖼️
The following chart examples illustrate different configurations available in the Rounded Grid Levels indicator. These examples show how variations in grid type, direction, and rounding step settings impact the visualization of price levels. Traders may find that smaller rounding steps are more effective on lower time frames, where precision is key, whereas larger rounding steps help to reduce clutter and highlight key levels on higher time frames. Each image includes a caption to explain the specific configuration used, helping users better understand how to apply these settings in different market conditions.
Smaller Rounding Step (100) : With a smaller rounding step, the gridlines are spaced closely together. This setting is particularly useful for lower time frames where price action is more granular and finer details are needed. It allows traders to track price interactions at narrower levels, but on higher time frames, it may lead to clutter and exceed Pine Script's 500-line limit.
Larger Rounding Step (1000) : With a larger rounding step, the gridlines are spaced farther apart. This visualization is better suited for higher time frames or broader market overviews, allowing users to focus on major psychological levels without overloading the chart. On lower time frames, this may result in fewer actionable levels, but it helps in maintaining clarity and staying within Pine Script's line limit.
Linear Grid Type, Neutral Direction (Traditional Rounded Price Levels) : The Linear gridlines are displayed in a neutral fashion, representing traditional round-number levels with consistent spacing above and below the current price. This layout helps visualize key psychological price levels over time in a straightforward manner.
Linear Grid Type, Down Direction : The Linear gridlines are tilted downwards, remaining parallel and ending at the rounded level at the current price. This setup emphasizes downward market sentiment, allowing traders to visualize price expansion towards lower levels, which is useful when analyzing downtrends or potential correction levels.
Linear Grid Type, Down Direction : The Linear gridlines are tilted downwards, extending from the current price to lower levels. Useful for observing downtrending price movements and visualizing pullback areas during uptrends.
Linear Grid Type, Auto Direction : The Linear gridlines adjust dynamically, tilting either upwards or downwards to align with recent price trends, remaining parallel and ending at the rounded level at the current price. This configuration reflects the current market sentiment and offers traders a flexible way to observe price dynamics as they develop in real time.
Fan Grid Type, Neutral Direction : The fan-shaped gridlines radiate symmetrically from a central point, ending at the rounded level at the current price. This configuration provides an unbiased view of price action, giving traders a balanced visualization of rounded levels without directional influence.
Fan Grid Type, Up Direction : The fan-shaped gridlines originate from lower visible price points and radiate upwards, ending at the rounded level at the current price. This layout helps visualize potential price expansion to higher levels, offering insights into upward momentum while maintaining a dynamic and evolving perspective on market conditions.
Fan Grid Type, Down Direction : The fan-shaped gridlines originate from higher visible price points and radiate downwards, ending at the rounded level at the current price. This setup is particularly useful for observing potential price expansion towards lower levels, illustrating areas where the price might extend during a downtrend.
Fan Grid Type, Auto Direction : The fan-shaped gridlines dynamically adjust, originating from visible chart points based on the current market trend, and radiate outward, ending at the rounded level at the current price. This adaptive visualization offers a continuously evolving representation that aligns with changing market sentiment, helping traders assess price expansion dynamically.
📊 SUMMARY 📊
The Rounded Grid Levels indicator helps traders highlight important round-number price levels on their charts, providing a dynamic way to visualize these psychological areas. With customizable gridline options—including traditional, tilted, and fan-shaped styles—users can adapt the indicator to suit their analysis needs. The gridlines adjust with chart zoom or scale, offering a flexible tool for observing price action, without providing specific trading signals or predictions.
⚙️ COMPATIBILITY AND LIMITATIONS ⚙️
Asset Compatibility :
The Rounded Grid Levels indicator is compatible with all asset classes, including cryptocurrencies, forex, stocks, and commodities. Users should adjust both the Rounding Step and the Major Grid settings to ensure the correct scale is used for the specific asset. This adjustment ensures that the most relevant round price levels are displayed effectively regardless of the instrument being analyzed. For instance, when analyzing BTCUSD, a higher Rounding Step may be needed compared to forex pairs like EURUSD, and the Major Grid value should also be adjusted to appropriately emphasize significant levels.
Line Limitations in Pine Script :
The Rounded Grid Levels indicator is subject to Pine Script's 500-line limit. This means that it cannot draw more than 500 gridlines on the chart at any given time. The number of gridlines depends directly on the chosen Rounding Step . If the steps are too small, the gridlines will be spaced too closely, causing the indicator to quickly reach the line limit. For example, if Ethereum is trading around $2,500, a Rounding Step of 100 might be appropriate, but a step of 1.00 would create too many gridlines, exceeding Pine Script's limit. Users should consider appropriate settings to avoid running into this constraint.
Runtime Error Considerations
When using the Rounded Grid Levels indicator, users might encounter a runtime error in specific scenarios. This typically happens if the Rounding Step is set too small, causing the indicator to exceed Pine Script's line limit or take too long to process. This can often occur when switching between charts that have significantly different price ranges. Since the Rounding Step requires flexibility to work with a wide variety of assets—ranging from decimals to thousands—it is not practically limited within the script itself. If a runtime error occurs, the recommended solution is to increase the Rounding Step to a larger value that better matches the current asset's price range.
Runtime Error: If the Rounding Step is too small for the current asset or chart, the indicator may generate a runtime error. Users should increase the Rounding Step to ensure proper visualization.
⚠️ DISCLAIMER ⚠️
The Rounded Grid Levels indicator is not designed as a predictive tool. While it extends gridlines into the future, this extension is purely for visual continuity and does not imply any forecast of future price movements. The primary function of this indicator is to help users visualize significant round number price levels.
The gridlines adjust dynamically based on the visible chart range, ensuring that the most relevant round price levels are displayed. This behavior allows the indicator to adapt to your current view of the market, but it should not be used to predict price movements. The indicator is intended as a visual aid and should be used alongside other tools in a comprehensive market analysis approach.
While gridlines may align with significant price levels in hindsight, they should not be interpreted as indicators of future price movements. Traders are encouraged to adjust settings based on their strategy and market conditions.
🧠 BEYOND THE CODE 🧠
The Rounded Grid Levels indicator, like other xxattaxx indicators , is designed with education and community collaboration in mind. Its open-source nature encourages exploration, experimentation, and the development of new grid calculation indicators, drawings, and strategies. We hope this indicator serves as a framework and a starting point for future innovations in grid trading.
Your comments, suggestions, and discussions are invaluable in shaping the future of this project. We actively encourage your feedback and contributions, which will directly help us refine and improve the Rounded Grid Levels indicator. We look forward to seeing the creative ways in which you use and enhance this tool.

Options levelsOverview
Options Levels 🎯 plots 13 key institutional and options-based levels directly on your chart — including Call Wall, Put Wall, Gamma Flip, Whales Pivot, five Whale levels, and Sigma deviation bands (σ¹ / σ²).
It’s designed for both intraday and swing traders, offering a clean visual structure with elegant emoji labels, flexible visibility controls, and precise right-edge extensions for each line.
✨ Key Features
Single structured input with 13 ordered levels:
CallWall, PutWall, GammaFlip, Whales Pivot, Whale1..Whale5, Upperσ1, Upperσ2, Lowerσ1, Lowerσ2
Expressive emoji labels (🟢, 🔴, ⚖️, 🌑, 🐋, σ¹/σ²) optimized for dark themes.
Right-edge alignment: each line extends exactly to its label — no infinite lines.
Group visibility toggles:
• Critical Levels → Call Wall, Put Wall, Gamma Flip, Whales Pivot
• Whale Levels → Whale 1–5
• Sigma Bands → Upper/Lower σ¹ and σ²
Dynamic line-length multipliers that emphasize key levels.
Built-in alert conditions:
• Price crossing above the Call Wall
• Price crossing below the Put Wall
⚙️ Inputs & Settings
📋 Level List (string) : comma-separated list of 13 numeric values.
Example:
🎨 Appearance
• Base line length (bars)
• Label visibility toggle
• Line thickness
• Extend line and label to the right
• Distance (bars) between last candle and label
👁️ Visibility Controls
• Toggle Critical, Whale, or Sigma levels independently
🚀 How to Use
Paste your list of 13 ordered levels into the input field.
Adjust base length and thickness according to your timeframe.
Enable “Extend to the right” to position labels neatly beyond the last candle.
Use visibility toggles to focus on specific level groups (e.g., hide Whale Levels for short-term setups).
Optionally enable alerts to track price breakouts above/below Call and Put Walls.
The plotted levels are derived from aggregated options flow data, institutional positioning, and volatility-based deviations (σ). They serve as reference zones rather than predictive signals, helping visualize where liquidity and dealer hedging pressure may cluster.
📖 Level Definitions
Call Wall 🟢 — The strike with the highest call open interest; potential resistance area.
Put Wall 🔴 — The strike with the highest put open interest; potential support area.
Gamma Flip ⚖️ — Level where total gamma exposure changes sign; may reflect a shift in dealer hedging behavior.
Whales Pivot 🌑 — Represents the average institutional positioning from the previous trading day, reflecting where large option flows were most concentrated.
Whale Levels 🐋 — High-premium or large-volume strikes typically linked to institutional activity.
Upper σ¹ / σ² 📈 — One and two standard deviations above spot; potential overextension zones.
Lower σ¹ / σ² 📉 — One and two standard deviations below spot; potential mean-reversion zones.
Levels are manually input by the user. This script is a visual reference, not a predictive model.
⚠️ Notes
Levels are user-provided (not calculated by this script).
The indicator does not issue buy/sell signals or provide performance guarantees.
Designed purely as a visual aid for contextual market reference.
Optimized with barstate.islast for performance (draws only at the latest bar).
Disclaimer:
This indicator is for educational and visual purposes only. It does not generate buy/sell signals or guarantee future results. User-provided levels are meant for contextual reference only.
Developed for traders who rely on market structure and options flow context. Feedback and suggestions are welcome.

Adaptive Square Levels (Prev + Curr Month, Configurable)
The Adaptive Square Levels (Configurable Edition) indicator dynamically plots price levels based on perfect squares — a concept derived from harmonic market behavior and geometric scaling.
Each month, the script automatically detects the new monthly open and generates square levels both above and below the opening price.
This version introduces full configurability, allowing traders to adjust how many square levels they want to visualize on either side of the base level. The indicator also visually separates previous and current month levels for easy reference.
⚙️ Features
🔢 User-Configurable Range: Choose how many levels to plot above and below the base level.
🧮 Mathematically Derived Levels: Based on perfect squares up to a user-defined max price.
📅 Monthly Auto-Reset: Automatically refreshes at the start of each new month.
🎨 Color-Coded Levels:
Orange → Major levels (square roots divisible by 3)
Yellow → Regular levels
Star (★) → Base level (nearest to monthly open)
🕰️ Dual Month Display: Shows both current and previous month levels for trend comparison.
💡 How to Use
Add the indicator to any symbol and timeframe (preferably daily or higher).
Adjust:
Max Price Level → The upper bound of your price universe.
Number of Levels Each Side → Controls the density of levels.
Observe how price reacts around these mathematically significant zones.
Use in confluence with your own price action, volume, or support/resistance analysis.
📊 Ideal For
Swing traders analyzing monthly trend reversals
Price structure and geometry enthusiasts
Traders exploring market harmonics or square-of-nine–based frameworks
🧠 Note
The script doesn’t provide buy/sell signals — it offers a structural map of key levels derived from square relationships.
Use it as a visual guide to align entries and exits with natural market geometry.

FVG + Bank Level Targeting w/ Alert TriggerDescription:
FVG + Bank Level Targeting w/ Alert Trigger is an intraday trading tool that combines Fair Value Gap (FVG) detection with dynamic institutional targeting using prior-day, weekly, and monthly high/low "Bank Levels." When a Fair Value Gap is detected, the script projects a logical target using the closest bank level in price's direction, and visually extends that level on your chart.
This tool is designed to help traders anticipate where price is most likely to move after an FVG appears — and alert them when price breaks through key target zones.
How It Works:
* Bank Level Calculation:
The indicator calculates Daily, Weekly, and Monthly high and low levels from the previous bar of each respective timeframe.
These are optionally plotted on the chart with a slight tick offset to avoid overlap with price.
* FVG Detection:
Bullish FVGs are defined by a gap between the low of the current candle and the high two candles prior, with a confirming middle candle.
Bearish FVGs follow the reverse pattern.
Once detected, the script finds the nearest unbroken institutional level (Bank Level) in the direction of the FVG and anchors a target line at that price level.
* Target Line Projection:
The script draws a persistent horizontal line (not just a plotted value) at the selected bank level.
These lines automatically extend a set number of bars into the future for clarity and trade planning.
* Breakout Detection:
When price crosses above a Bull Target or below a Bear Target, the script triggers a breakout condition.
These breakouts are useful for trade continuation or reversal setups.
* Alerts:
Built-in alert conditions notify you in real time when price crosses above or below a target.
These can be used to set TradingView alerts for your preferred Futures symbols or intraday pairs.
Parameters:
Tick Offset Multiplier: Adds distance between price and plotted levels.
Show Daily/Weekly/Monthly Levels: Toggle for each institutional level group.
FVG Extend Right (bars): Controls how far the target lines extend into the future.
Color Controls: Customize colors for FVG fill and target lines.
Use Case:
This indicator is designed for traders who want to:
Trade continuation or reversal moves around institutional price zones
Integrate Fair Value Gap concepts with more logical, historically anchored price targets
Trigger alerts when market structure evolves around key levels
It is especially useful for intraday Futures traders on the 15-minute chart or lower, but adapts well to any instrument with strong reactionary behavior at prior session highs/lows.

Peak Reaction Zones [BigBeluga]Peak Reaction Zones is an advanced Smart Money Concept (SMC) indicator that identifies the most recent swing high and swing low zones, helping traders determine premium and discount areas for optimal trade positioning.
🔵 Key Features:
Swing High & Low Zones:
Automatically detects the latest swing high and swing low levels.
Helps traders identify key reaction points where price is likely to respond.
Premium & Discount Concept:
The high zone represents a premium area, where price is overextended and may reverse.
The low zone represents a discount area, where price is undervalued and may bounce.
The midline dynamically marks the equilibrium of the range.
Adjustable Zone Width:
Users can fine-tune the width of the zones to match their trading style.
Wider zones capture broader reaction ranges, while narrower zones focus on precise levels.
Zone Retest Signals:
Blue markers appear when price retests the lower reaction zone, signaling potential support.
Orange markers appear when price retests the upper reaction zone, indicating possible resistance.
Price Labels for Key Levels:
Displays the price value of the swing high, swing low, and midline for quick reference.
Helps traders recognize major reaction points at a glance.
🔵 Usage:
Smart Money Trading: Utilize the premium and discount concept to align trades with institutional order flow.
Zone Reactions: Watch for price tests of reaction zones and use the retest signals to confirm potential reversals.
Midline Confirmation: If price holds above or below the midline, it can indicate directional bias.
Scalping & Swing Trading: Short-term traders can look for zone rejections, while swing traders can use the levels for trend continuation setups.
Peak Reaction Zones is a must-have tool for traders looking to trade with Smart Money Concepts, allowing for precise entries and exits based on key liquidity areas and market structure.

Previous HTF Highs, Lows & Equilibriums [dani]Previous HTF Highs, Lows & Equilibriums
Indicator Description
This powerful and user-friendly indicator is designed to help traders visualize key levels from multiple higher timeframes directly on their chart. It plots the previous session's high, low, and equilibrium (EQ) levels for up to 4 customizable timeframes, allowing you to analyze price action across different time horizons simultaneously.
Key Features
Multi-Timeframe Support:
Choose up to 4 higher timeframes (e.g., 1H, 4H, 1D, 1W) to plot levels on your chart.
Each timeframe's levels are displayed with clear, customizable lines.
Previous Session Levels:
Plots the previous session's high, low, and EQ (EQ = (high + low) / 2) for each selected timeframe.
Levels are dynamically updated at the start of each new session.
Customizable Line Styles:
Choose between solid, dashed, or dotted lines for each level.
Customize colors for high, low, and EQ levels to suit your preferences.
Dynamic Labels:
Each level is labeled with the corresponding timeframe (e.g., "1D - H" for daily high, "4H - L" for 4-hour low).
Labels are positioned dynamically to avoid clutter and ensure readability.
Toggle On/Off:
Easily toggle the visibility of all levels with a single button, making it simple to declutter your chart when needed.
Compatible with All Markets:
Works seamlessly across all instruments (stocks, forex, crypto, futures, etc.) and timeframes.
How to Use?
Add the indicator to your chart.
Select up to 4 higher timeframes to plot levels.
Customize line styles and colors to match your trading style.
Use the levels as reference points for support/resistance, breakout zones, or confluence areas.
Toggle levels on/off as needed to keep your chart clean and focused.
Disclaimer & Chat
This indicator is not a trading signal generator. It does not predict market direction or provide buy/sell signals. Instead, it is a tool to help you visualize key levels from higher timeframes, enabling you to make more informed trading decisions. Always combine this tool with your own analysis, risk management, and trading strategy.
Thank you for choosing this indicator! I hope it becomes a valuable part of your trading toolkit. Remember, trading is a journey, and having the right tools can make all the difference. Whether you're a seasoned trader or just starting out, this indicator is designed to help you stay organized and focused on what matters most—price action. Happy trading, and may your charts be ever in your favor! 😊
From, Dani.

Previous Candle AverageDescription:
The Previous Candle Average indicator is a powerful tool designed to provide traders with insights into market momentum by visualizing the relationship between the current and previous open levels for a customizable timeframe. This versatile indicator allows you to select from various timeframes, including 1 Month, 1 Week, 1 Day, 8 Hours, 4 Hours, and 1 Hour, making it suitable for different trading strategies, whether you're a swing trader, day trader, or scalper.
The indicator plots the Current Open and Previous Open levels for the selected timeframe and calculates the average value between them. By displaying these critical levels, traders can quickly gauge the current market dynamics relative to the previous period, making it easier to identify support, resistance, or trend continuation.
Key Features:
Custom Timeframe Selection: Easily select the desired timeframe from a variety of options (1M, 1W, 1D, 8H, 4H, 1H) to align with your trading strategy.
Current and Previous Open Levels: The indicator plots both the Current Open and Previous Open levels for the chosen timeframe, providing clear visual guidance on where the market is opening relative to the previous period.
Open Fill with Adjustable Transparency: The area between the Current Open and Previous Open levels is filled with color to represent the relationship between the two. The fill color changes based on whether the Current Open is above or below the Previous Open, with a default 20% opacity for better clarity without overwhelming the chart.
Average Line: The indicator also plots the average value between the Current Open and Previous Open levels, painted by default in a solid white color with a line thickness of 2. This average helps identify potential key levels where the price might react.
Dynamic Coloring: The fill color changes dynamically based on whether the Current Open is higher or lower than the Previous Open, using green to indicate bullish behavior and red for bearish behavior.
How to Use:
The Previous Candle Average indicator can help traders identify the momentum of the market by visually comparing the relationship between consecutive open levels.
Use the Average Line as a reference for potential support or resistance, especially when the market opens near this average.
The Open Fill color can quickly indicate a shift in market sentiment. A green fill suggests that the market is opening stronger than the previous period, while a red fill indicates weakness.
Best Practices:
Combine this indicator with other technical analysis tools, such as trend lines, moving averages, or volume analysis, to confirm potential trading opportunities.
The custom timeframe feature is particularly useful for multi-timeframe analysis. For instance, you can monitor weekly open levels while trading on an hourly chart.
Note: The indicator uses real-time open data and is updated accordingly, ensuring there is no delay or repainting of historical values.
Ideal For:
Traders who want a clear visual representation of market open levels relative to previous periods.
Those who want to identify potential shifts in momentum by comparing open levels across different timeframes.
Traders seeking to add an additional layer of analysis to their existing strategy by incorporating key opening levels and their averages.

Kalman Trend Levels [BigBeluga]Kalman Trend Levels is an advanced trend-following indicator designed to highlight key support and resistance zones based on Kalman filter crossovers. With dynamic trend analysis and actionable signals, it helps traders interpret market direction and momentum shifts effectively.
🔵 Key Features:
Trend Levels with Crossover Boxes: Identifies trend shifts by tracking crossovers between fast and slow Kalman filters. When the fast line crosses above the slow line, a green box level appears, indicating a potential support zone. When it crosses below, a red box level forms, acting as a resistance zone.
Retest Signals for Support and Resistance Levels: Enable retest signals to capture price rejections at the established levels, providing possible re-entry points where the price confirms a support or resistance area.
Adaptive Candle Coloring by Trend Momentum: Candle colors adjust based on the trend's strength:
> During a downtrend, if the fast Kalman line shows upward movement, indicating reduced bearish momentum, candles turn gray to signal the weakening trend.
> In an uptrend, when the fast Kalman line declines, showing lower bullish momentum, candles become gray, signaling a potential slowdown in upward movement.
Crossover Signals with Price Labels: Displays arrows with price values at crossover points for quick reference, marking where the fast line overtakes or dips below the slow line. These labels provide a precise price snapshot of significant trend changes.
🔵 When to Use:
The Kalman Trend Levels indicator is ideal for traders looking to identify and act upon trend changes and significant price zones. By visualizing key levels and momentum shifts, this tool allows you to:
Define support and resistance zones that align with trend direction.
Identify and react to trend weakening or strengthening via candle color changes.
Use retest signals for potential re-entries at critical levels.
See crossover points and price values to gain a clearer view of trend changes in real time.
With its focus on trend direction, support/resistance, and momentum clarity, Kalman Trend Levels is an essential tool for navigating trending markets, providing actionable insights with every crossover and trend shift.
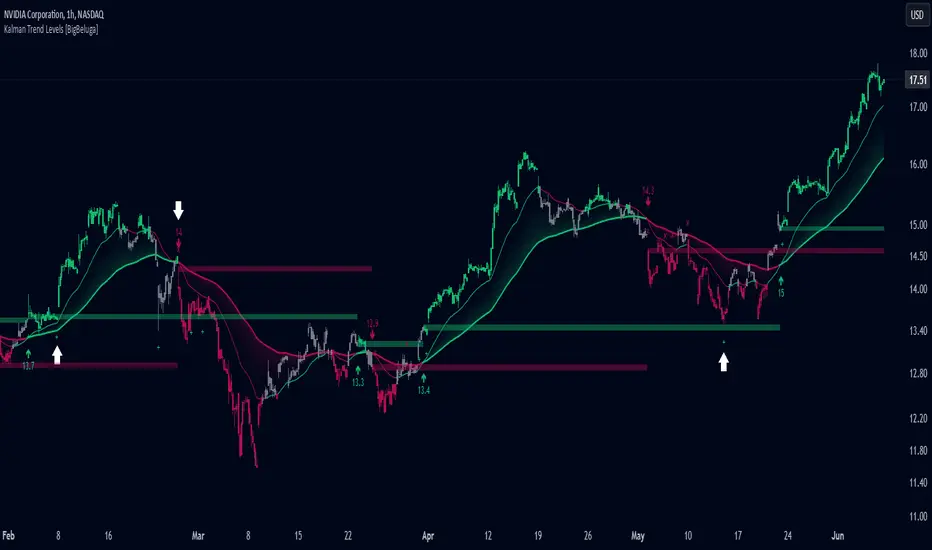
Enhanced London Session SMC SetupEnhanced London Session SMC Setup Indicator
This Pine Script-based indicator is designed for traders focusing on the London trading session, leveraging smart money concepts (SMC) to identify potential trading opportunities in the GBP/USD currency pair. The script uses multiple techniques such as Order Block Detection, Imbalance (Fair Value Gap) Analysis, Change of Character (CHoCH) detection, and Fibonacci retracement levels to aid in market structure analysis, providing a well-rounded approach to trade setups.
Features:
London Session Highlight:
The indicator visually marks the London trading session (from 08:00 AM to 04:00 PM UTC) on the chart using a blue background, signaling when the high-volume, high-impulse moves tend to occur, helping traders focus their analysis on this key session.
Order Block Detection:
Identifies significant impulse moves that may form order blocks (supply and demand zones). Order blocks are areas where institutions have executed large orders, often leading to price reversals or continuation. The indicator plots the high and low of these order blocks, providing key levels to monitor for potential entries.
Imbalance (Fair Value Gap) Detection:
Detects and highlights price imbalances or fair value gaps (FVG) where the market has moved too quickly, creating a gap in price action. These areas are often revisited by price, offering potential trade opportunities. The upper and lower bounds of the imbalance are visually marked for easy reference.
Change of Character (CHoCH) Detection:
This feature identifies potential trend reversals by detecting significant changes in market character. When the price action shifts from bullish to bearish or vice versa, a CHoCH signal is triggered, and the corresponding level is marked on the chart. This can help traders catch trend reversals at key levels.
Fibonacci Retracement Levels:
The script calculates and plots the key Fibonacci retracement levels (0.618 and 0.786 by default) based on the highest and lowest points over a user-defined swing lookback period. These levels are commonly used by traders to identify potential pullback zones where price may reverse or find support/resistance.
Directional Bias Based on Market Structure:
The indicator provides a market structure analysis by comparing the current highs and lows to the previous periods' highs and lows. This helps in identifying whether the market is in a bullish or bearish state, providing a clear directional bias for trade setups.
Alerts:
The indicator comes with built-in alert conditions to notify the trader when an order block, imbalance, CHoCH, or other significant price action event is detected, ensuring timely action can be taken.
Ideal Usage:
Timeframe: Suitable for intraday trading, particularly focusing on the London session (08:00 AM to 04:00 PM UTC).
Currency Pair: Specifically designed for GBP/USD but can be adapted to other pairs with similar market behavior.
Trading Strategy: Best used in conjunction with a price action strategy, focusing on the key levels identified (order blocks, FVG, CHoCH) and using Fibonacci retracement levels for precision entries.
Target Audience: Ideal for traders who follow smart money concepts (SMC) and are looking for a structured approach to identify high-probability setups during the London session.

Previous Highs + Lows by HAZED📈 Introducing: Previous Highs + Lows by H A Z E D 📉
✨ Overview
Get a clear view of market levels with Previous Highs + Lows v1.0! This indicator lets you track critical previous highs and lows across multiple timeframes, marking them directly on your chart for an intuitive view of support and resistance zones. Whether you’re analyzing breakouts or looking for reversal levels, these indicators provide essential context to refine your trades.
🛠️ Key Features
Multiple Timeframes Supported
Toggle on previous highs and lows for daily, weekly, monthly, 4-hour, and 1-hour charts to match your analysis style.
Customizable Labels
Choose label sizes from “tiny” to “huge,” adjust the opacity to blend seamlessly with your chart, and customize text color for optimal readability.
Label Position Control
Avoid overlap with a flexible label offset feature, allowing for 10 adjustable increments to fit your preference and chart layout.
Clear Visual Cues
Labels use icons to differentiate high (⬆️) and low (⬇️) levels at a glance, providing a straightforward way to interpret key price areas.
Instant Alerts for Key Levels
Receive alerts when the price crosses over previous high levels, keeping you informed about potential breakout zones without constant chart-watching.
🚀 How to Use
Identify Key Levels: Quickly locate significant highs and lows from previous periods to define your support and resistance zones.
Set Alerts: Stay updated on market moves with built-in alerts when prices cross these critical levels.
Customize Your View: Use the various options to make this indicator uniquely yours – adjust label size, color, opacity, and position.
🔔 Why Use Previous Highs + Lows v1.0?
Enhanced visibility of critical levels saves you time by giving you a structured view of price action.
Customization features let you adapt the indicator to your personal style and chart setup.
Flexible alerts mean you can focus on other tasks without missing important price movements.
🔗 License: Mozilla Public License 2.0
© H A Z E D, 11/4/2024

Confluence StrategyOverview of Confluence Strategy
The Confluence Strategy in trading refers to the combination of multiple technical indicators, support/resistance levels, and chart patterns to identify high-probability trading opportunities. The idea is that when several indicators agree on a price movement, the likelihood of that movement being successful increases.
Key Components
Technical Indicators:
Moving Averages (MA): Commonly used to determine the trend direction. Look for crossovers (e.g., the 50-day MA crossing above the 200-day MA).
Relative Strength Index (RSI): Helps identify overbought or oversold conditions. A reading above 70 may indicate overbought conditions, while below 30 suggests oversold.
MACD (Moving Average Convergence Divergence): Useful for spotting changes in momentum. Look for MACD crossovers and divergence from price.
Support and Resistance Levels:
Identify key levels where price has historically reversed. These can be drawn from previous highs/lows, Fibonacci retracement levels, or psychological price levels.
Chart Patterns:
Patterns like head and shoulders, double tops/bottoms, or flags can indicate potential reversals or continuations in price.
Strategy Implementation
Set Up Your Chart:
Add the desired indicators (e.g., MA, RSI, MACD) to your TradingView chart.
Mark significant support and resistance levels.
Identify Confluence Points:
Look for situations where multiple indicators align. For instance, if the price is near a support level, the RSI is below 30, and the MACD shows bullish divergence, this may signal a buying opportunity.
Entry and Exit Points:
Entry: Place a trade when your confluence conditions are met. Use limit orders for better prices.
Exit: Set profit targets based on resistance levels or use trailing stops. Consider the risk-reward ratio to ensure your trades are favorable.
Risk Management:
Always implement stop-loss orders to protect against unexpected market moves. Position size should reflect your risk tolerance.
Example of a Confluence Trade
Setup:
Price approaches a strong support level.
RSI shows oversold conditions (below 30).
The 50-day MA is about to cross above the 200-day MA (bullish crossover).
Action:
Enter a long position as the conditions align.
Set a stop loss just below the support level and a take profit at the next resistance level.
Conclusion
The Confluence Strategy can significantly enhance trading accuracy by ensuring that multiple indicators support a trade decision. Traders on TradingView can customize their indicators and charts to fit their personal trading styles, making it a flexible approach to technical analysis.
