New Highs-New-Lows on US Stock Market - Main Chart Edition#### ENGLISH ####
This script visualizes divergences between the price and new highs and new lows in the US stock market. The indicator should be used exclusively on the US stock indices (timeframe >= D).
This is the indicator for the main chart. It should be used together with the subchart indicator of the same name. In order to get the same results between the main and subchart editions, the indicator settings must be manually adjusted equally in both charts.
The approach:
Let's take a bull market as an example. A bull market is characterized by rising highs and rising lows. We can therefore assume that with the rising prices, the number of stocks that form new highs also rises or at least remains constant. This confirms the upward trend and thus expresses that it is supported by the broad stock market. If the market forms new highs and the number of stocks forming new highs decreases at the same moment, these new index highs are no longer supported by the broad stock market but exclusively by a few highly capitalized stocks. This creates a bearish divergence between the index and the NHNL indicator. This means that the uptrend tends to be overheated and a correction becomes more likely. Stops should be drawn closer.
The approach applies conversely, of course, to downtrends as well.
The indicator itself:
The number of new highs and lows (NHNL) are determined using the data sources included in Tradingview, such as "INDEX:HIGN" for NYSE highs. This data is provided on a daily basis. For higher time units (week, month) the daily numbers are shown summed up and not only the Friday value like most other NHNL indicators.
The signal strength is determined on the basis of two factors. The stronger the signal, the clearer (less transparent) the line/arrow. The two factors are on the one hand the strength of the divergence in and of itself, and on the other hand the strength of the overriding trend. The trend strength is determined using a 50 EMA on the NHNL indicator.
To avoid displaying every small divergence and to reduce false signals, the threshold for the signal strength can be set in the indicator settings.
#### GERMAN #####
Dieses script visualisiert Divergenzen zwischen dem Preis und neuer Hochs sowie neuer Tiefs im US Aktienmarkt. Der Indikator sollte ausschließlich auf den US Aktienindizes verwendet werden (Timeframe >= D).
Dies ist der Indikator für den Hauptchart. Er sollte zusammen mit dem gleichnamigen Subchart Indikator verwendet werden. Um gleiche Ergebnisse zwischen Haupt- und Subchart Edition zu erhalten, müssen die Indikatoreistellung manuell in beiden Charts gleichermaßen eigestellt werden.
Der Ansatz:
Nehmen wir uns als Beispiel einen Bullenmarkt. Ein Bullenmarkt zeichnet sich durch steigende Hochs und steigende Tiefs aus. Man kann also annehmen, dass mit den steigenden Preisen auch die Anzahl der Aktien die neuen Hochs ausbilden steigt oder zumindest konstant bleibt. Dies bestätigt den Aufwärtstrend und drückt somit aus, dass dieser vom breiten Aktienmarkt mitgetragen wird. Wenn der Markt neue Hochs bildet und die Anzahl der Aktien, die neue Hochs bilden im selben Moment sinkt, so werden diese neuen Indexhochs vom breiten Aktienmarkt nicht mehr getragen sonder ausschließlich von wenigen hochkapitalisierten Aktien. Es entsteht eine bärische Divergenz zwischen Index und dem NHNL Indikator. Das bedeutet, dass der Aufwärtstrend tendenziell überhitzt ist und ein Korrektur wahrscheinlicher wird. Die Stops sollten näher herangezogen werden.
Der Ansatz gilt umgekehrt natürlich auch bei Abwärtstrends.
Der Indikator an sich:
Die Anzahl der neuen Hochs und Tiefs (NHNL) werden anhand der in Tradingview enthaltenen Datenquellen wie z.B. "INDEX:HIGN" für die NYSE Hochs ermittelt. Diese Daten werden auf Tagesbasis bereitgestellt. Für höher Zeiteinheiten (Woche, Monat) werden die Tageszahlen aufsummiert dargestellt und nicht wie bei den meisten anderen NHNL Indikatoren nur der Freitagswert.
Die Signalstärke wird Anhand zweier Faktoren ermittelt. Je stärker das Signal um so deutlicher (weniger transparent) die Linie/der Pfeil. Die zwei Faktoren sind zum einen die stärke der Divergenz an und für sich, sowie zum anderen die Stärke des übergeordneten Trends. Die Trendstärke wird anhand eines 50er-EMA auf den NHNL-Indikator ermittelt.
Um nicht jede kleine Divergenz anzuzeigen und um Fehlsignale zu reduzieren, kann die Schwelle für die Signalstärke in den Indikatoreinstellungen festgelegt werden.
Cerca negli script per "low"
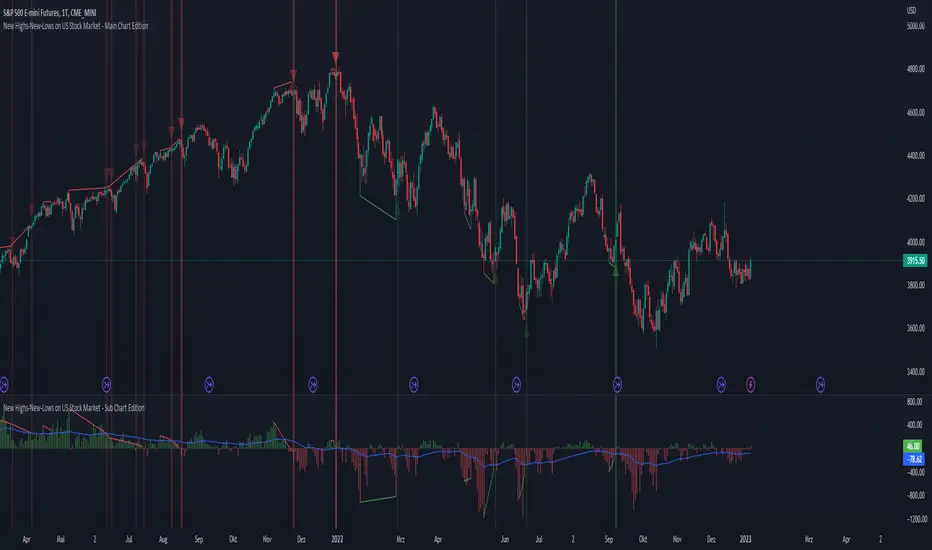
New Highs-New-Lows on US Stock Market - Sub Chart Edition#### ENGLISH ####
This script visualizes divergences between the price and new highs and new lows in the US stock market. The indicator should be used exclusively on the US stock indices (timeframe >= D).
This is the indicator for the sub chart. It should be used together with the main chart indicator of the same name. In order to get the same results between the main and subchart editions, the indicator settings must be manually adjusted equally in both charts.
The approach:
Let's take a bull market as an example. A bull market is characterized by rising highs and rising lows. We can therefore assume that with the rising prices, the number of stocks that form new highs also rises or at least remains constant. This confirms the upward trend and thus expresses that it is supported by the broad stock market. If the market forms new highs and the number of stocks forming new highs decreases at the same moment, these new index highs are no longer supported by the broad stock market but exclusively by a few highly capitalized stocks. This creates a bearish divergence between the index and the NHNL indicator. This means that the uptrend tends to be overheated and a correction becomes more likely. Stops should be drawn closer.
The approach applies conversely, of course, to downtrends as well.
The indicator itself:
The number of new highs and lows (NHNL) are determined using the data sources included in Tradingview, such as "INDEX:HIGN" for NYSE highs. This data is provided on a daily basis. For higher time units (week, month) the daily numbers are shown summed up and not only the Friday value like most other NHNL indicators.
The signal strength is determined on the basis of two factors. The stronger the signal, the clearer (less transparent) the line/arrow. The two factors are on the one hand the strength of the divergence in and of itself, and on the other hand the strength of the overriding trend. The trend strength is determined using a 50 EMA on the NHNL indicator.
To avoid displaying every small divergence and to reduce false signals, the threshold for the signal strength can be set in the indicator settings.
#### GERMAN #####
Dieses script visualisiert Divergenzen zwischen dem Preis und neuer Hochs sowie neuer Tiefs im US Aktienmarkt. Der Indikator sollte ausschließlich auf den US Aktienindizes verwendet werden (Timeframe >= D).
Dies ist der Indikator für den Subchart. Er sollte zusammen mit dem gleichnamigen Hauptchart Indikator verwendet werden. Um gleiche Ergebnisse zwischen Haupt- und Subchart Edition zu erhalten, müssen die Indikatoreistellung manuell in beiden Charts gleichermaßen eigestellt werden.
Der Ansatz:
Nehmen wir uns als Beispiel einen Bullenmarkt. Ein Bullenmarkt zeichnet sich durch steigende Hochs und steigende Tiefs aus. Man kann also annehmen, dass mit den steigenden Preisen auch die Anzahl der Aktien die neuen Hochs ausbilden steigt oder zumindest konstant bleibt. Dies bestätigt den Aufwärtstrend und drückt somit aus, dass dieser vom breiten Aktienmarkt mitgetragen wird. Wenn der Markt neue Hochs bildet und die Anzahl der Aktien, die neue Hochs bilden im selben Moment sinkt, so werden diese neuen Indexhochs vom breiten Aktienmarkt nicht mehr getragen sonder ausschließlich von wenigen hochkapitalisierten Aktien. Es entsteht eine bärische Divergenz zwischen Index und dem NHNL Indikator. Das bedeutet, dass der Aufwärtstrend tendenziell überhitzt ist und ein Korrektur wahrscheinlicher wird. Die Stops sollten näher herangezogen werden.
Der Ansatz gilt umgekehrt natürlich auch bei Abwärtstrends.
Der Indikator an sich:
Die Anzahl der neuen Hochs und Tiefs (NHNL) werden anhand der in Tradingview enthaltenen Datenquellen wie z.B. "INDEX:HIGN" für die NYSE Hochs ermittelt. Diese Daten werden auf Tagesbasis bereitgestellt. Für höher Zeiteinheiten (Woche, Monat) werden die Tageszahlen aufsummiert dargestellt und nicht wie bei den meisten anderen NHNL Indikatoren nur der Freitagswert.
Die Signalstärke wird Anhand zweier Faktoren ermittelt. Je stärker das Signal um so deutlicher (weniger transparent) die Linie/der Pfeil. Die zwei Faktoren sind zum einen die stärke der Divergenz an und für sich, sowie zum anderen die Stärke des übergeordneten Trends. Die Trendstärke wird anhand eines 50er-EMA auf den NHNL-Indikator ermittelt.
Um nicht jede kleine Divergenz anzuzeigen und um Fehlsignale zu reduzieren, kann die Schwelle für die Signalstärke in den Indikatoreinstellungen festgelegt werden.

High Low Color VolumeCompanion to High Low Color Bars, for strategies that don't use open and close levels. Color is determined using change in midpoints between high and low ( hl2 ), with degrees of shading based on threshold levels in the settings. The default threshold is 1.2 standard deviations of the change in hl2.
I use this to get a less noisy visual of volume-driven momentum.

Multi Timeframe Support & ResistanceAbout This Indicator
This indicator plots support (pivot low) and resistance (pivot high) using the chart timeframe and second editable timeframe.
How it can be useful
Having higher timeframe support and resistance plotted on a lower timeframe chart helps keep you grounded in the current range the price is in. This can be useful when wanting to avoid taking longs at resistance and shorts at support.
How to use
Adjusting the look back and look ahead will impact how frequently the support and resistance lines move. When Price breaks above resistance or below support, the lines will not move until a new pivot high and pivot low are detected.
Disclaimer: Not Financial Advice

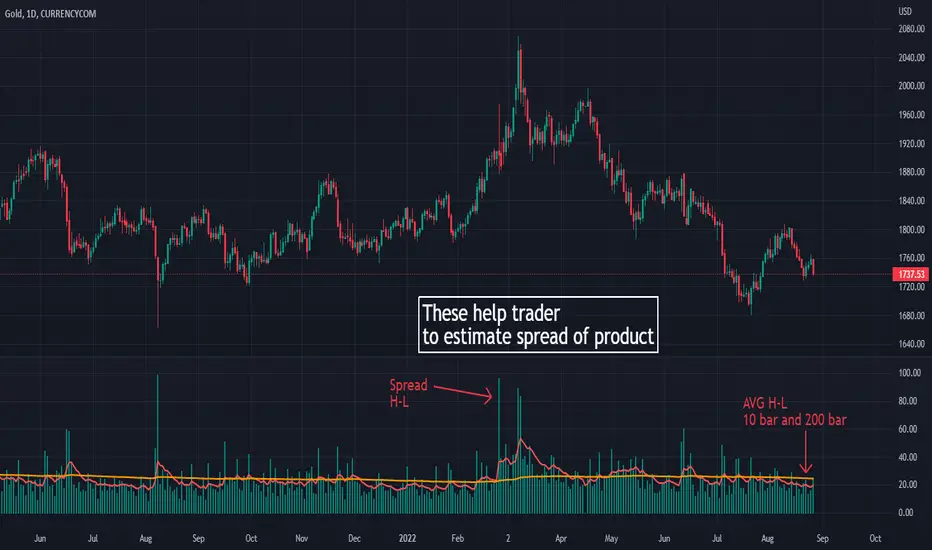
High low volatile
its purpose to make this script is learning how many spread on each product.
its help trader and me to estimate spread of High and low for make a better trade
Money management :
Its also useful to help trader to manage number of lot to take a risk on that trade
How it work?
I use High and low to calculate the different between on them
and I add an EMA 10 and EMA 200 to estimate spread of each product in many bar
On second picture , I use it on GOLD 1H timeframe . You can see that Gold in hour trade on my country time (thailand) It has more spread on 19.00-23.00 pm (in US time is 7.00-11.00)
It help trader to set time when to trade and when to leave
thank you
DKNS_Daily Weekly Monthly High Low Open CloseDKNS_Daily Weekly Monthly High Low Open Close, it will give daily weekly monthly high low close open

'last red low / last green high' exitThis is a good alternative to pivot points and ma lines to find long and short exit points (stop loss prices) for a trade.
When you hear traders say "set the stop loss to the recent swing", this indicator seems to do a reasonable job of finding those.
This script marks
the low of the most recent red candle
the high of the most recent green candle
in order to help identify a reasonable stop loss exit point for long and short trades.
You can also specify a distance threshold to the stop loss point.
How to use it.
Decide how far from the current price the exit should be (default 1.5%)
Use your chosen trading strategy to identify a long or short entry position
Add a long/short drawing to the close of the trade candle
Set the stop loos of your drawing to the exit line of this indicator
Set the take profit of your drawing using the desired risk to reward ratio
Note: A good rule is that if this indicator does not show a valid exit line, do not enter the trade.
Note: If the change of a new "last Green High" or the "last Red Low" is below 0.5%, the indicator will keep the previous values

3D GATOR %HLThis indicator tracks the 3 day trading bots and measures the high and the low (%).
Usually a trend can change or continue every 3 days.
When volatility decreases and both values are the same gator is going to open its jaws so it's a good time to open a position long. Avoid shorts during low volatility.
On the other hand when volatility increases, and gator has its jaws wide open is a good time to look for shorts.
That's pretty much it.
This indicator was designed by me and created by Marketwatcher.

Previous High/Low LevelsPrevious High/Low Levels
Select 5 Custom Timeframes to display the previous High and Low levels on your chart.
NOTE: For Levels to work correctly and for price labels to be displayed, Right-click chart background -> select Settings -> select Scales -> tick “Indicator Last Value Label".
Once indicator has been added open settings and select timeframe, color, labels, offset parameters and line style as desired then SAVE.
Handy when using The Strat.

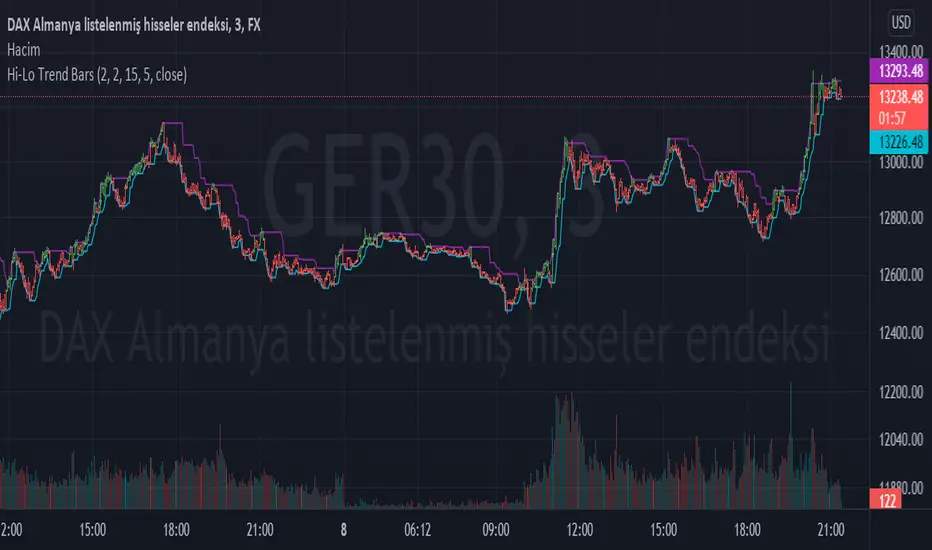
Hi-Lo Trend BarsI present to you a simple but useful indicator.
The basic logic is an indicator that tracks the high of the high bars in the specified range and the low of the low bars in the specified range.
I used two multipliers in order to go out of certain ranges and I tried to provide precision by subtracting this multiplier value from the lowest and highest values.
I set the steps of the multipliers to 0.01 so that it is easy to use on instruments that require finer tuning.
Because every instrument has its own dynamics. You should change the multiplier values according to the instrument dynamics.
For example, under Spot, these multiplier values work efficiently with a large multiplier such as 2.0. It is more efficient in the range of 0.1 - 0.2 in the stock market.
I hope your transactions will be of some use in directional evaluation.
Thanks.
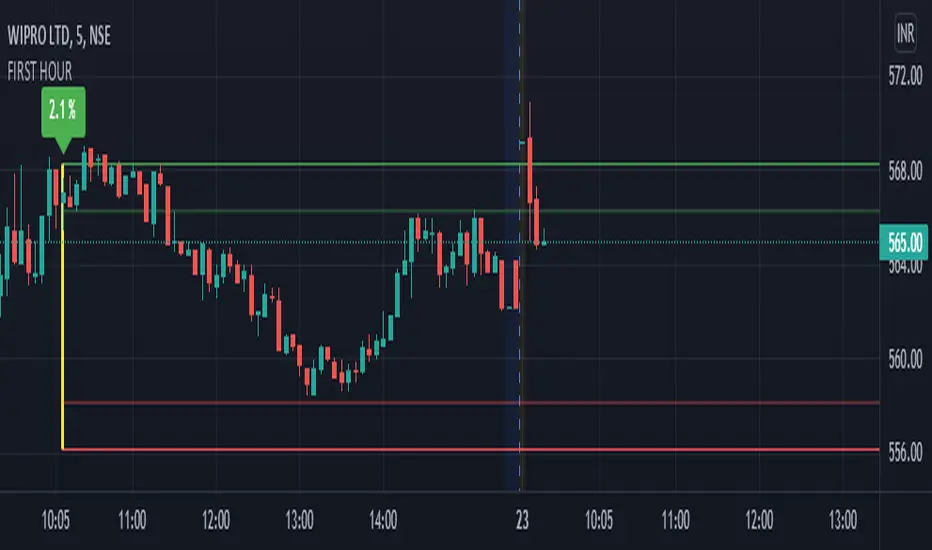
first hour high and low by akash mauryaThis indicator marks the first hour's high and low with a line with the percentage of range height.
First hour high and low generally act as heavy support and resistance or say major key areas in daily intraday charts.
You can adjust the settings if you want to see previous days' hour range lines or not.
This indicator will automatically create hour-range lines after an hour of market opening.
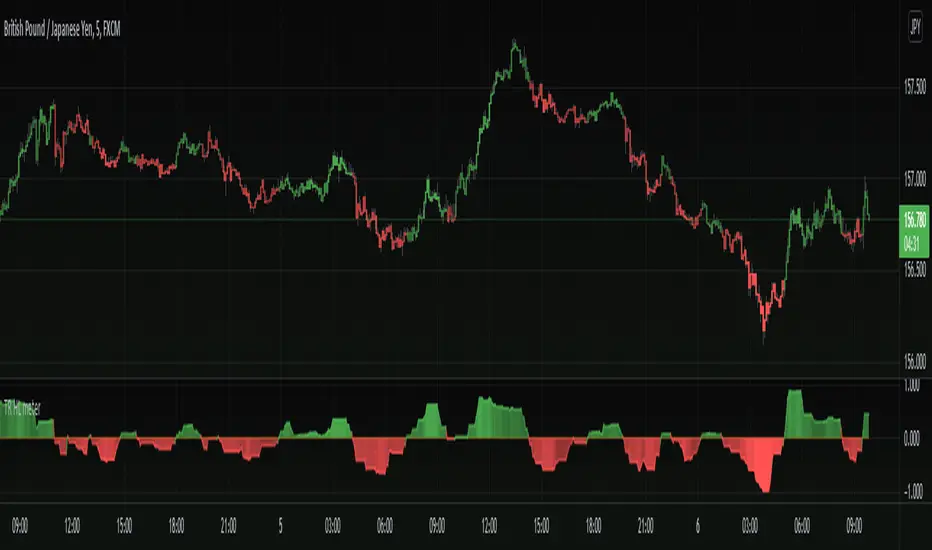
TR High/Low meterInteresting take for a velocity and trend analysis indicator, I call it The TR high/low meter.
First it will find the highest high and lowest low based on X bars back.
Now comes the twist, instead of storing these lowest or highest prices, we store the TR (true range) into the appropriate array (one array for lowest and one array for highest).
Finally, we sum up these two arrays for highest TR's and lowest TR's and subtract each other to get the difference, Hench, see who is stronger.
In the end we plot the difference into the indicator we have here.
The plot is colored with gradient color in which bright color emphasizes the movement is strong and weaker color emphasizes the movement is getting weaker.
Basically this indicator shows us the asset trend direction and strength. Awesome!
==Colors and Bar Colors==
Green: Up Trending
Light Green: Weakening up trend
Red: Down Trending.
Light Red: Weakening Down Trending.
==Notes==
Bar coloring is enabled on this chart!
Supports EMA smoothing (disabled by default)
Like if you like and Enjoy! Follow for more upcoming indicators/strategies: www.tradingview.com
HL Strategy - High Low - 5/5Pivot points observing higher highs, lower lows, lower hights and higher lows

52 Weeks High/Low WidgetSome time ago I published my "All-Time High/Low Widget". I was asked to build and 52w weeks version.
So finally it's ready. It works pretty much the same way but uses a time period only of 52weeks.
You can also change the number of weeks in the parameters.
You can plot the levels and display some stats when 52W high/low happened and how far away are we at this moment.
Also, you can create alerts to get notified on 52W levels breakouts.
Disclaimer
Please remember that past performance may not be indicative of future results.
Due to various factors, including changing market conditions, the strategy may no longer perform as well as in historical backtesting.
This post and the script don’t provide any financial advice.

Daily DeviationShows you the normal deviation from the OPEN based upon historical data.
Levels measured:
Normal range (1 standard deviation) of the CLOSE (vs the OPEN).
Normal daily HIGH +1, +2, +3, and +4 standard deviations.
Normal daily LOW -1, -2, -3, and -4 standard deviations.
Configuration:
Always shows you the normal CLOSE vs OPEN range for the current session.
Can display previous day's ranges (extra days) based upon the calendar (not trading days).
Normally displays which levels have been exceeded (to reduce noise and keep auto-scale to a minimum), but can show all the ranges for the current session.
The default number of days to measure (50) will affect the accuracy but outliers are cleaned to avoid dramatic variance.
Note:
These are only statistical representations of what has occurred in the past. You can interpret the current price as oversold or overbought for the day (and only that day) relative to the OPEN. Gaps high or low are not considered in the equation.

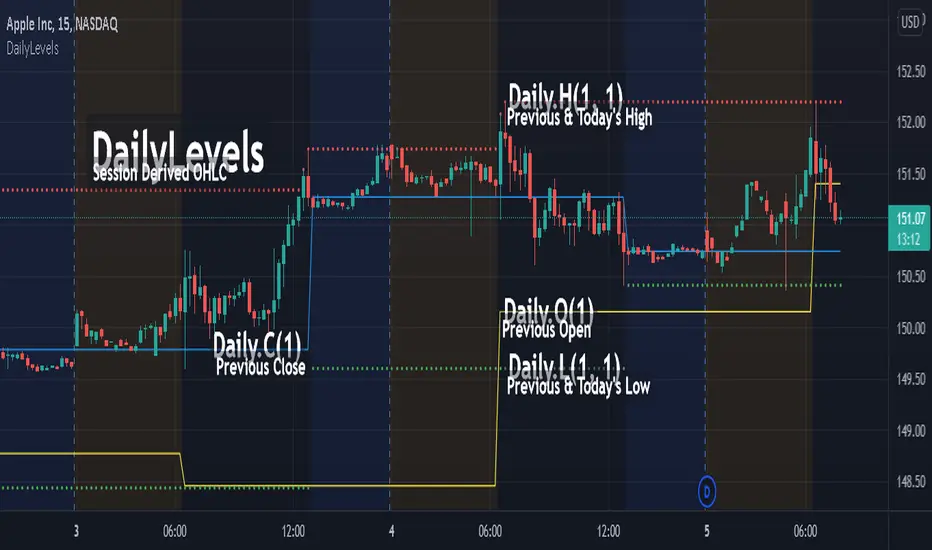
DailyLevelsLibrary "DailyLevels"
Functions for acquiring daily timeframe data by number of prior days.
openD(daysPrior, spec, res) Gets the open for the number of days prior.
Parameters:
daysPrior : Number of days back to get the open from.
spec : session.regular (default), session.extended or other time spec.
res : The resolution (default = '1440').
Returns: The open for the number of days prior.
highD(daysPrior, extraForward, spec, res) Gets the highest value for the number of days prior.
Parameters:
daysPrior : Number of days back to get the high from.
extraForward : Number of extra days forward to include.
spec : session.regular (default), session.extended or other time spec.
res : The resolution (default = '1440').
Returns: The high for the number of days prior.
lowD(daysPrior, extraForward, spec, res) Gets the lowest value for the number of days prior.
Parameters:
daysPrior : Number of days back to get the low from.
extraForward : Number of extra days forward to include.
spec : session.regular (default), session.extended or other time spec.
res : The resolution (default = '1440').
Returns: The low for the number of days prior.
closeD(daysPrior, spec, res) Gets the close for the number of days prior.
Parameters:
daysPrior : Number of days back to get the open from. 0 produces the current close
spec : session.regular (default), session.extended or other time spec.
res : The resolution (default = '1440').
Returns: The close for the number of days prior.
hlc3D(daysPrior, extraForward, spec, res) Gets the HLC3 value for the number of days prior.
Parameters:
daysPrior : Number of days back to get the HLC3 from.
extraForward : Number of extra days forward to include. Determines the closing value.
spec : session.regular (default), session.extended or other time spec.
res : The resolution (default = '1440').
Returns: The HLC3 for the number of days prior.
ICHIMOKU Crypto Swing StrategyThis is a crypto swing strategy designed for timeframes bigger than 1h.
The main components are
ICHOMOKU
KDJ
Average High
Average Low
Rules for entry
For long: we have the ichimoku crosses between tenkan and baselines, we have a rising kdj line and at the same time we have a increase in the average high
For short: we have the ichimoku crosses between tenkan and baselines, we have a falling kdj line and at the same time we have an increase in the average low
Rules for exit
We exit when we have inverse conditions than the initial ones used for entry.
Caution
This strategy does not use a risk management, so be careful with it !
If you have any questions let me know !

Michigandolf's 30min Opening RangeThis script plots the 30min Opening Range as well as the previous day's high & low.
Description:
Blue Line = Top of the 30min Opening Range for the session
Pink Line = Bottom of the 30min Opening Range for the session
White Line = Mid-Point of the 30min Opening Range for the session
White Transparent Area = The full range of the 30min Opening Range
Green Line = Yesterday's High for the session
Red Line = Yesterday's Low for the session
Use:
The Opening Range will continue to expand until the first 30minutes of trading has passed, at which point the range will lock in place for the remainder of the trading session. Many traders use these important levels to gauge trade entries and exits (e.g. Mark Fisher's ACD strategy).
This script does not work currently work for futures (e.g. ES, NQ, RTY) due to the session start time. Will configure for futures trading in a future update.

Pivot High/Low Analysis & Forecast [LuxAlgo]Returns pivot points high/low alongside the percentage change between one pivot and the previous one (Δ%) and the distance between the same type of pivots in bars (Δt). The trailing mean for each of these metrics is returned on a dashboard on the chart. The indicator also returns an estimate of the future time position of the pivot points.
This indicator by its very nature is not real-time and is meant for descriptive analysis alongside other components of the script. This is normal behavior for scripts detecting pivots as a part of a system and it is important you are aware the pivot labels are not designed to be traded in real-time themselves
🔶 USAGE
The indicator can provide information helping the user to infer the position of future pivot points. This information is directly used in the indicator to provide such forecasting. Note that each metric is calculated relative to the same type of pivot points.
It is also common for analysts to use pivot points for the construction of various figures, getting the percentage change and distance for each pivot point can allow them to eventually filter out points of non-interest.
🔹 Forecast
We use the trailing mean of the distance between respective pivots to estimate the time position of future pivot points, this can be useful to estimate the location of future tops/bottoms. The time position of the forecasted pivot is given by a vertical dashed line on the chart.
We can see a successful application of this method below:
Above we see the forecasted pivots for BTCUSD15. The forecast of interest being the pivot high. We highlight the forecast position with a blue dotted line for reference.
After some time we obtain a new pivot high with a new forecast. However, we can see that the time location of this new pivot high matches perfectly with the prior forecast.
The position in time for the forecast is given by:
x1_ph + E
x1_pl + E
where x1_ph denotes the position in time of the most recent pivot high. x1_pl denotes the position in time of the most recent pivot low and E the average distance between respective pivot points.
🔶 SETTINGS
Length: Window size for the detection of pivot points.
Show Forecasted Pivots: Display forecast of future pivot points.
🔹 Dashboard
Dashboard Location: Location of the dashboard on the chart
Dashboard Size: Size of the dashboard on the chart
Text/Frame Color: Determines the color of the frame grid as well as the text color

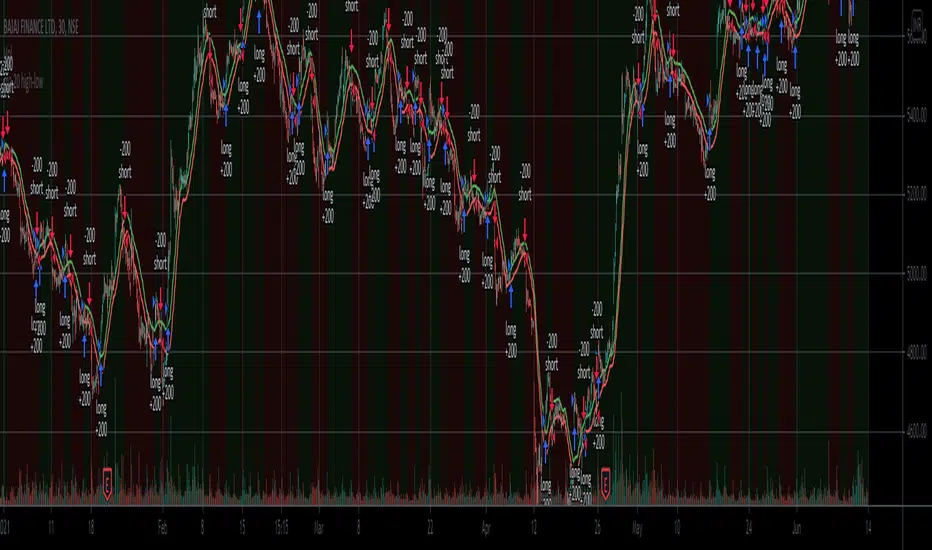
ma 20 high-lowThis is a simple 20-period high and low SMA strategy. We buy the stock when it closes above the 20 period SMA of high prices and sell when it closes below it. We sell when the price closes below 20 period SMA of low prices. This strategy works phenomenally well for a few stocks examples are bajaj finance and bajaj finserv. I want to see if it makes a good return in future. It works well for 30 mins and a daily time frame.
#TheStrat - Highs and Lows of Candles of 4 Custom Time framesThe bread and butter of strat traders is multi-timeframe analysis. We do MTFA in 2 different ways: 1) By Looking for entries confirmed by Full Timeframe Continuity which is just another way of saying that on multiple timeframes, the candles currently forming are all uniform in direction(ie. all red candles or all green candles), and 2) Looking for Strat reversal on lower timeframes that trigger your higher timeframes reversals.
This script is concerned with the latter piece of multi-timeframe analysis, and its application to the strat
Anyone who has watched Sara's videos teaching the strat can see how she uses the highs and lows of her major time periods, the monthly, weekly, and daily, to find entries from her lower time periods to trigger her higher timeframes. This script performs the process of marking the highs and lows of 4-major time periods automatically so that you do not need to mark every single chart you use manually. I have found this script to be very useful, and convenient. I hope that other stratters find it as useful as I am. Below outlines how to use this, although it is mostly self-explanatory. Special thanks and credit to millerrm, who I used his original code snippets to rework his original script to something more tailored to my personal use cases.
Settings -
You can change the time periods of the candles that you would like to mark to any time frame using the 4 dropdown boxes marked TF#
You can choose to toggle the lines for each given time period on and off, in the settings by checking off each time period.
The default colors are purple, blue, orange, and white, in order respective of time from shortest to highest
The default time periods are 3hr, 6hr, 12hr, and daily

Distance High-Low, Open-Close 8 DaysPinescript tables are a nice addition to the language. This one shows a complete distance from daily low to daily high and/or from the daily open to the daily close.
► You can show the distance between low and high
► You can show the distance between open and close
► Have this data for 8 last days
► Flip a table if you need to
I used the original TradingView's code in their news blog.
Have a nice day!

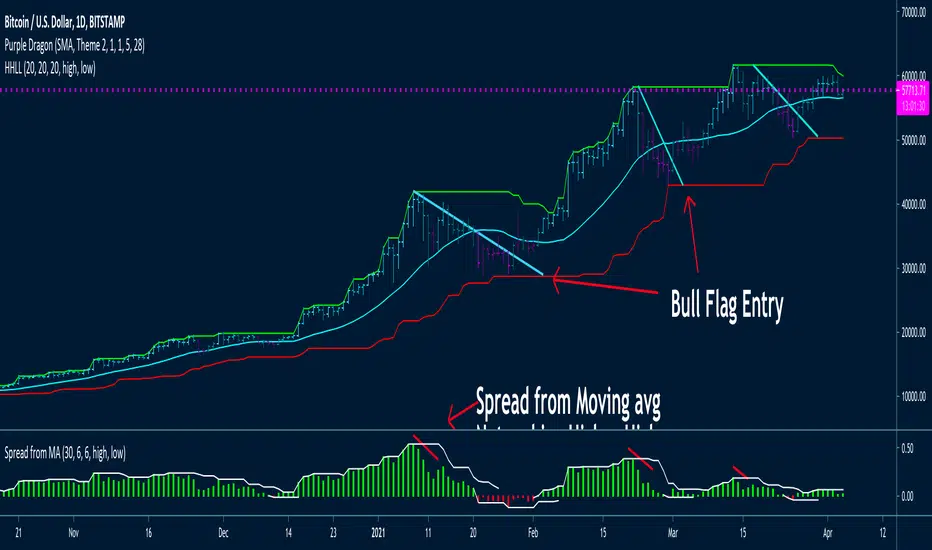
Highest High, Lowest LowHi guys,
This is a simple indicator that I think looks 😎
Basically just determines what the Highest High and the Lowest Low for X bars is.
As many of you know, moving averages are quite susceptible to noise ~ I like how how this really shows key inflection points on the chart and reduces trade signal chop which leads to losses.
Seems to be a good system to use with bull flags, on tickers like: BTCUSD, TQQQ, SSO, SPX etc.
Highest High and Lowest Low lookback periods can be changed to your needs
Have included a Moving Average
Will be coding a strategy for this in the next couple of weeks.
Have included in an alert system
Spread from Moving average indicator is available under my other scripts -- seems to indicate when price momentum is starting to stall by price not moving further away from the moving average. That would indicate good points to take profits, as price will likely do a mean reversion 😭