Previous OHLC LevelsQuick dirty code for personal use. Plots previous OHLC levels based on a selected time-frame on the chart.
Not bad if you want to see different time-frame levels.
Fill function can serve to highlight the daily range (high-low or open-close) on non-standard charts
Uses base code from JayRogers
Cerca negli script per "low"

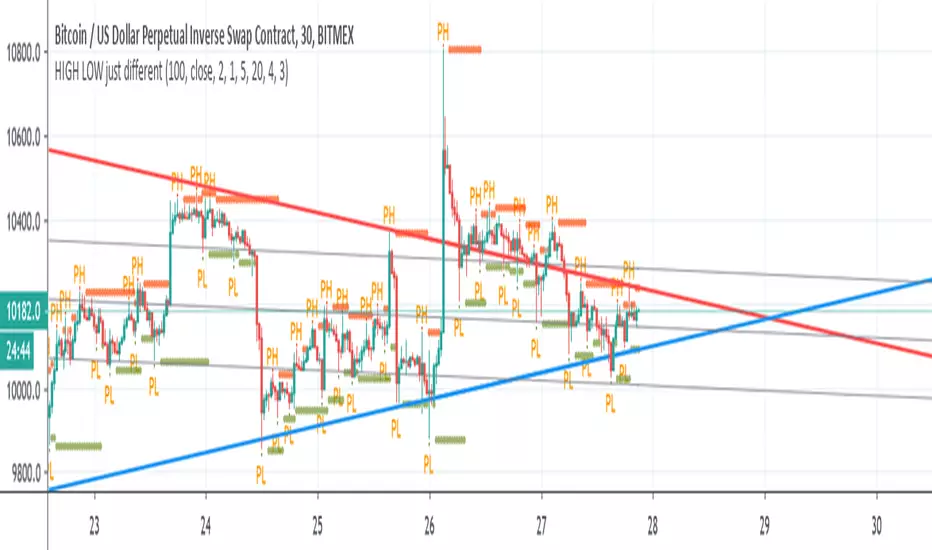
HIGH LOW just differentSo lets make more fun with discovering trends
here I put high pivot and low pivot and from it we make our lines based on them
look cool:)

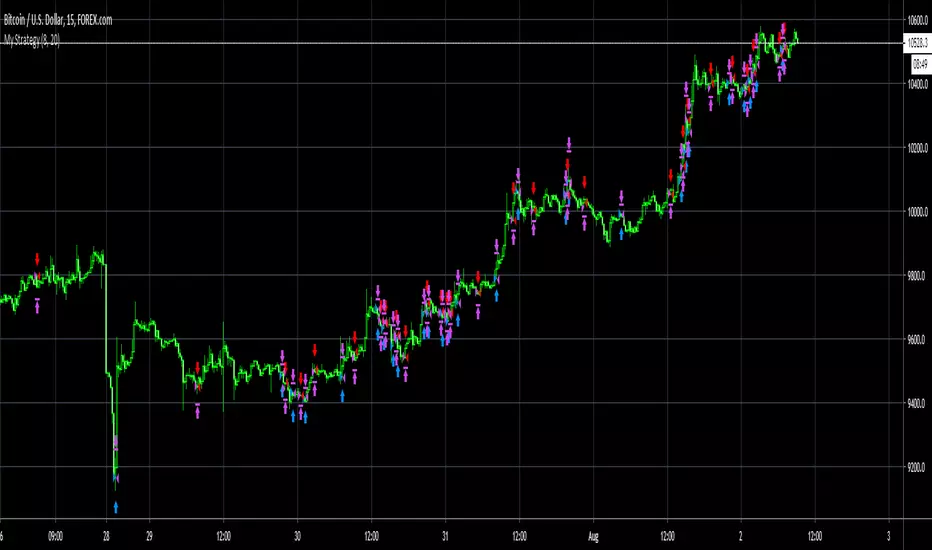
Higher High Lower Low Strategy and impulseHigher High Lower Low Strategy and impulse
it is part of a series of indicators

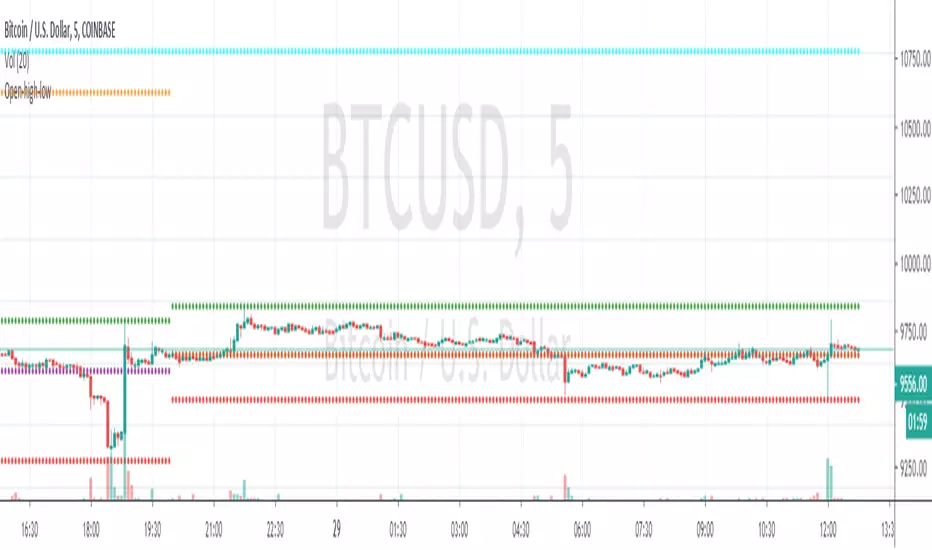
Open-high-lowmodified @traderXO's original daily open/high/low script to include monthly and weekly open.
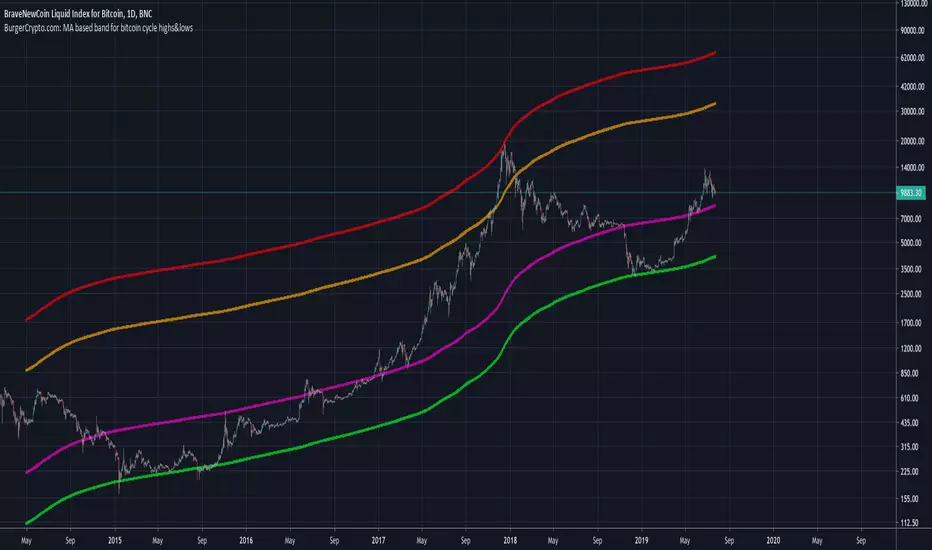
BurgerCrypto.com: MA based band for bitcoin cycle highs&lowsWarning: This script works only on a daily chart and only works for bitcoin charts with a long history. Best to be used on the BLX chart as it goes back to July 2010.
This script shows you the Moving Average with the length of a full bitcoin cycle, in which a cycle is defined as a period between two reward halvings; i.e. 210.000 blocks.
After data analysis in Python, I found that the average inter arrival time is a bit lower than the often communicated 10minutes; it's 9.46minutes, which makes the 210.000 block interval equal to 1379days.
The 1379d Moving Average seems to serve well as a support for the price of bitcoin over time and it's 4th 2^n multiple did a good job in catching the cycle tops.
If you like this indicator, please leave some claps for the Medium article in which I introduced this indicator:
medium.com
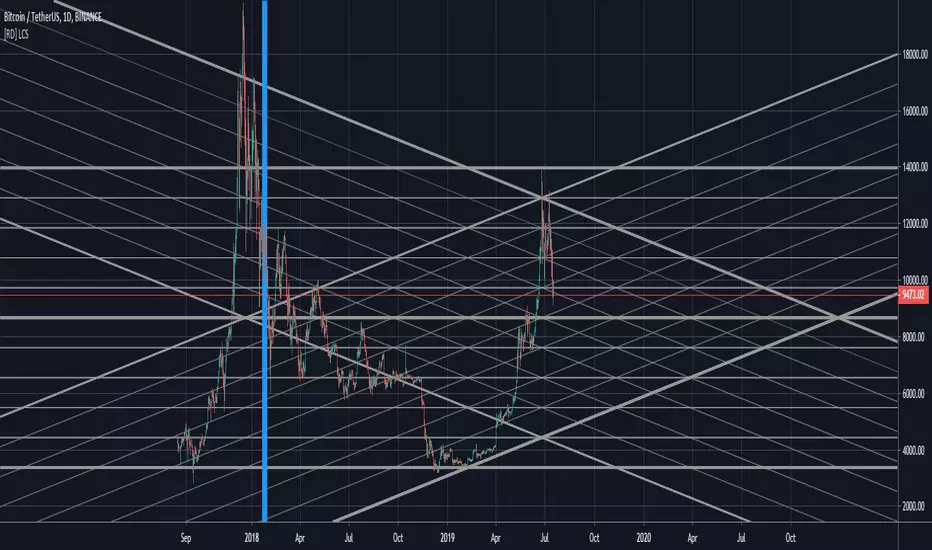
[RD] LCS - line channels (basic) v3 - [republish]==================================================================
July 18 2019 - LCS - line channels (basic) by RootDuk
Version : v3 - read the notes
==================================================================
Easy script to draw channels based on ie. GANN using the following
input params
- ibback : barsback to search for high and low
- ffactor : factor to up/downscale the lines
- oextend : extend lines, left, right, both, none
- bshowline : show horizontal lines yes/no
- bsshowdown : show diag down lines yes/no
- bsshowup : show diag up lines yes/no
- bshowindm : show index marker, where is you current ibback
===================================================================
Notes
===================================================================
When you use this code, pls let me know where and how you used it
as iam always curious what some can do with it. Thanks!
===================================================================
Updates
===================================================================
v1
v2 - July 17 2019
- Removed support wallets from source code. I think the source
- has been deleted because of this, find no other clue.
v3 - July 18 2019
- Republish
Standard Deviation using high, low, closeEvery standard deviation tools just only consider one source to compute std, but this tool also consider close, high, low to publish std

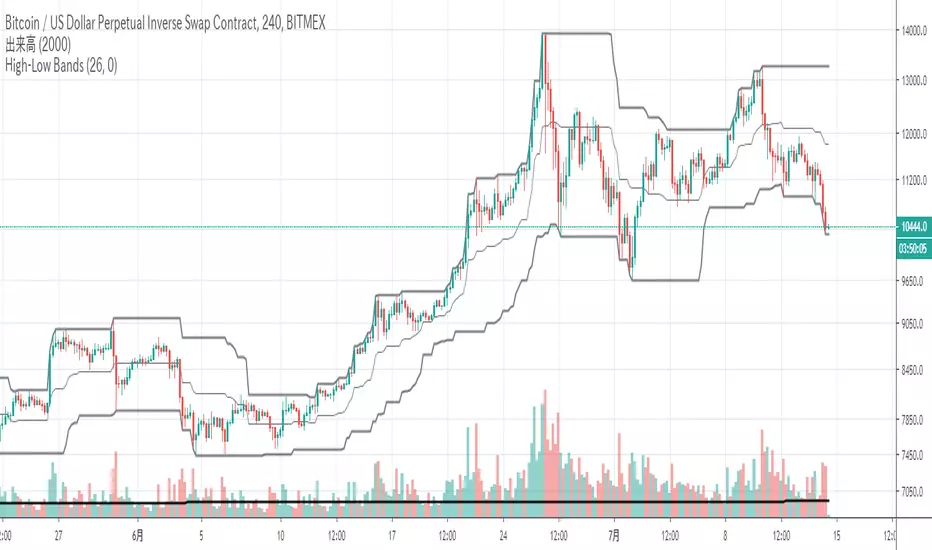
High Low BandsIt is just a high-low band. I published it because I could not find something good.
ただのハイローバンドです。何故か良いのが見つからないので公開しました。
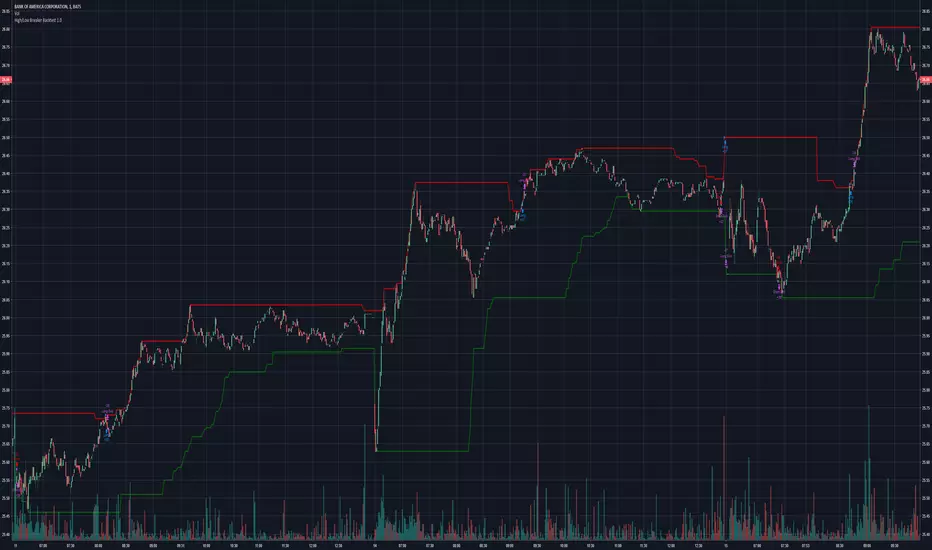
Higher High Lower Low Strategy (With Source Code)This script finds pivot highs and pivot lows then calculates higher highs & lower lows. And also it calculates support/resistance by using HH-HL-LL-LH points.
Generally HH and HL shows up-trend, LL and LH shows down-trend.
If price breaks resistance levels it means the trend is up or if price breaks support level it means the trend is down, so the script changes bar color blue or black. if there is up-trend then bar color is blue, or if down-trend then bar color is black. also as you can see support and resistance levels change dynamically.
If you use smaller numbers for left/right bars then it will be more sensitive.
source code of :

Pivot High Low Pointsby using this script you can find Pivot High-Low Points. This script works like Tradingview pivothigh & pivotlow functions.
If you find my works useful, please consider a donation
BTC: 16XRqyS3Vgh1knAU1tCcruqhUrVm4QWWmR
by LonesomeTheBlue

Highs and Lows (Previous Days Projected + Current Week & Month)Credit to Lachlan Smith created original on 31/03/15 - Edited by Elisa 30/3/19
Historical highs and lows
Includes three previous days projected onto today, plus current week and month.
Settings allow for data to be hidden after weekends for use in traditional markets. (i.e. prior 2 days not useful on a Monday)

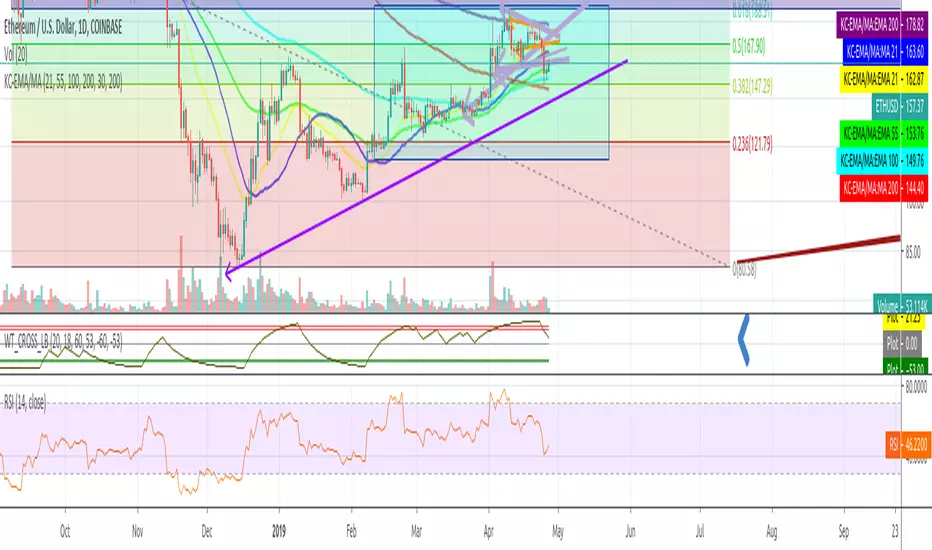
Pivots High/Low [Simpelyfe]These are interconnected pivot highs and lows to help you determine the direction and magnitude of the next impulse. A hard pivot finishing off C or E of a corrective wave means there's a higher probability for price to reverse thereafter.
Cheers,
Simpelyfe

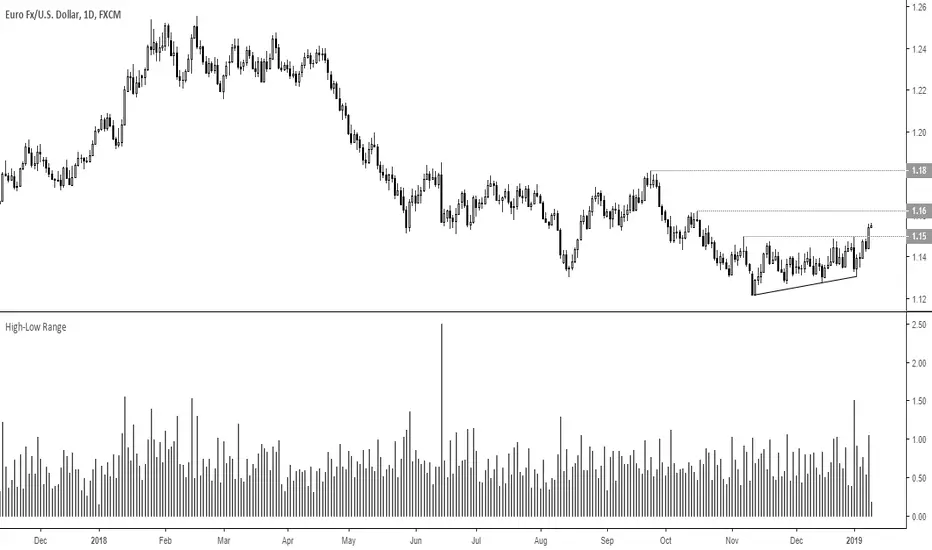
High Low LinesThis script allows you to see a line graph of the highs and lows. Useful for drawing trend lines.

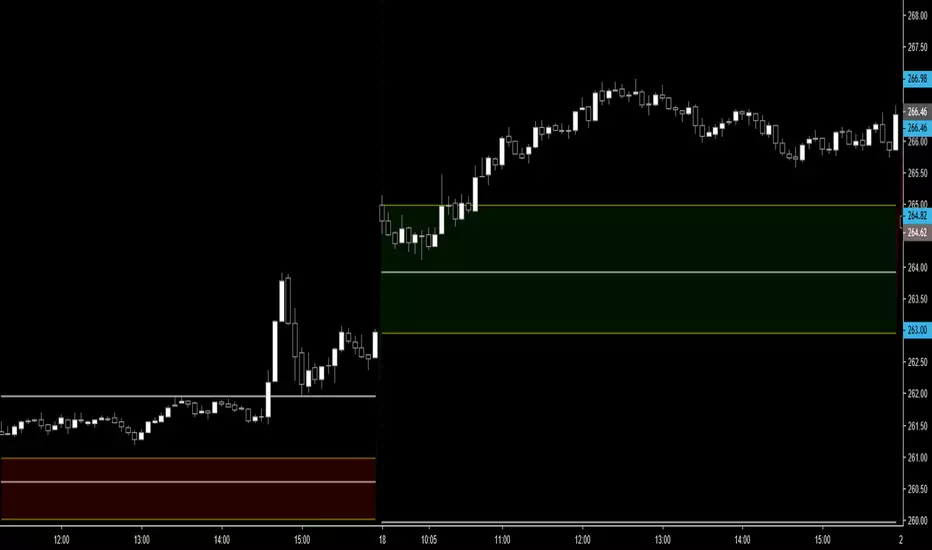
Current Open/Previous High Low Close. Gap HighlightedThis script plots the current open previous high low close. Also the area between the current open and previous close are highlighted to easily see the overnight gap. The idea is that after a significant gap the price will retest previous days levels before continuing in the direction of the gap.
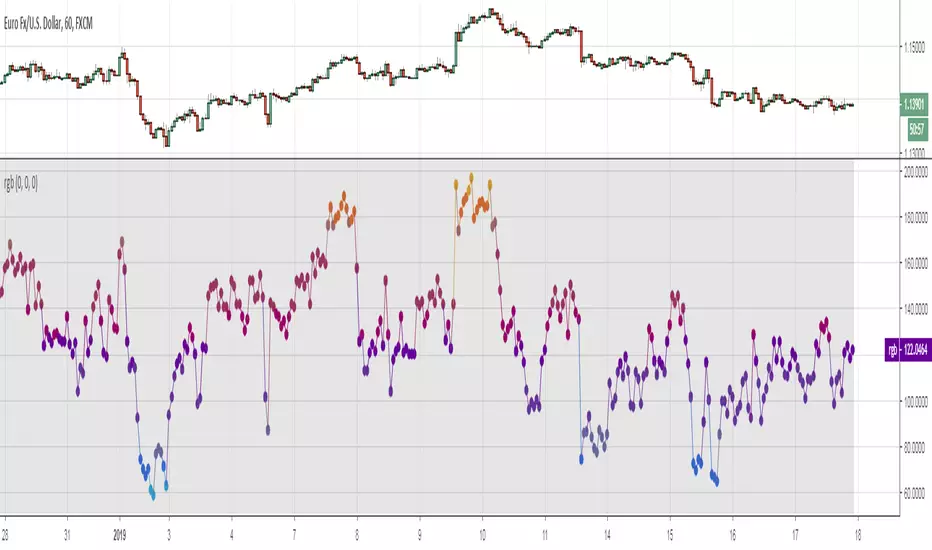
[RS]Function - RGB Color (low resolution)Function to handle rgb color selection, it has low resolution due to pinescript limitations.
included examples with manual background color selection via inputs and automatic color of a rsi plot based on its value.
let your rainbow dreams come true!! :D
New Highs-Lows AMEX-Buschi
English:
This indicator shows the AMEX's up volume (green) and down volume (red).
Extreme trading days with more than 90 % up or down volume are marked via lines (theoretically values) and triangles (breaches).
Deutsch:
Dieser Indikator zeigt das Aufwärts- (grün) und Abwärts-Volumen (rot) der AMEX.
Extreme Handelstage mit mehr als 90 % Aufwärts- oder Abwärts-Volumen ist gekennzeichnet über Linien (theoretische Werte) und Dreiecke (Überschreitungen).
ccid (with high low histogram)So this indicator has the following : CCI where the buy and sell signal can be either cross of the fast the slow and vice versa or cross of CCI bellow -50 and cross down CCI +50
the histogram (blue and red) is made by high low like histogram the buy and sell is based on crossing of the 0 . since its MTF type . you can toon the TF either to the time frame or use lower graph time with higher TF
since both indicator complement each other then I put them together
