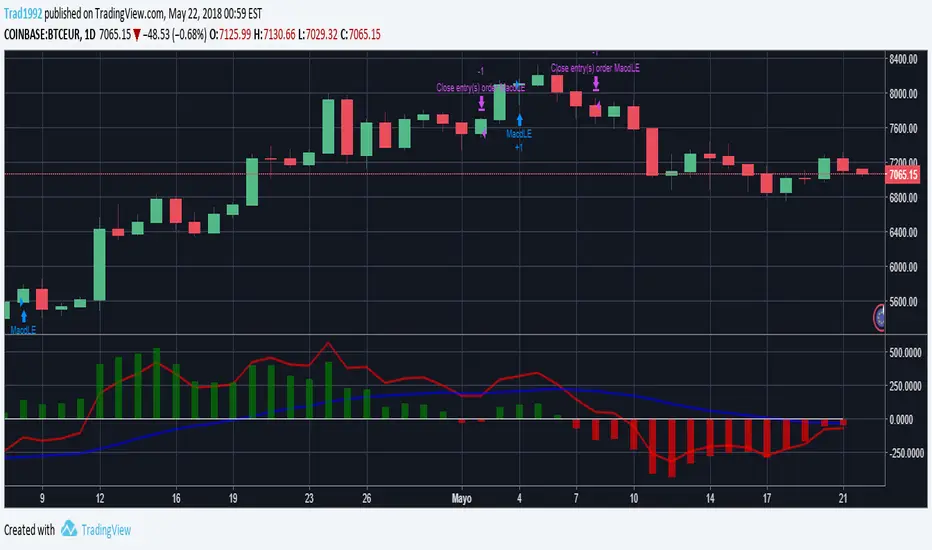
MACD+EMA crossovers Strategy customIt is a Strategy to use EMA crossover and MACD to decide when "buy" and when "sell", the key is spend some time "tuning" the parameters and using the simulation tool to find the best parameters for EMA and MACD there are 6 parameters, but with Excel and patience you could find the best configuration for the past and apply it to the future and see.
Cerca negli script per "macd背离选股"

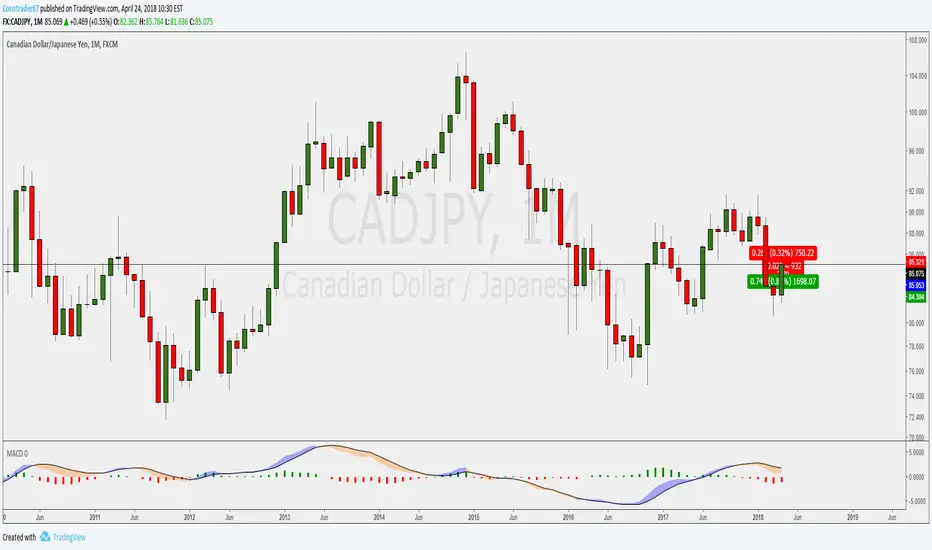
MACD Strategy custom for cryptosIt is a MACD with strategy simulation implemented to "tune" the MACD parameters for cryptos, it only use long and close strategy, not short

Explosive PotentialThis script looks at times where MACD is within a specified range (very close to 0 values) and price action is very constrained (under 2%). Historically price has made a strong move after these conditions.
I typically run this on an 8H timeframe.
Review on BTCUSD and other cryptos.

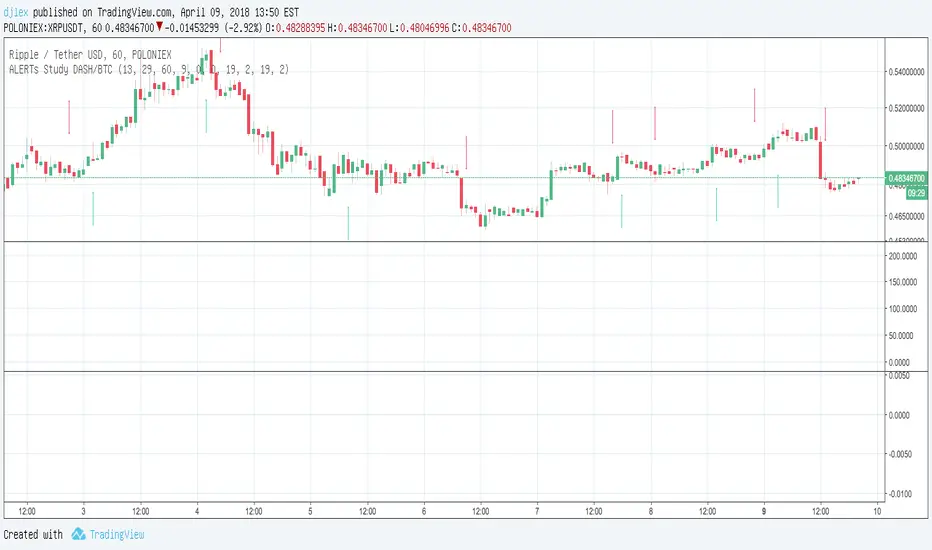
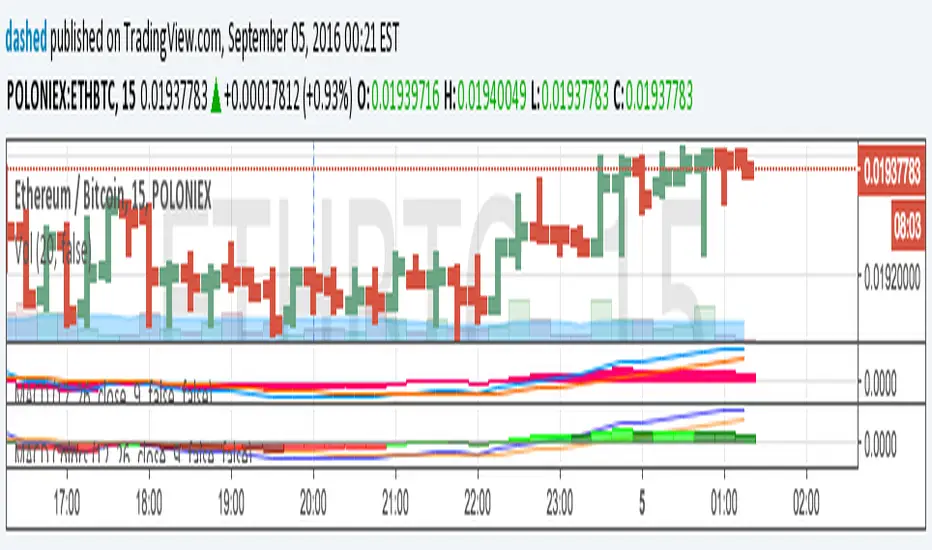
MACD Study DASH/BTC 3H ALERTS for AutoviewAutoview qualified Study Script Alerts for Autoview
Please Set Up Alert 1x Bars Close
For Margin Trading (Poloniex)
ULTIMATE PINE INJECTOR V1.2 INSERT
MACD Created by user ChrisMoody
NO REPAINT
With Stopp Loss and Trailing Stopp and Backtest
Now is for Free for all !

MACD Cross GridShow across all timeframes (15 minute to 1 week) whether MACD has crossed up (blue) or down (orange).


MACD 4H by mattzabWarning: This may repaint. For use with the 1D view only!
4 Hour MACD view with color coded histogram area.

MACD 1D by mattzab1 Day Standard MACD with a filled in Histogram (area) with color coding to show Histogram direction.


MACD ColorsThis adds visual cue for when MACD histogram bars is decreasing when above the zero-line, and increasing when below the zero-line.
Based on:
SMACDGraphs slope of ohlc4 MACD
When it =0, trend change
play with slow&fast lengths as well as the length used to calculate the slope.
-in progress(?)
Vertical lines in the image are as close as I could get them to SMACD=0.

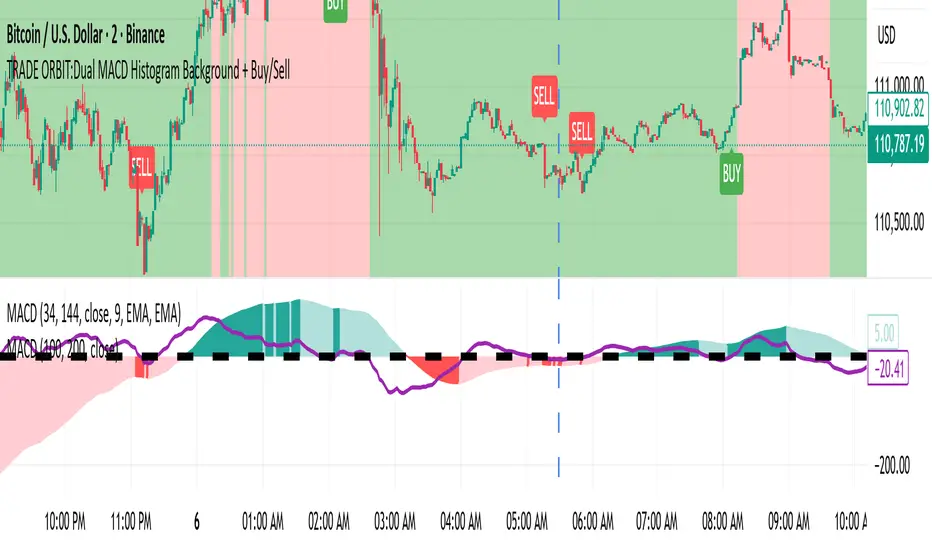
TRADE ORBIT:Dual MACD Histogram Background + Buy/SellDescription:
This indicator combines two MACD systems to provide clear trend, buy/sell signals, and identifies potential discount and premium zones for smarter entries and exits.
Features:
MACD #1 (100, 200, 50) – Trend & Background Coloring
Histogram > 0 → Green background (Bullish trend)
Histogram < 0 → Red background (Bearish trend)
MACD #2 (34, 144, 9) – Buy/Sell Signals
Buy Signal: Histogram crosses above zero and MACD #1 background is green
Sell Signal: Histogram crosses below zero and MACD #1 background is red
Signals are plotted as tiny labels directly on the chart
Discount & Premium Zones
Discount Zone: Price below MACD #1 slow EMA → highlighted in green
Premium Zone: Price above MACD #1 slow EMA → highlighted in red
Helps identify “cheap” (potential buy) and “expensive” (potential sell) areas relative to trend
Reference Plots (Optional)
MACD #1 & #2 histograms plotted as columns for visual confirmation
Usage:
Use MACD #1 background to identify the prevailing trend.
Wait for MACD #2 cross signals aligned with trend for buy/sell confirmation.
Discount and premium zones help time entries and exits more efficiently.
Ideal For:
Swing traders and position traders who want to combine trend-following signals with overbought/oversold zones.
TRADE ORBIT:Dual MACD + HEMA TrendThis indicator combines dual MACD histograms with a Harmonic EMA (HEMA) trend overlay to provide comprehensive trend analysis, buy/sell signals, and dynamic support/resistance zones.
Features:
Dual MACD System:
Background Coloring: Uses MACD(100,200,50) histogram to color the chart background:
Green = bullish momentum
Red = bearish momentum
Buy/Sell Signals: Uses MACD(34,144,9) histogram crossovers for trade signals:
BUY Signal: Histogram crosses above zero and background is green
SELL Signal: Histogram crosses below zero and background is red
Signals are plotted as labels on the chart.
HEMA Trend Overlay:
Uses short and long HEMA lines (default 20 & 40) to detect trend direction.
Colors bars dynamically based on trend:
Green = bullish
Red = bearish
Gray = neutral or indecisive
Provides gradient fill between HEMA lines to visually highlight trend strength.
Trend Boxes & Markers:
Bullish/bearish boxes highlight areas of potential support/resistance based on HEMA crossovers.
Markers (▲ / ▼) appear when the price interacts with trend boxes for easy visual confirmation.
Alerts:
HEMA crossovers (bullish/bearish)
Price tests of bullish/bearish boxes
Optionally, can add alerts for MACD BUY/SELL signals.
Visualization:
MACD histograms plotted as columns for reference
Dynamic bar colors reflecting HEMA trend
Combined view gives a multi-layered trend analysis on a single chart.
Use Case:
Ideal for traders who want to filter trades by overall trend (background MACD), time precise entries/exits (MACD signals), and confirm trend strength (HEMA overlay) in a single indicator.

Presets Selector - FRIDAY NIGHT CHALLENGEBonjour/Salut ça va?
Ok enough for the french :) You guys should really stop challenging me on things on Pinescript and asking me if it's possible or not because... that's the second time in a row I'm about to reveal a nice trick
Please take this example as a proof of concept/feasability. This follower said "I'm tired of manually filling the fields of my indicator, my fingers are dead.... every time I change something in the code, I lose the configuration by default"
Say no more sir.... challenge accep..... wait for it ....ted (that's his real name actually) !!!!
Mesdames et messieurs (damn... my french accent is back), let's unveil the curtain on... the PRESETS SELECTOR (please try to imagine someone super famous shouting it and everyone standing and clapping their hands...)
What I mean by presets is THIS
I inspired myself from this script MacD-Custom-Indicator-Multiple-Time-Frame-All-Available-Options/ (this guy has more likes in a single indicator than me and my friends and my family in all social media channels combined over the past 15 years or so....#humbled)
Anywoo.... the concept is that you can define presets in your script .... which is not possible by TradingView at the moment. If you always have the same set of parameters for a given indicator, please think about your fingers too and give them some rest by implementing a preset in the code directly
I also added a few features :
- You can choose the resolution of the indicator (from 1 minute to 1 month)
- You can choose also between displaying a MACD or a MACD ZERO LAG
Imagine now you have a super complex backtest with hundreds of fields... and unfortunately ... you'll have to fill some of them for each of your tests. Might change in the future if TradingView will add the feature though :)
PS
I'm writing the Algorithm Builder documentation this weekend and the website should open in 3 weeks maximum. I think it's one of the most beautiful trading websites I've seen ever (I didn't do it, my friend did but who cares... it's mine :p)
PS2
I didn't post yesterday the script of the day so I'll post it tomorrow. What is due is due and I won't fail my challenge even ONCE !!!! ("But you just did yesterday bro...")
Have a great weekend
Dave
____________________________________________________________
Be sure to hit the thumbs up
- If you want to suggest some indicators that I can develop and share with the community, please use my personal TRELLO board
- I'm an officially approved PineEditor/LUA/MT4 approved mentor on codementor. You can request a coaching with me if you want and I'll teach you how to build kick-ass indicators and strategies
Jump on a 1 to 1 coaching with me
- You can also hire for a custom dev of your indicator/strategy/bot/chrome extension/python

MACDouble + RSI (rec. 15min-2hr intrv) Uses two sets of MACD plus an RSI to either long or short. All three indicators trigger buy/sell as one (ie it's not 'IF MACD1 OR MACD2 OR RSI > 1 = buy", its more like "IF 1 AND 2 AND RSI=buy", all 3 match required for trigger)
The MACD inputs should be tweaked depending on timeframe and what you are trading. If you are doing 1, 3, 5 min or real frequent trading then 21/44/20 and 32/66/29 or other high value MACDs should be considered. If you are doing longer intervals like 2, 3, 4hr then consider 9/19/9 and 21/44/20 for MACDs (experiment! I picked these example #s randomly).
Ideal usage for the MACD sets is to have MACD2 inputs at around 1.5x, 2x, or 3x MACD1's inputs.
Other settings to consider: try having fastlength1=macdlength1 and then (fastlength2 = macdlength2 - 2). Like 10/26/10 and 23/48/20. This seems to increase net profit since it is more likely to trigger before major price moves, but may decrease profitable trade %. Conversely, consider FL1=MCDL1 and FL2 = MCDL2 + (FL2 * 0.5). Example: 10/26/10 and 22/48/30 this can increase profitable trade %, though may cost some net profit.
Feel free to message me with suggestions or questions.

K's Reversal Indicator IK's reversal indicator I is a special combination between Bollinger bands and the MACD oscillator. It is a contrarian indicator that depends on the following conditions:
• A buy signal is generated whenever the current market price is below the 100-period lower Bollinger band while simultaneously, the MACD value must be above its signal line. At the same time, the previous MACD value must be below its previous signal line.
• A sell (short) signal is generated whenever the current market price is above the 100-period upper Bollinger band while simultaneously, the MACD value must be below its signal line. At the same time, the previous MACD value must be above its previous signal line.
The way to use K's reversal indicator is to combine it with your already long/short bias in a sideways/range market in order to maximize the probability of success.
Limitations of the indicator include the following:
• There are no clear exit rules that work well on average across the markets. Even though K’s reversal indicator gives contrarian signals, it does not show when to exit the positions.
• As with other indicators, it underperforms on some markets and is not to be used everywhere.
• False signals tend to occur during trending markets but there is no proven way to detect a false signal.

McClellan Oscillator [CC]The McClellan Oscillator was created by Sherman and Marian McClellan and it is essentially a MACD of the advancing and declining symbols of the day and is best used as a comparison with the biggest stocks such as my example Apple but that is just my opinion. I pulled the symbol names from a Trading View blog so I'm not 100% sure if they are accurate so please let me know if I'm wrong. Buy when the indicator is over 0 and sell when it falls below 0 but keep in mind that these values are for the market itself and not the individual symbol.
This was a special request so let me know if you would like me to publish more scripts or if you want something custom done!
Note: I'm republishing this because the original script couldn't be found in searches so this will fix that.
