MACD - Combined Histogram & Histogram Line with Zero ScaleScript to combine MACD 'Histogram' & 'Histogram Line' and adds a 'Zero Scale'
Cerca negli script per "macd"

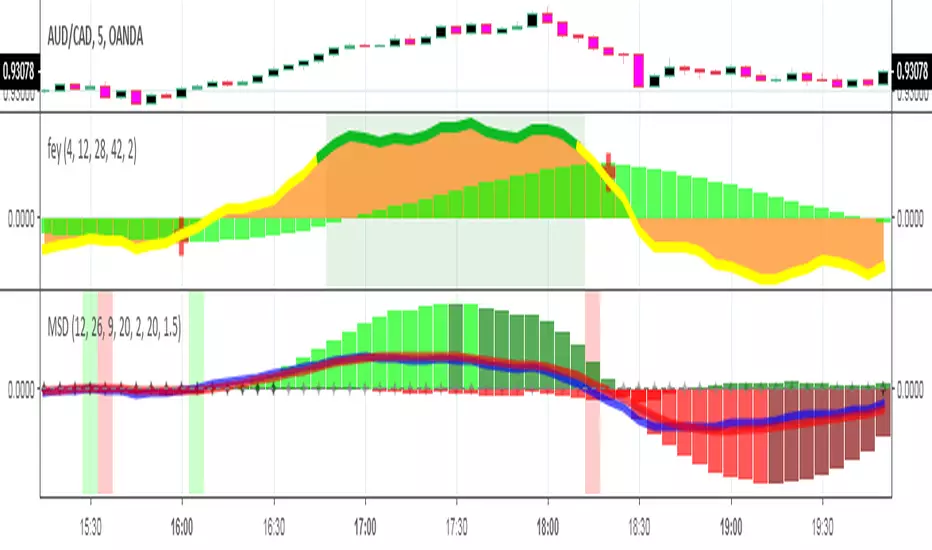
MACD+squeeze+DEMAThis indicator MACD DEMA and Squeeze Momentum from LazyBear and Toff. I combined them and added alert.
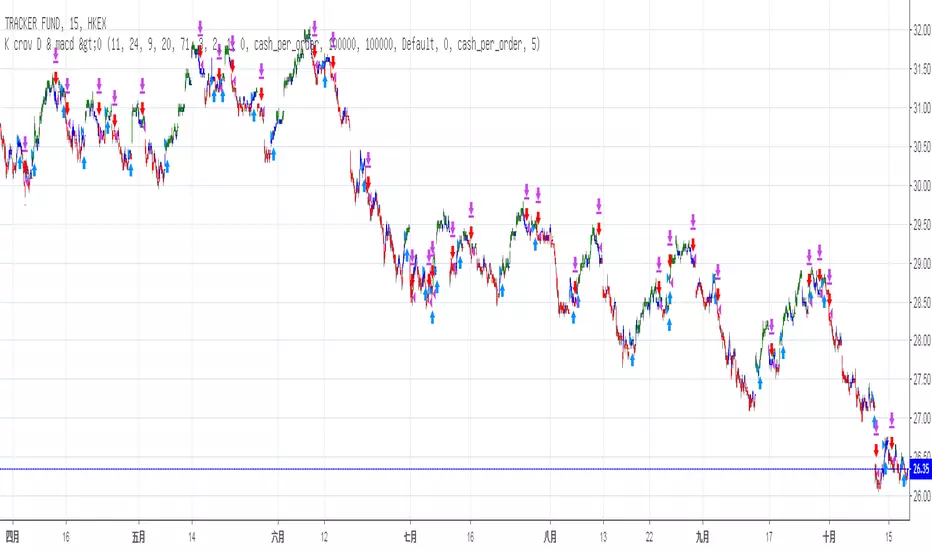
Stochastic & MACD Strategy Ver 1.0This strategy is inspired by ChartArt and jasonluk28.
The following input changes from the initial ChartArt version to achieve higher stability and profit:
Fast MA Len:11
Slow MA len: 24
Stoch Len: 20
No difference is found in minor changes (+-10) lv. of overbought/oversold
It works above 40% winning rate in Heng Heng Index, Shanghai Composite, Dow Jones Industrial Averge, S&P 500 NASDAQ, VT (World Total Market) and in 15 mins chart
Profit: above ~10 to 30% in less than 1year backtest for most major indice of China and US and ~62% in Heng Seng Index (Hong Kong) & 40.5% in SZSE Composite (Shen Zhen)
P.S. Profit: 700 (Tencent) +150.5%, 939 (CCB) +66.5%, 1299 (AIA) +45%, 2628 (CLIC) +41%, 1 (CK Hutchison) +31%
NFLX +82.5%, BABA +55.5%, AMZN +44%, GOOG +38%, MCD +24.5%
However, Loss in FB -19% , AMD -38.5%
Not suitable for stocks with great influences in News or Events ???


MACD of Linear Regression Slope Indicator I used MACD to find peak and trough points in the Linear Regression Slope


The best MACDMACD adjusted with a long-term black signal line and histogram for more consistency in trend indications.
Difusor de Fluxo [André Moraes] - Flow DiffuserPORTUGUÊS
Difusor de Fluxo de André Moraes. É um MACD com mais uma média de longo prazo. Explicação do próprio André Moraes em www.youtube.com
ENGLISH
Flow Diffuser created by André Moraes. It's a MACD with an extra long length average. The author's explanation can be viewed at www.youtube.com

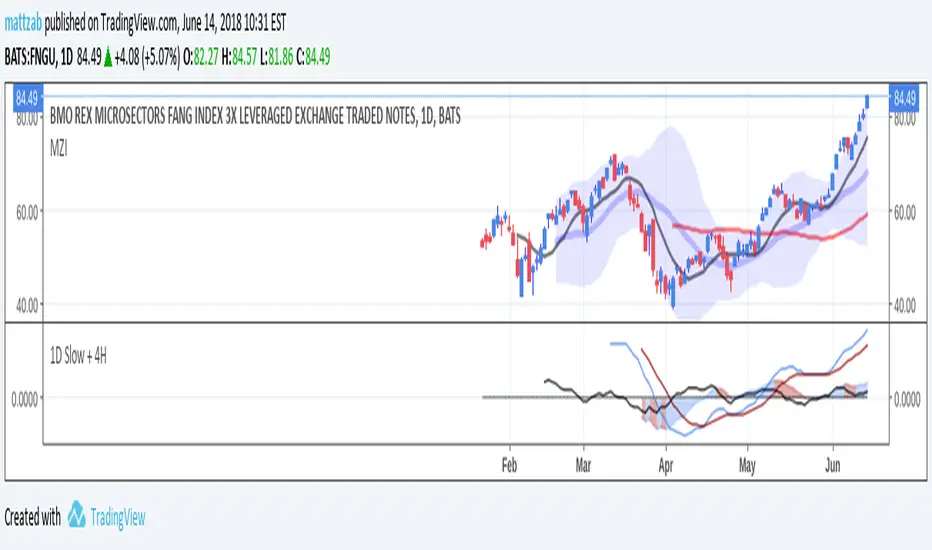
MACD 1D Slow + 4H by mattzab1D MACD, with slightly slower values for a little less noise.
Instead of the 12, 26, 9, this shows the 13, 34, 9.
Instead of showing a histogram, it uses area and color-codes the area blue and red based on directional movement.
Overlaid is a black histogram line showing the 4H MACD, produced by values of 6, 13, 5.
MACD+EMA crossovers Strategy customIt is a Strategy to use EMA crossover and MACD to decide when "buy" and when "sell", the key is spend some time "tuning" the parameters and using the simulation tool to find the best parameters for EMA and MACD there are 6 parameters, but with Excel and patience you could find the best configuration for the past and apply it to the future and see.

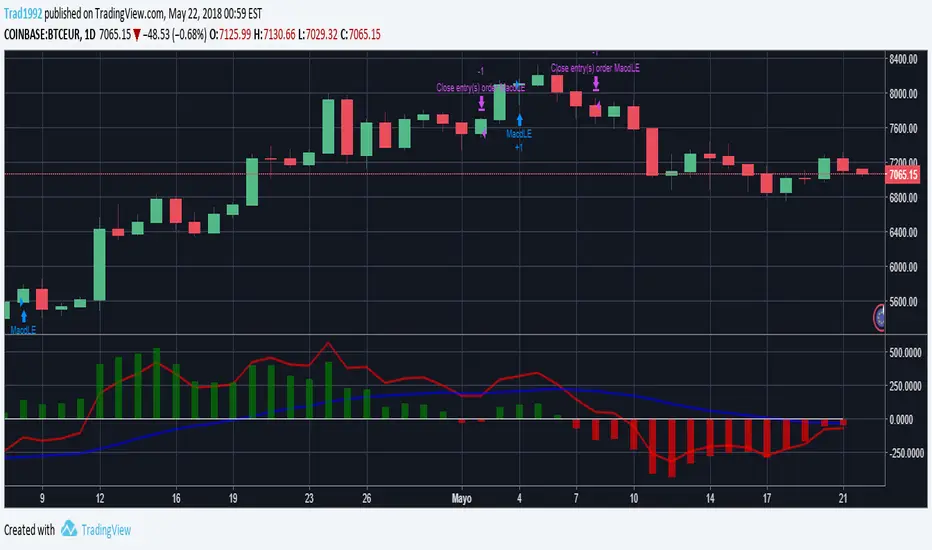
MACD Strategy custom for cryptosIt is a MACD with strategy simulation implemented to "tune" the MACD parameters for cryptos, it only use long and close strategy, not short

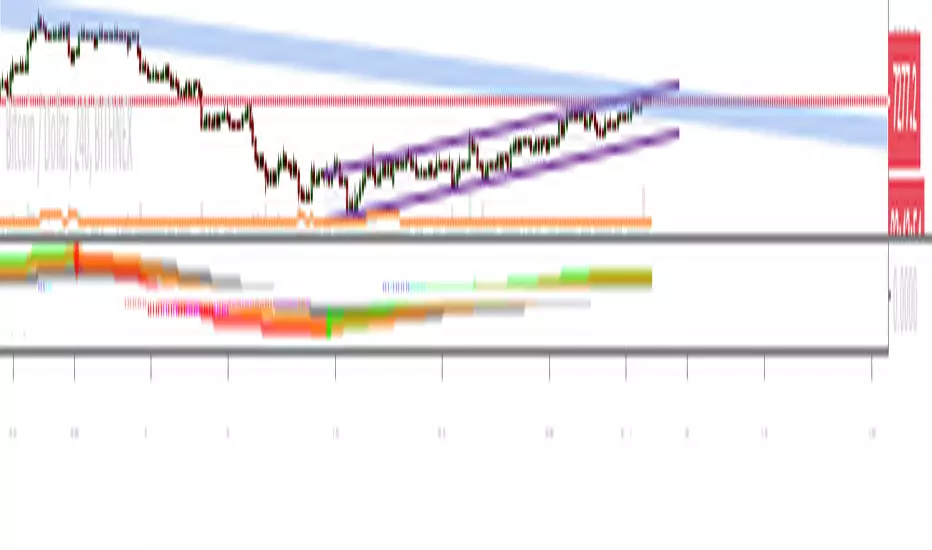
Explosive PotentialThis script looks at times where MACD is within a specified range (very close to 0 values) and price action is very constrained (under 2%). Historically price has made a strong move after these conditions.
I typically run this on an 8H timeframe.
Review on BTCUSD and other cryptos.

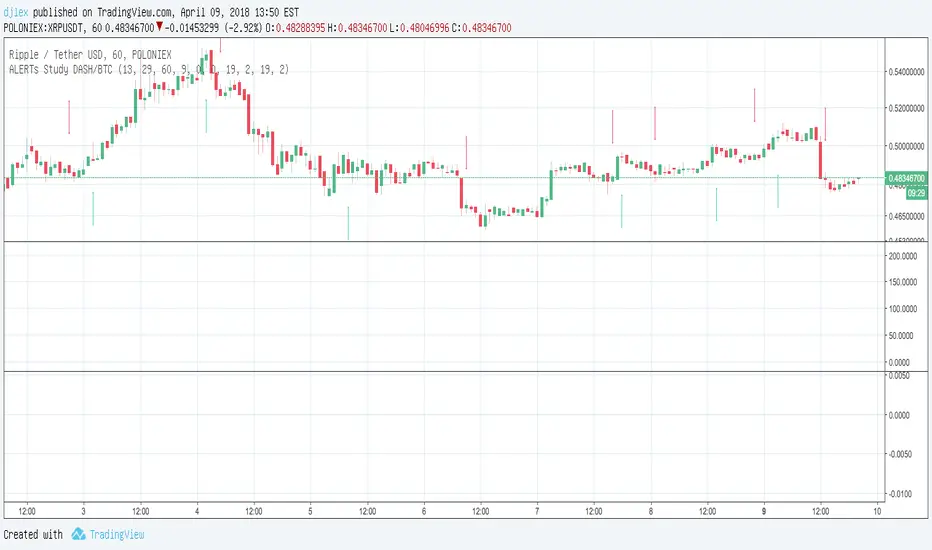
MACD Study DASH/BTC 3H ALERTS for AutoviewAutoview qualified Study Script Alerts for Autoview
Please Set Up Alert 1x Bars Close
For Margin Trading (Poloniex)
ULTIMATE PINE INJECTOR V1.2 INSERT
MACD Created by user ChrisMoody
NO REPAINT
With Stopp Loss and Trailing Stopp and Backtest
Now is for Free for all !

MACD Cross GridShow across all timeframes (15 minute to 1 week) whether MACD has crossed up (blue) or down (orange).

