CSI Cycle Swing MomentumAdaptive Ultra-Smooth Momentum (Cycle-Swing Indicator – CSI)
The Cycle-Swing Indicator (CSI) is an advanced, adaptive momentum oscillator designed to extract clean, reliable signals from market data by focusing on the swing of the dominant market cycle rather than raw momentum. By identifying and aligning with the current dominant cycle, the CSI produces a momentum curve that is exceptionally smooth, responsive, and context-aware.
Key Advantages
The CSI offers several improvements over traditional momentum-based indicators:
Ultra-smooth signal line without sacrificing responsiveness
Zero-lag behavior, enabling timely entries and exits
Pronounced turning-point precision, enhancing signal clarity
Adaptive to real market cycles, automatically adjusting to changing conditions
Reliable deviation and divergence detection, even in noisy environments
Why Standard Indicators Fall Short
Conventional oscillators often struggle in real-world market conditions:
Excessive noise leads to frequent false signals.
Added smoothing reduces noise but introduces significant lag, delaying actionable insights.
Fixed-length parameters make indicators highly sensitive to user settings—you never truly know the "right" length.
The CSI solves all these challenges through its adaptive cyclic algorithm, which automatically aligns itself with the market’s dominant cycle—no manual tuning required.
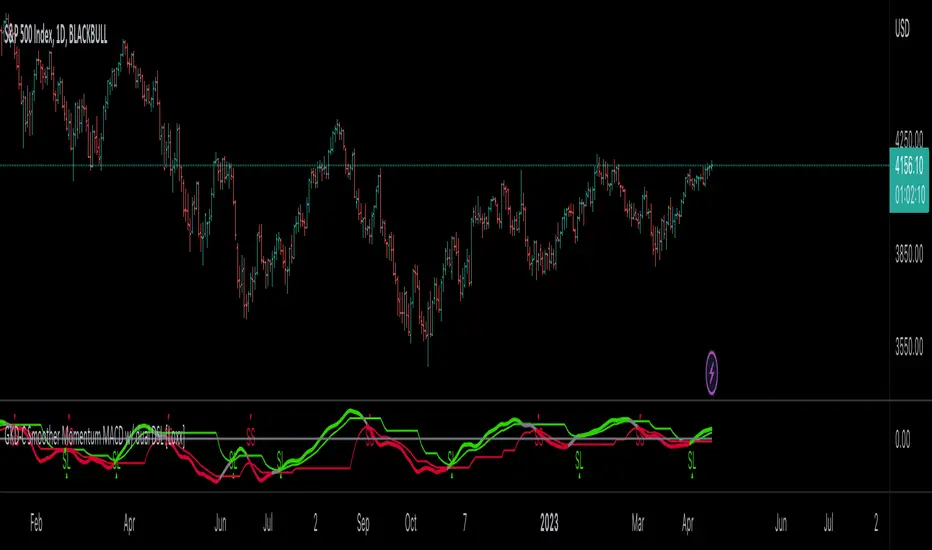
Practical Example
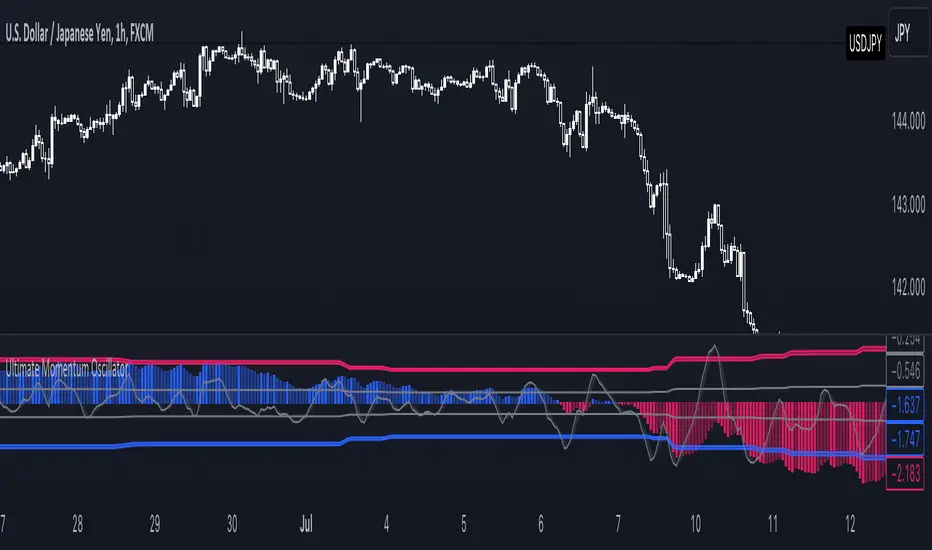
In the example chart, the CSI highlights clear turning points and deviations with far less noise than the standard momentum indicator, demonstrating its superior clarity and responsiveness.
How to Use
The CSI is fully adaptive and requires no parameters. Simply apply it to any symbol and timeframe—the indicator automatically detects the dominant cycle and produces an ultra-smooth, cycle-aligned momentum curve.
Included features:
Adaptive upper and lower bands identifying extreme conditions
Automatic divergence detection (toggle on/off)
Works on any timeframe and any asset
Adaptive length - no input parameter required
How to Read the Indicator
The CSI functions similarly to a traditional momentum oscillator but with enhanced adaptive context:
Look for divergences between price and the CSI signal line — powerful early warnings of weakening trends or impending shifts.
Note on Divergence Signals:
The divergence markers displayed on the chart are generated using embedded pivot-based detection. Because pivots must be confirmed by price action, divergence signals can only be plotted after a pivot forms. For real-time monitoring on the latest bar, users should watch for early-forming divergences as they develop, since confirmed pivot-based divergences will always appear with a slight delay. Script parameters are available for precise adjustment of pivot detection behaviour.
Info: Legacy vs. Pro Version
This is the actively maintained and continuously enhanced edition of my free, open-source indicator “Cycle Swing Momentum”. The Pro Version will remain fully up to date with the latest Pine Script standards and will receive ongoing refinements and feature improvements, all while preserving the core logic and intent of the original tool. The legacy version will continue to be available for code review and educational purposes, but it will no longer receive updates. The legacy open-source version is always available in the public TV indicator repository.
Script a pagamento