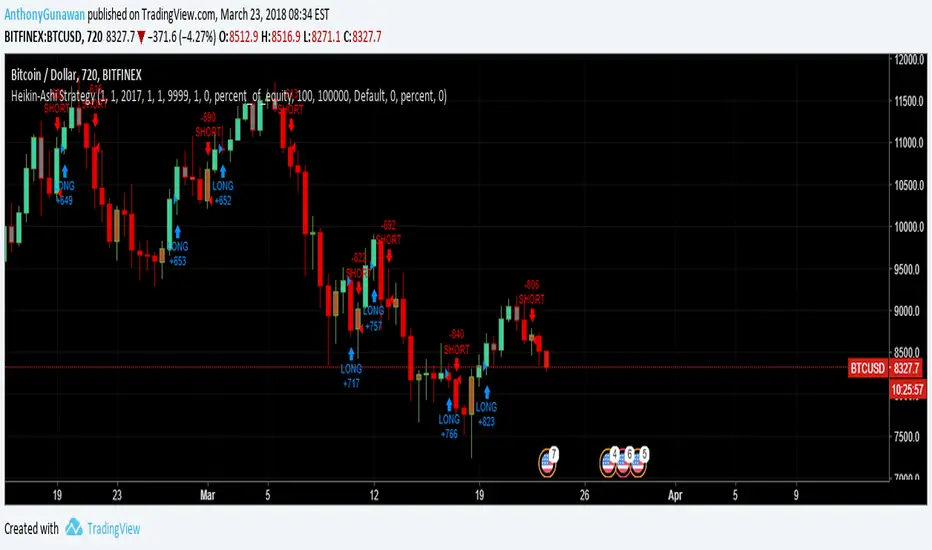
Heikin-Ashi Strategy + backtest rangeThis is Heikin-Ashi Strategy + Backtest range that I think useful for BTCUSD pair.
Cerca negli script per "momentum"
Madhan_HMT_Ultimate_StrategyThis indicator is a trend-following strategy designed to identify buy and sell signals based on price action relative to dynamic channels and smoothing mechanisms. It uses two separate sets of parameters that adjust to market conditions, with each set of parameters acting as an independent trend filter. The indicator creates arrows on the chart to signal potential trade entries, with these arrows appearing when the price crosses certain thresholds established by the indicator's internal calculation.
The strategy can be customized with various parameters, including:
Stop loss and take profit levels based on multiple options: ATR (Average True Range), fixed points, or percentage-based values.
Trading mode options that allow the user to choose whether the strategy trades both long and short positions, or restricts trades to only one direction (long or short).
The indicator visually represents the entry levels, stop loss, and take profit levels, with backgrounds filling to highlight potential risk and reward areas. By adjusting the parameters, traders can tailor the indicator to suit different market conditions and their risk tolerance.

SHEAVY S StrategyThe new version is completely revamped where you no longer need to follow a said system the system is now scripted into SHEAVY XV
the strategy using all the previous variables in order to go long or short .
i removed the RSI Candles as well as a few other things to clear up the screen and settings section so its not overwhelming
Make sure you adjust your trailing stop accordingly using my Hidden ATR script i will have open access too, just follow the math displayed in the left hand corner to get appropriate stop placement
If you cannot link your broker then this is how you will use SHEAVY XV
after you get a BEAR TREND or BULL TREND signal you only want to SHORT or LONG
the signals are displayed at the top for your entries going SHORT and LONG
and the conditional closes will be displayed at the bottom in the respected colors
alerts are set so you are able to appropriate send to your mobile device or email
to find out how to attain access to this script please visit the website below
www.cryptocurrentlyvip.com
MAKE SURE TO PRACTICE APPROPRIATE RISK AND MONEY MANAGEMENT
DISCLAIMER
***THIS SCRIPT WAS INTENDED FOR EXPERIMENTAL PURPOSES ONLY***
AND THE CREATOR OF THIS STRATEGY HELD WITHIN THE SCRIPT WILL NOT BE RESPONSIBLE FOR ANY LOSSES OR WINS ACCRUED.

Trio Strategy w EMA Timing Gate, Early Flip, Clouds and Cross AlMomentum Trio Strategy w EMA Timing Gate, Early Flip, Clouds and Cross Alerts
Short title: Trio EMA Strategy
Concept and Originality
This strategy merges three momentum systems – StochRSI, RSI EMA, and MACD – into one coordinated Trio.
It triggers possible entries only (no exits) when all three align within user-defined windows, with an EMA timing gate for precision and an optional early flip feature if the EMA crosses first.
Optional cooldown and filters reduce false signals.
It also shows green and purple markers when all three momentum indicators cross together, and provides alert notifications on every individual and trio crossover event.
StochRSI-based clouds highlight overbought and oversold areas for quick visual context.
Each part has a defined role:
Trio alignment ensures multi-indicator confirmation.
EMA gate refines timing and enables early trend flips.
Cooldown reduces overtrading.
Filters check price, trend, and volume quality.
Clouds visualize momentum extremes.
Markers show where the Trio crosses.
Alerts notify on all key momentum events.
How It Works
Trio confirmation (core):
StochRSI – percent K and D cross within stochGroupWindow.
RSI – RSI crossing its EMA.
MACD – line crossing signal within macdGroupWindow.
When all three cross up, a green marker appears.
When all three cross down, a purple marker appears.
These mark potential entry points only. Exits are not included.
EMA timing gate:
EMA(5) and EMA(9) define short-term trend.
Longs: EMA(5) greater than EMA(9).
Shorts: EMA(5) less than EMA(9).
Early Flip: when EMA crosses before the trio, a one-time flip can trigger after the chosen cooldown.
Cooldown prevents multiple entries in choppy markets.
Filters include:
Price Filter – restricts entries relative to EMA.
Trend Filter – aligns trades with a longer EMA.
Volume Filter – checks for rising volume.
Overbought and Oversold Clouds:
Red cloud when StochRSI is greater or equal to 80 (overbought).
Green cloud when StochRSI is less or equal to 20 (oversold).
Clouds are for context only, not trade signals.
Alerts trigger on every Trio signal and each individual crossover for StochRSI, RSI, and MACD.
Inputs You Can Tune
RSI, StochRSI, and MACD periods and windows.
EMA gate lengths.
Early-flip toggle and cooldown.
Trio cooldowns.
Filters for price, trend, and volume.
Marker visibility (green and purple).
Overbought or oversold cloud display.
Alert toggles for all cross types.
How To Use
1. Apply to any liquid market such as stocks, crypto, or forex.
2. Choose timeframe.
3. Keep default settings first, then fine-tune windows or cooldowns.
4. Use clouds and markers for entry guidance only. Exits are manual or from another strategy.
5. Enable alerts for real-time notifications of indicator and Trio crosses.
Default Properties Used for Publication (Backtest Transparency)
Initial capital: 100,000 USD – necessary for stock testing so one percent sizing produces realistic order size.
Order size: one percent of equity per trade to keep risk small.
Commission: 0.10 percent per side, realistic for brokers and exchanges.
Slippage: 0.05 percent, equal to roughly one to two ticks on stocks.
Pyramiding: 0.
Execution: on close.
Sample dataset: at least 100 trades across multiple timeframes and markets.
The higher initial capital ensures valid fills for stock testing, while risk stays proportional since position size is percentage based.
Why These Components Work Together
Trio confluence confirms momentum alignment.
EMA gate refines entry timing and allows early reversals.
Cooldown and filters reduce false triggers.
Markers confirm when all three indicators cross together.
Clouds and alerts improve awareness and reaction speed.
The result is a robust entry-only framework that adapts to many markets.
Notes and Limitations
Focused on entry detection only. Exits are manual or external.
For educational use only, not financial advice.
Always test with realistic slippage, fees, and several symbols.
Past results do not guarantee future performance.
Attribution
All logic and structure are original to this publication.
Common Pine functions follow official Pine documentation.

ASHISH_Momentum Finder"Momentum finder" finds pre momentum signal as per multi time frame analysis..
when indicator makes top it shows trending move is about to come.. it can also verified by breaking of recent range.
1. when indicator goes top to bottom it is trending period.
2. when indicator goes bottom to top it is range bound period..
NOTE:
THIS INDICATOR TO BE USED ON OR BELOW 45 MINUTES TIME FRAME ONLY..
DISCLAIMER:
THIS IS FOR EDUCATIONAL PURPOSE ONLY..
TAKE TRADE AS PER YOUR AUTHORIZED ADVISOR..

Momentum FlowThis is a rule-based, fully automated trading strategy** developed **exclusively for BANKNIFTY** and optimized strictly for the **2-Hour (2H) timeframe**. The system is designed to identify **high-quality directional opportunities** while filtering out low-probability market noise.
The strategy is built for traders who prefer:
* Clean positional trading
* Limited, high-quality signals
* Fully mechanical execution
* No discretionary decision-making
This system is **locked by design** and will **only operate on BANKNIFTY – 2H timeframe** to preserve performance integrity. Usage on any other symbol or timeframe is intentionally restricted.
---
### ✅ SUITABLE FOR:
* Positional traders
* Swing traders
* Working professionals
* Traders seeking structured, disciplined systems
---
### ❌ NOT SUITABLE FOR:
* Scalping
* Low-timeframe trading
* High-frequency setups
* Traders seeking daily signals
---
### ⚠️ IMPORTANT DISCLAIMER:
This strategy is provided strictly for **educational and research purposes only**. Trading in financial markets involves significant risk, and losses are possible. Past performance does not guarantee future results. The creator is not responsible for any financial losses incurred by the use of this strategy. Always trade with proper risk management.
---

tradingview_momentum_Hull-Suite-W-FVSO-NO-WeekendMomentum no weekend trades. It uses FVZO and Hull suite.
This strategy has low win rate but successfully catches trends. Works well on ETH in High Time Frame multi-year.
Natural Gas Intraday Strategy [15m] with Partial Profit & TrailBuy when:
1. Close > EMA 100 and EMA 20 > EMA 100
2. MACD (8,21,5) > Signal and histogram rising
3. RSI > 60
4. ATR > threshold (avoid flat market)
Sell when:
1. Close < EMA 100 and EMA 20 < EMA 100
2. MACD (8,21,5) < Signal and histogram falling
3. RSI < 40
4. ATR > threshold
Exit:
• SL = recent swing ± 0.5 ATR
• TP1 = 1 ATR, trail rest with EMA 20

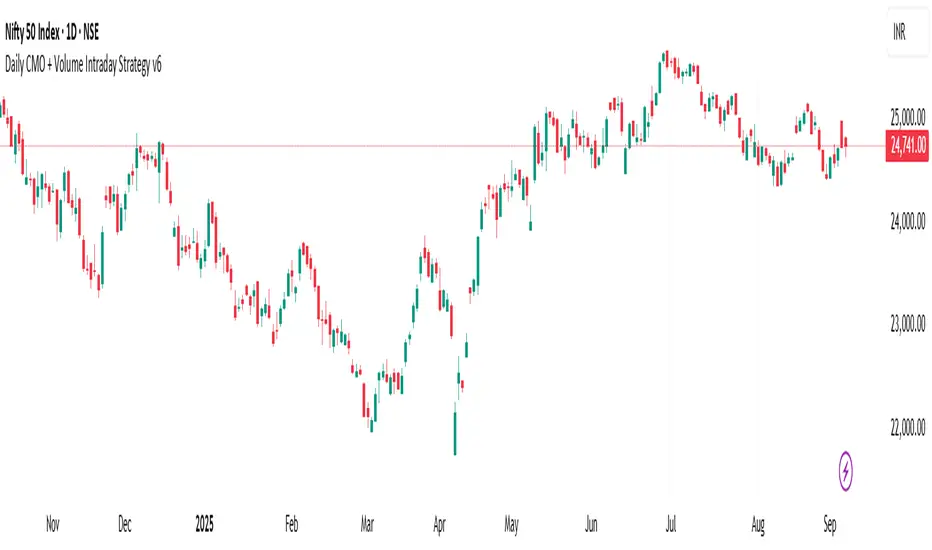
Daily CMO + Volume Intraday Strategy v6 by Subirrmomentum strategy. buy on next hourly candle after signal. target 5%, sl 1%
DMI StrategyThis strategy is based on DMI indicator. It helps me to identify base or top of the script. I mostly use this script to trade in Nifty bank options, even when the signal comes in nifty . It can be used to trade in other scripts as well. Pivot points can also be used to take entry. Long entry is taken when DI+(11) goes below 10 and DI-(11) goes above 40 , whereas short entry is taken when DI-(11) goes below 10 and DI+(11) goes above 40.
For bank nifty , I take the trade in the strike price for which the current premium is nearby 300, with the SL of 20%. If premium goes below 10% I buy one more lot to average, but exit if the premium goes below 20% of the first entry. If the trade moves in the correct direction, we need to start trailing our stoploss or exit at the pre-defined target.
As this a strategy, there is one problem. While we are in the phase of "long", if again the "long" phase comes, it will not be shown on chart until a "short" phase has come, and vice versa. This has been resolved by creating an indicator instead of strategy with the name of "DMI Buy-sell on chart". Please go through that to get more entry points.
Please have a look at strategy tester to back test

DMI StrategyThis strategy is based on DMI indicator. It helps me to identify base or top of the script. I mostly use this script to trade in Nifty bank options, even when the signal comes in nifty. It can be used to trade in other scripts as well. Pivot points can also be used to take entry. Long entry is taken when DI+(11) goes below 10 and DI-(11) goes above 40, whereas short entry is taken when DI-(11) goes below 10 and DI+(11) goes above 40.
For bank nifty, I take the trade in the strike price for which the current premium is nearby 300, with the SL of 20%. If premium goes below 10% I buy one more lot to average, but exit if the premium goes below 20% of the first entry. If the trade moves in the correct direction, we need to start trailing our stoploss or exit at the pre-defined target.
Please have a look at strategy tester to back test.

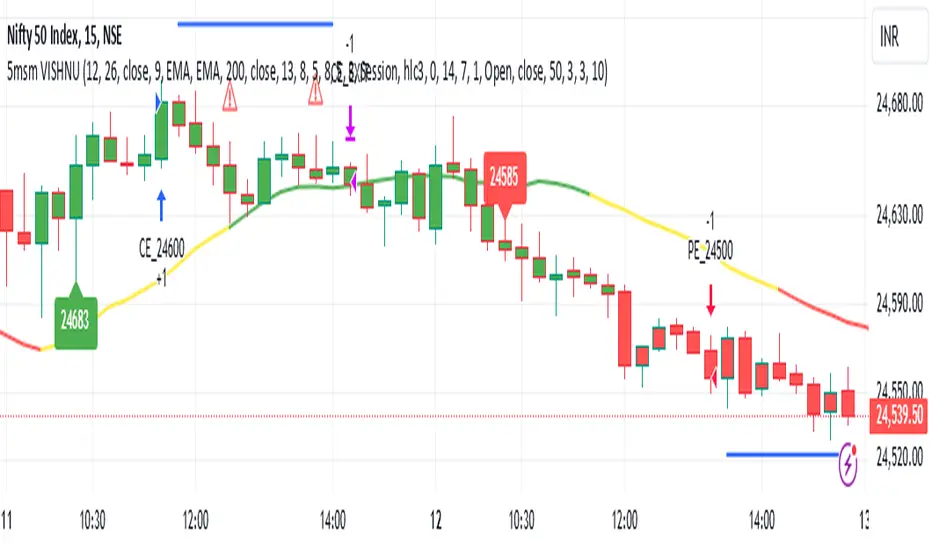
5MSM VISHNU5MSM VISHNU Indicator for Trending Markets originally written by patrick1994.
It was originally based on the MACD 12-26 and the 50 bar EMA .
The macd hist is color coded with green as buy and sell as red.
I added an option to use a couple of lower lag ema's (See line 13 - ema_signal).
5MSM VISHNU with MACD Indicator for Trending Markets
Originally written by Trading Rush
Note that the user may choose lower lags to compute the MACD signals
added lower lag ema functions - see lines 21 to 30
added plot for the MACD signal 'hist' - computed in lines 36 to 41
The extra MACD line was added for clarity for the placement of the buy sell signals.
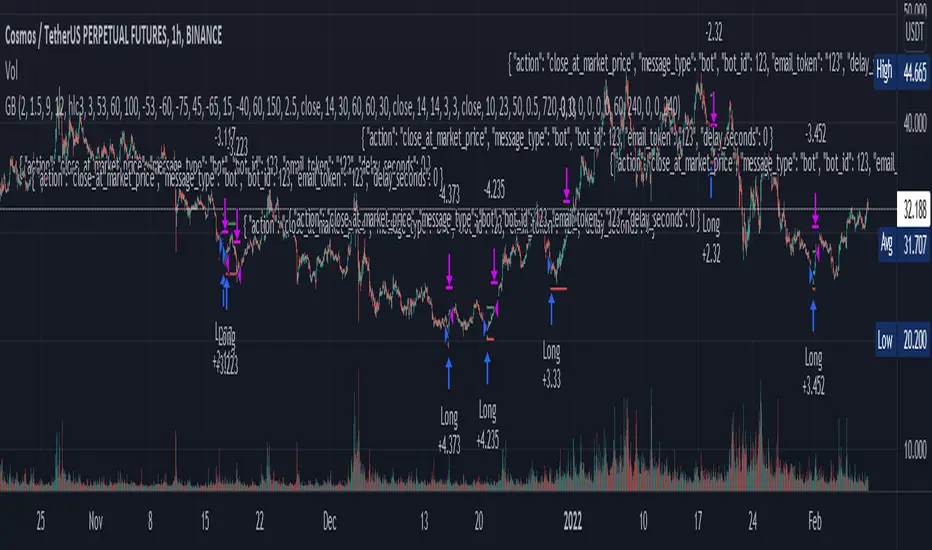
"Golden buy" for cryptofutures (alerts for 3 commas/finandy)This script is a blend of open source cipher B indicator by VuManChu and Hammers & Stars strategy made by ZenAndTheArtOfTrading.
"Golden buy" is based on divergencies and was considered as one of the top strategies for cryptotrading. So I used it for entrance point in this script.
You can turn on opening short positions which are based on divergencies as well.
SL/TP, based on ATR 14, can be tuned, so does Risk/reward ratio.
VuManChu's parameters can be tuned too, but honestly, I don't know how it can help you.
And, finally, you can fully automate your trading with alerts templates presented in the script. (strategy.entry (...//comments= ) - for 3commas and 'alert' function under if conditions for finandy)
Thank you for your attention.
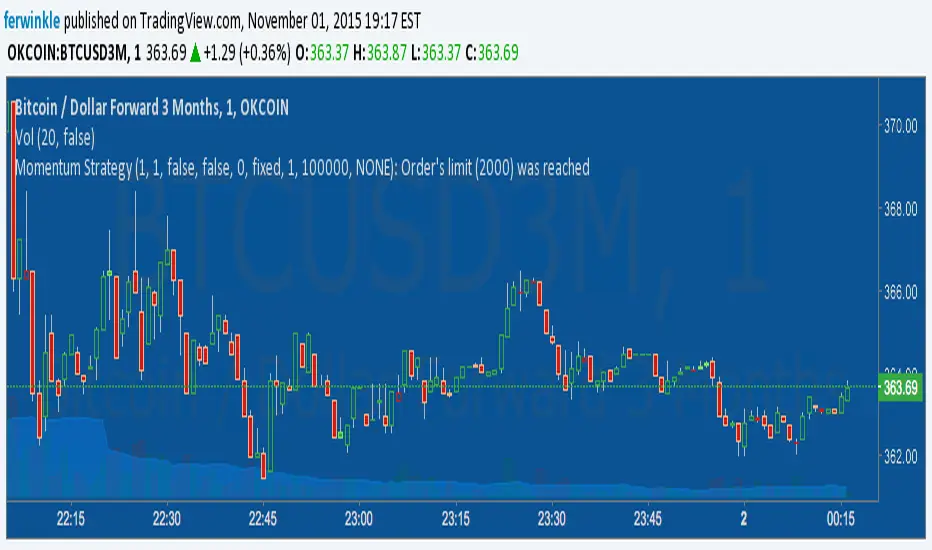
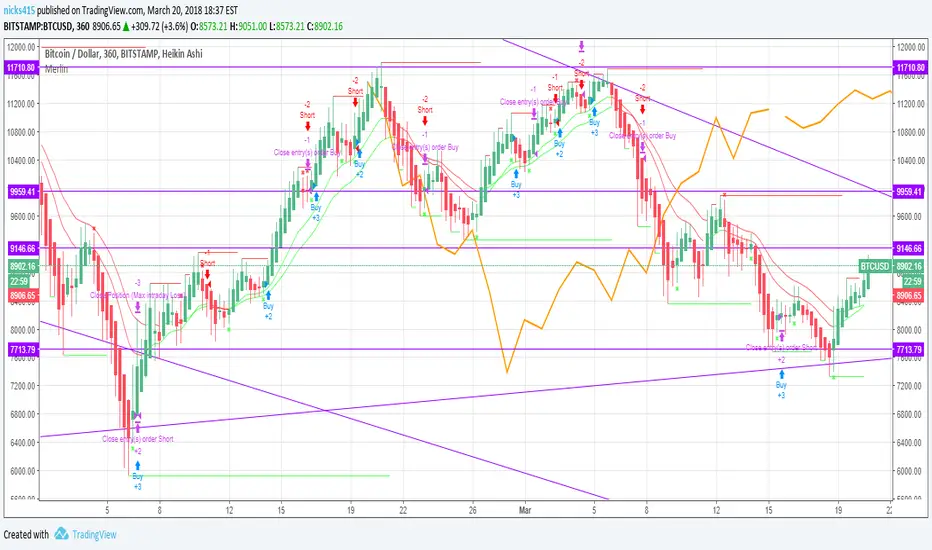
Momentum Strategy (BTC/USDT; 1h) - MACD (with source code)Good morning traders.
It's been a while from my last publication of a strategy and today I want to share with you this small piece of script that showed quite interesting result across bitcoin and other altcoins.
The macd indicator is an indicator built on the difference between a fast moving average and a slow moving average: this difference is generally plottted with a blue line while the orange line is simply a moving average computed on this difference.
Usually this indicator is used in technical analysis for getting signals of buy and sell respectively when the macd crosses above or under its moving average: it means that the distance of the fast moving average (the most responsive one) from the slower one is getting lower than what it-used-to-be in the period considered: this could anticipate a cross of the two moving averages and you want to anticipate this potential trend reversal by opening a long position
Of course the workflow is specularly the same for opening short positions (or closing long positions)
What this strategy does is simply considering the moving average computed on macd and applying a linear regression on it: in this way, even though the signal can be sligthly delayed, you reduce noise plotting a smooth curve.
Then, it simply checks the maximums and the minimums of this curve detecting whenever the changes of the values start to be negative or positive, so it opens a short position (closes long) on the maximum on this curve and it opens a long position (closes short) on the minimum.
Of course, I set an option for using this strategy in a conventional way working on the crosses between macd and its moving average. Alternatively you can use this workflow if you prefer.
In conclusion, you can use a tons of moving averages: I made a function in pine in order to allw you to use any moving average you want for the two moving averages on which the macd is based or for the moving average computed on the macd
PLEASE, BE AWARE THAT THIS TRADING STRATEGY DOES NOT GUARANTEE ANY KIND OF SUCCESS IN ADVANCE. YOU ARE THE ONE AND ONLY RESPONSIBLE OF YOUR OWN DECISIONS, I DON'T TAKE ANY RESPONSIBILITY ASSOCIATED WITH THEM. IF YOU RUN THIS STRATEGY YOU ACCEPT THE POSSIBILITY OF LOOSING MONEY, ALL OF MY PUBBLICATIONS ARE SUPPOSED TO BE JUST FOR EDUCATIONAL PURPOSES.
IT IS AT YOUR OWN RISK WHETHER TO USE IT OR NOT
But if you make money out of this, please consider to buy me a beer 😜
Happy Trading!

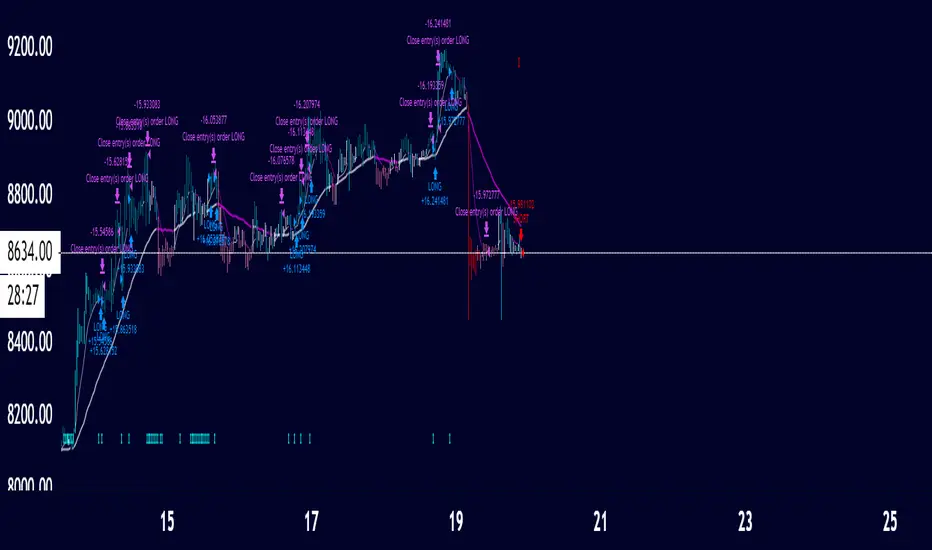
TrendaidTrendaid
is exactly what the name says
an Aid to Trend
Use this strategy to understand when the trend may shift and then use it to stay in the trends longer
simple strat
Buy when it says BULL in BLUE
Short when it says BEAR in RED
you may close your orders when it says to in PURPLE but unneeded if you want
You can adjust the stop which affects the scripts performance
You may also change from a Long to a Short line but the standard has proven to be the best overall
Let Trendaid guide you to riches
this was primarily designed for #forex but can be used in any market including #crypto
get access by joining the #CCV trading family by visiting the link below
- Cheers
SatoshiHeavy Market analyst for CCV Trading
www.cryptocurrentlyvip.com

EO_Momentum_OscillatorMomentum Oscillator works best with HA candles and works on all timeframes. Feel free to use it by adding to your favourites.
It plots a graphic showing whether to short or long, it starts with using shorter span of bars used for the calculation and then moves onto longer/more bars which can be seen in the last pane of the graph which shows 3 horizontal bars showing long or short. When all 3 confirm the same trend it can be taken as a strong signal.

TrapTradingBuy on dips and sell into rallies. Simple as that.
- Short line (green)
- Base line (white)
- Long line (red)
When the market price touches the white or the red(green) lines, buy(sell) orders are generated.
The exit points are 2 lines above(below) the entries.
Parameters
- Period: It affects the value of Base line and the spacing of each line.
- Multiple: Specify the spacing between each line.

GPS_Strategy_V01Momentum based strategy. This is work in development, not really applicable for real trading yet. Looks great on 4H BTCUSD, or 1H ETCUSD lol. Generally should give really reliable entry points, exits, not so much. Will try to finish it up, when I find the time.


Jeddingen Divergence Strategy v4Momentum vs. price divergence. Sell signals on bearish divergence, buy signals on bullish divergence .
Strategy includes an RSI filter, limit the time-range for back-testing and lots of other configuration options.
The below example uses stop-losses.
There is also a matching TradingView study with alert-conditions available!