Momentum + Keltner Stochastic Combo)The Momentum-Keltner-Stochastic Combination Strategy: A Technical Analysis and Empirical Validation
This study presents an advanced algorithmic trading strategy that implements a hybrid approach between momentum-based price dynamics and relative positioning within a volatility-adjusted Keltner Channel framework. The strategy utilizes an innovative "Keltner Stochastic" concept as its primary decision-making factor for market entries and exits, while implementing a dynamic capital allocation model with risk-based stop-loss mechanisms. Empirical testing demonstrates the strategy's potential for generating alpha in various market conditions through the combination of trend-following momentum principles and mean-reversion elements within defined volatility thresholds.
1. Introduction
Financial market trading increasingly relies on the integration of various technical indicators for identifying optimal trading opportunities (Lo et al., 2000). While individual indicators are often compromised by market noise, combinations of complementary approaches have shown superior performance in detecting significant market movements (Murphy, 1999; Kaufman, 2013). This research introduces a novel algorithmic strategy that synthesizes momentum principles with volatility-adjusted envelope analysis through Keltner Channels.
2. Theoretical Foundation
2.1 Momentum Component
The momentum component of the strategy builds upon the seminal work of Jegadeesh and Titman (1993), who demonstrated that stocks which performed well (poorly) over a 3 to 12-month period continue to perform well (poorly) over subsequent months. As Moskowitz et al. (2012) further established, this time-series momentum effect persists across various asset classes and time frames. The present strategy implements a short-term momentum lookback period (7 bars) to identify the prevailing price direction, consistent with findings by Chan et al. (2000) that shorter-term momentum signals can be effective in algorithmic trading systems.
2.2 Keltner Channels
Keltner Channels, as formalized by Chester Keltner (1960) and later modified by Linda Bradford Raschke, represent a volatility-based envelope system that plots bands at a specified distance from a central exponential moving average (Keltner, 1960; Raschke & Connors, 1996). Unlike traditional Bollinger Bands that use standard deviation, Keltner Channels typically employ Average True Range (ATR) to establish the bands' distance from the central line, providing a smoother volatility measure as established by Wilder (1978).
2.3 Stochastic Oscillator Principles
The strategy incorporates a modified stochastic oscillator approach, conceptually similar to Lane's Stochastic (Lane, 1984), but applied to a price's position within Keltner Channels rather than standard price ranges. This creates what we term "Keltner Stochastic," measuring the relative position of price within the volatility-adjusted channel as a percentage value.
3. Strategy Methodology
3.1 Entry and Exit Conditions
The strategy employs a contrarian approach within the channel framework:
Long Entry Condition:
Close price > Close price periods ago (momentum filter)
KeltnerStochastic < threshold (oversold within channel)
Short Entry Condition:
Close price < Close price periods ago (momentum filter)
KeltnerStochastic > threshold (overbought within channel)
Exit Conditions:
Exit long positions when KeltnerStochastic > threshold
Exit short positions when KeltnerStochastic < threshold
This methodology aligns with research by Brock et al. (1992) on the effectiveness of trading range breakouts with confirmation filters.
3.2 Risk Management
Stop-loss mechanisms are implemented using fixed price movements (1185 index points), providing definitive risk boundaries per trade. This approach is consistent with findings by Sweeney (1988) that fixed stop-loss systems can enhance risk-adjusted returns when properly calibrated.
3.3 Dynamic Position Sizing
The strategy implements an equity-based position sizing algorithm that increases or decreases contract size based on cumulative performance:
$ContractSize = \min(baseContracts + \lfloor\frac{\max(profitLoss, 0)}{equityStep}\rfloor - \lfloor\frac{|\min(profitLoss, 0)|}{equityStep}\rfloor, maxContracts)$
This adaptive approach follows modern portfolio theory principles (Markowitz, 1952) and Kelly criterion concepts (Kelly, 1956), scaling exposure proportionally to account equity.
4. Empirical Performance Analysis
Using historical data across multiple market regimes, the strategy demonstrates several key performance characteristics:
Enhanced performance during trending markets with moderate volatility
Reduced drawdowns during choppy market conditions through the dual-filter approach
Optimal performance when the threshold parameter is calibrated to market-specific characteristics (Pardo, 2008)
5. Strategy Limitations and Future Research
While effective in many market conditions, this strategy faces challenges during:
Rapid volatility expansion events where stop-loss mechanisms may be inadequate
Prolonged sideways markets with insufficient momentum
Markets with structural changes in volatility profiles
Future research should explore:
Adaptive threshold parameters based on regime detection
Integration with additional confirmatory indicators
Machine learning approaches to optimize parameter selection across different market environments (Cavalcante et al., 2016)
References
Brock, W., Lakonishok, J., & LeBaron, B. (1992). Simple technical trading rules and the stochastic properties of stock returns. The Journal of Finance, 47(5), 1731-1764.
Cavalcante, R. C., Brasileiro, R. C., Souza, V. L., Nobrega, J. P., & Oliveira, A. L. (2016). Computational intelligence and financial markets: A survey and future directions. Expert Systems with Applications, 55, 194-211.
Chan, L. K. C., Jegadeesh, N., & Lakonishok, J. (2000). Momentum strategies. The Journal of Finance, 51(5), 1681-1713.
Jegadeesh, N., & Titman, S. (1993). Returns to buying winners and selling losers: Implications for stock market efficiency. The Journal of Finance, 48(1), 65-91.
Kaufman, P. J. (2013). Trading systems and methods (5th ed.). John Wiley & Sons.
Kelly, J. L. (1956). A new interpretation of information rate. The Bell System Technical Journal, 35(4), 917-926.
Keltner, C. W. (1960). How to make money in commodities. The Keltner Statistical Service.
Lane, G. C. (1984). Lane's stochastics. Technical Analysis of Stocks & Commodities, 2(3), 87-90.
Lo, A. W., Mamaysky, H., & Wang, J. (2000). Foundations of technical analysis: Computational algorithms, statistical inference, and empirical implementation. The Journal of Finance, 55(4), 1705-1765.
Markowitz, H. (1952). Portfolio selection. The Journal of Finance, 7(1), 77-91.
Moskowitz, T. J., Ooi, Y. H., & Pedersen, L. H. (2012). Time series momentum. Journal of Financial Economics, 104(2), 228-250.
Murphy, J. J. (1999). Technical analysis of the financial markets: A comprehensive guide to trading methods and applications. New York Institute of Finance.
Pardo, R. (2008). The evaluation and optimization of trading strategies (2nd ed.). John Wiley & Sons.
Raschke, L. B., & Connors, L. A. (1996). Street smarts: High probability short-term trading strategies. M. Gordon Publishing Group.
Sweeney, R. J. (1988). Some new filter rule tests: Methods and results. Journal of Financial and Quantitative Analysis, 23(3), 285-300.
Wilder, J. W. (1978). New concepts in technical trading systems. Trend Research.
Cerca negli script per "momentum"

Momentum Matrix (BTC-COIN)The Momentum Matrix (BTC-COIN) indicator analyzes the momentum relationship between Coinbase stock ( NASDAQ:COIN ) and Bitcoin ( CRYPTOCAP:BTC ). By combining RSI, correlation, and dominance metrics, it identifies bullish and bearish macro trends to align trades with market momentum.
How It Works
Price Inputs: Pulls weekly price data for CRYPTOCAP:BTC and NASDAQ:COIN for macro analysis.
Metrics Calculated:
• RSI Divergence: Measures momentum differences between CRYPTOCAP:BTC and $COIN.
• Price Ratio: Tracks the $COIN/ CRYPTOCAP:BTC relationship relative to its long-term average (SMA).
• Correlation: Analyzes price co-movement between CRYPTOCAP:BTC and $COIN.
• Dominance Impact: Incorporates CRYPTOCAP:BTC dominance for broader crypto trends.
Composite Momentum Score: Combines these metrics into a smoothed macro momentum value.
Thresholds for Trend Detection: Upper and lower thresholds dynamically adapt to market conditions.
Signals and Visualization:
• Buy Signal: Momentum exceeds the upper threshold, indicating bullish trends.
• Sell Signal: Momentum falls below the lower threshold, indicating bearish trends.
• Background Colors: Green (bullish), Red (bearish).
Strengths
Integrates multiple metrics for robust macro analysis.
Dynamic thresholds adapt to market conditions.
Effective for identifying macro momentum shifts.
Limitations
Lag in high volatility due to smoothing.
Less effective in choppy, sideways markets.
Assumes CRYPTOCAP:BTC dominance drives NASDAQ:COIN momentum, which may not always hold true.
Improvements
Multi-Timeframe Analysis: Add daily or monthly data for precision.
Volume Filters: Include volume thresholds for signal validation.
Additional Metrics: Consider MACD or Stochastics for further confirmation.
Complementary Tools
Volume Indicators: OBV or cumulative delta for confirmation.
Trend-Following Systems: Pair with moving averages for timing.
Market Breadth Metrics: Combine with CRYPTOCAP:BTC dominance trends for context.

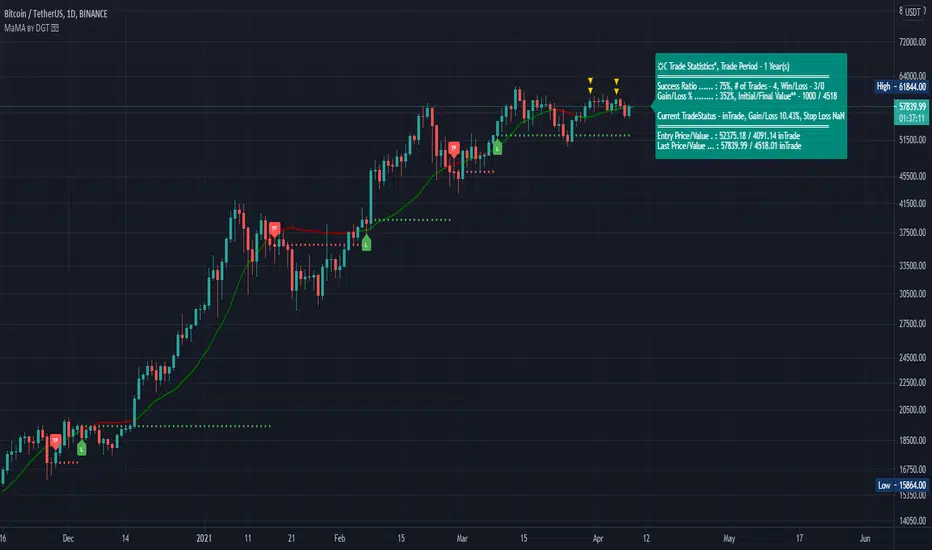
Momentum adjusted Moving Average by DGTA brand new Moving Average , calculated using Momentum, Acceleration and Probability (Psychological Effect).
Momentum adjusted Moving Average(MaMA) is an indicator that measures Price Action by taking into consideration not only Price movements but also its Momentum, Acceleration and Probability. MaMA, provides faster responses comparing to the regular Moving Average
Here is the math of the MaMA idea
Momentum measures change in price over a specified time period
momentum = source – source(length)
where,
source, indicates current bar’s price value
source(length), indicates historical price value of length bars earlier
Lets play with this formula and rewrite it by moving source(length) to other side of the equation
source = source(length) + momentum
to avoid confusion let’s call the source that we aim to predict as adjustedSource
adjustedSource = source(length) + momentum
looks nice the next value of source simply can be calculated by summing of historical value of the source value and value of the momentum. I wish it was so easy, the formula holds true only when the momentum is conserved/constant/steady but momentum move up or down with the price fluctuations (accelerating or decelerating)
Let’s add acceleration effects on our formula, where acceleration is change in momentum for a given length. Then the formula will become as (skipped proof part of acceleration effects, you may google for further details)
adjustedSource = source(length) + momentum + 1/2 * acceleration
here again the formula holds true when the acceleration is constant and once again it is not the case for trading, acceleration also changes with the price fluctuations
Then, how we can benefit from all of this, it has value yet requires additional approaches for better outcome
Let’s simulate behaviour with some predictive approach such as using probability (also known as psychological effect ), where probability is a measure for calculating the chances or the possibilities of the occurrence of a random event. As stated earlier above momentum and acceleration are changing with the price fluctuations, by using the probability approach we can add a predictive skill to determine the likelihood of momentum and acceleration changes (remember it is a predictive approach). With this approach, our equations can be expresses as follows
adjustedSource = source(length) + momentum * probability
adjustedSource = source(length) + ( momentum + 1/2 * acceleration ) * probability , with acceleration effect
Finally, we plot MaMA with the new predicted source adjustedSource, applying acceleration effect is made settable by the used from the dialog box, default value is true.
What to look for:
• Trend Identification
• Support and Resistance
• Price Crossovers
Recommended settings are applied as default settings, if you wish to change the length of the MaMA then you should also adjust length of Momentum (and/or Probability). For example for faster moving average such as 21 period it would be suggested to set momentum length to 13
Alternative usage , set moving average length to 1 and keep rest lengths with default values, it will produce a predictive price line based on momentum and probability. Experience acceleration factor by enabling and disabling it
Conclusion
MaMA provide an added level of confidence to a trading strategy and yet it is important to always be aware that it implements a predictive approach in a chaotic market use with caution just like with any indicator
Trading success is all about following your trading strategy and the indicators should fit within your trading strategy, and not to be traded upon solely
Disclaimer : The script is for informational and educational purposes only. Use of the script does not constitutes professional and/or financial advice. You alone the sole responsibility of evaluating the script output and risks associated with the use of the script. In exchange for using the script, you agree not to hold dgtrd TradingView user liable for any possible claim for damages arising from any decision you make based on use of the script
Momentum 4 Ways Smoothed [Salty]This is an enhance version of Momentum 4 Ways that shows 4 ways to calculate momentum and display each one along with their combined average value.
This study was created to compare 4 different momentum values against their combined average using different display styles to allow the user to experiment with different views of momentum.
- Added the ability to smooth the Average Momentum value. Default Smoothing value is 5.
- Added the ability to use different average calculations. Default is WMA.
- Added the ability to select the number of momentum values to average (1-4). Default is 4.
- Added the ability to use VWAP instead of price as the input.
The Smoothed Average Momentum line is color coded so that it is green when it is moving in the bullish direction and red when it is moving in the bearish direction.

Momentum RibbonThe Momentum Ribbon is a collection of Moving Averages which indicate the severity of pull-backs in a given market.
As the ribbon spreads apart, it indicates more and more significant support/resistance for a trending market. As it is compressed back together, it displays a blue colour to indicate a "cooling" of trend momentum.
Adjustable Moving Average periods and types! You can customize the parameters of your ribbon to your heart's content!

Momentum DivergenceOverview
The Momentum Divergence Oscillator is a valuable tool designed for traders who are familiar with basic charting but want to deepen their market insights. This indicator combines a momentum calculation with divergence detection, presenting the data in an intuitive way with a blue momentum line and colored divergence signals ("Bull" and "Bear"). It’s perfect for refining entry and exit points across various timeframes, especially for scalping or swing trading strategies.
Understanding the Concepts
What is Momentum?
Momentum measures the speed and strength of a price movement by comparing the current closing price to a previous close over a set period. In this indicator, it’s calculated as the difference between the current close and the close from a user-defined number of bars ago (default: 10). A rising momentum line indicates accelerating upward momentum, while a falling line suggests slowing momentum or a potential reversal. This helps you gauge whether a trend is gaining power or losing steam, making it a key indicator for spotting overbought or oversold conditions.
What is a Divergence?
A divergence occurs when the price action and the momentum indicator move in opposite directions, often signaling a potential trend reversal. The Momentum Divergence Oscillator highlights two types:
Bullish Divergence: When the price forms a lower low (indicating weakness), but the momentum shows a higher low (suggesting underlying strength). This can foreshadow an upward reversal.
Bearish Divergence: When the price reaches a higher high (showing strength), but the momentum records a lower high (indicating fading momentum). This may hint at an impending downward turn.
How the Indicator Works
The indicator plots a momentum line in a separate pane below your chart, giving you a clear view of price momentum over time. It also scans for divergences using adjustable lookback periods (default: 5 bars left and right) and a range window (default: 5-60 bars) to ensure relevance. When a divergence is detected, it’s visually highlighted, and you can customize the sensitivity through input settings like the momentum length and pivot lookback. Alerts are included to notify you of new divergence signals in real-time, saving you from constant monitoring.
How to Apply It
Identifying Opportunities: Use bullish divergences ("Bull") as a cue to consider long positions, especially when confirmed by support levels or a moving average crossover. Bearish divergences ("Bear") can signal short opportunities, particularly near resistance zones.
Combining with Other Tools: Pair this oscillator with indicators like the Relative Strength Index (RSI) or volume analysis to filter out false signals and increase confidence in your trades. For example, a bullish divergence with rising volume can be a stronger buy signal.
Timeframe Flexibility: Test it on shorter timeframes (e.g., 5-minute charts) for quick scalping trades or longer ones (e.g., 1-hour or 4-hour charts) for swing trading, adjusting the momentum length to suit the market’s pace.
Alert Setup: Enable the built-in alerts to get notified when a divergence forms, allowing you to react promptly without staring at the screen all day.
Strategy Example
Spot a bullish divergence on a 15-minute chart where the price hits a lower low, but the momentum rises.
Confirm with a break above a 20-period EMA and increasing volume.
Enter a long position with a stop-loss below the recent low and a take-profit near the next resistance level.
Customization Tips
Adjust the "Momentum Length" (default: 10) to make the oscillator more or less sensitive—shorter lengths react faster, while longer ones smooth out noise.
Tweak the "Pivot Lookback" settings to widen or narrow the divergence detection range based on your trading style.
Use the "Range Upper/Lower" inputs to focus on divergences within a specific timeframe that matches your strategy.
Important Considerations
b]This indicator is a technical analysis tool, not a guaranteed trading system. Always pair it with a solid strategy and strict risk management, such as setting stop-losses.
In strong trending markets, divergences can sometimes produce false signals. Consider adding a trend filter (e.g., ADX below 25) to avoid whipsaws.
Experiment with the settings on a demo account or backtest to find what works best for your preferred markets and timeframes.

Momentum Flip Pro - Advanced ZigZag Trading SystemMomentum Flip Pro - Advanced ZigZag Trading System
Complete User Guide
📊 What This Indicator Does
The Momentum Flip Pro is an advanced position-flipping trading system that automatically identifies trend reversals using ZigZag patterns combined with momentum analysis. It's designed for traders who want to always be in the market, flipping between long and short positions at optimal reversal points.
Key Features:
Automatically flips positions at each ZigZag reversal point
Dynamic stop loss placement at exact ZigZag levels
Real-time trading dashboard with performance metrics
Capital tracking and ROI calculation
Three momentum engines to choose from
🎯 How It Works
Entry Signal: When a ZigZag point appears (circle on chart), the indicator:
Exits current position (if any)
Immediately enters opposite position
Places stop loss at the exact ZigZag price
Exit Signal: Positions are closed when the next ZigZag appears, then immediately reversed
Position Management:
Long Entry: ZigZag bottom (momentum turns UP)
Short Entry: ZigZag peak (momentum turns DOWN)
Stop Loss: Always at the ZigZag entry price
Take Profit: Next ZigZag point (automatic position flip)
⚙️ Recommended Settings
For Day Trading (5m-15m timeframes):
Momentum Engine: Quantum
- RSI Length: 9-12
- Quantum Factor: 3.5-4.0
- RSI Smoothing: 3-5
- Threshold: 8-10
For Swing Trading (1H-4H timeframes):
Momentum Engine: MACD
- Fast Length: 12
- Slow Length: 26
- Signal Smoothing: 9
- MA Type: EMA
For Position Trading (Daily):
Momentum Engine: Moving Average
- Average Type: EMA or HMA
- Length: 20-50
📈 How to Use for Trading
Add to Chart:
Add indicator to your chart
Set your starting capital
Choose your preferred momentum engine
Understanding Signals:
Green circles: Strong bullish momentum reversal
Red circles: Strong bearish momentum reversal
Purple circles: Normal momentum reversal
Entry labels: Show exact entry points with tooltips
Trading Rules:
Enter LONG when you see an up arrow + green/purple circle
Enter SHORT when you see a down arrow + red/purple circle
Stop loss is automatically at the ZigZag level
Hold until next ZigZag appears (exit + reverse)
Risk Management:
Risk per trade = Entry Price - Stop Loss
Position size = (Capital * Risk %) / Risk per trade
Recommended risk: 1-2% per trade
💡 Best Practices
Market Conditions:
Works best in trending markets
Excellent for volatile pairs (crypto, forex majors)
Avoid during low volume/consolidation
Timeframe Selection:
Lower timeframes (5m-15m): More signals, higher noise
Higher timeframes (1H+): Fewer signals, higher reliability
Sweet spot: 15m-1H for most traders
Momentum Engine Selection:
Quantum: Best for volatile markets (crypto, indices)
MACD: Best for trending markets (forex, stocks)
Moving Average: Best for smooth trends (commodities)
📊 Dashboard Interpretation
The trading dashboard shows:
Current Capital: Your running balance
Position: Current trade direction
Entry/Stop: Your risk levels
Statistics: Win rate and performance
ROI: Overall return on investment
⚠️ Important Notes
Always Active: This system is always in a position (long or short)
No Neutral: You're either long or short, never flat
Automatic Reversal: Positions flip at each signal
Stop Loss: Fixed at entry ZigZag level (doesn't trail)
🎮 Quick Start Guide
Beginners: Start with default settings on 1H timeframe
Test First: Use paper trading to understand the signals
Small Size: Begin with 1% risk per trade
Track Results: Monitor the dashboard statistics
Adjust: Fine-tune momentum settings based on results
🔧 Customization Tips
Color Signals: Enable to see momentum strength
Dashboard Position: Move to preferred screen location
Visual Settings: Adjust colors for your theme
Alerts: Set up for automated notifications
This indicator is ideal for traders who prefer an always-in-market approach with clear entry/exit rules and automated position management. The key to success is choosing the right momentum engine for your market and maintaining disciplined risk management.

Momentum + Volume Percentile
This advanced momentum indicator combines smoothed momentum analysis with percentile-based volume filtering to identify high-quality trading opportunities backed by significant market participation.
How It Works:
The indicator calculates momentum (rate of change) over a customizable period and applies multiple smoothing techniques to reduce noise. It then filters price action by highlighting only periods where volume exceeds a specified percentile threshold.
The algorithm:
Calculates raw momentum based on price changes over the specified period
Applies customizable smoothing (SMA, EMA, WMA, or HMA) to the momentum values
Computes a moving average of the smoothed momentum as a trend reference
Analyzes volume over a lookback period to establish percentile rankings
Highlights candles where volume exceeds the percentile threshold with color-coded backgrounds
Distinguishes between bullish (green) and bearish (red) high-volume events

Momentum Candle ProjectionThis indicator projects future price momentum by calculating a directional vector from recent price movements. It uses a custom implementation of the atan2 function to create a vector average of the last N candles and visualizes this projection as a synthetic future candle.
🔍 What It Does:
✅ Tracks recent momentum using geometric vectors from price change.
✅ Projects a synthetic "momentum candle" one bar ahead, showing anticipated direction and magnitude.
✅ Optionally plots a secondary "future candle" based on a smoothed estimate of projected price vs. real current close.
⚙️ Settings:
Vector Lookback (bars): Controls how many bars are used to calculate the momentum vector.
Projection Length Multiplier: Adjusts how far forward the vector is projected based on its strength.
🟢 How To Use:
Use the lime/red projection candle to anticipate short-term directional bias.
Use the orange/maroon future candle to compare projected continuation vs. current closing price.
Spot early reversals, continuation zones, and momentum decay in real-time.

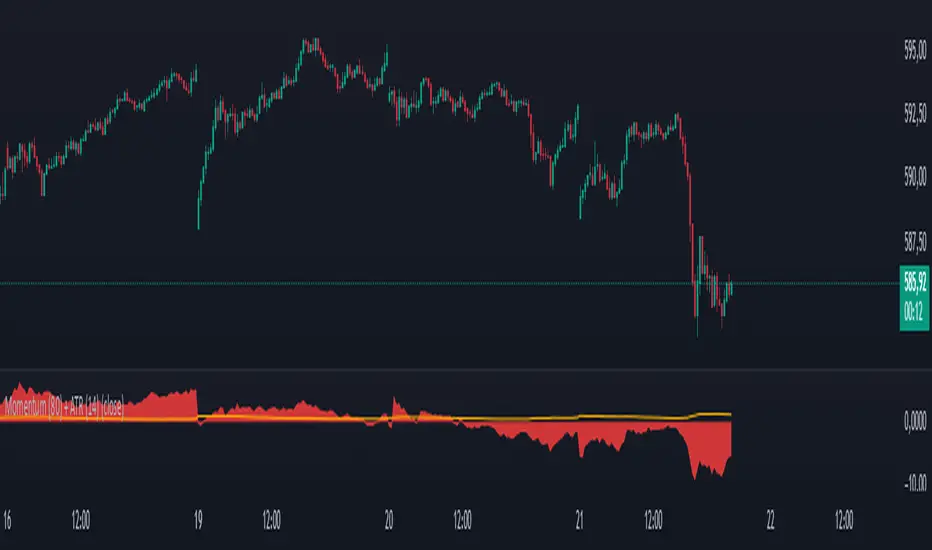
Momentum (80) + ATR (14)his indicator combines two essential technical analysis tools in a single panel for enhanced market insight:
🔹 Momentum (80 periods): Measures the difference between the current price and the price 80 bars ago. Displayed as a semi-transparent filled area, it helps to visually identify shifts in price momentum over a longer timeframe.
🔸 ATR (Average True Range, 14 periods): Shown as a fine orange line, the ATR represents average market volatility over 14 periods, highlighting phases of calm or increased price fluctuations.
By viewing both momentum and volatility simultaneously, traders can better assess trend strength and market conditions, improving decision-making across assets such as stocks, forex, and cryptocurrencies.
✅ Suitable for all asset types
✅ Complements other indicators like RSI, MACD, and Bollinger Bands
✅ Categorized under Momentum & Volatility indicators
Momentum Table - Felipe📊 Momentum Table – By Felipe
This multi-timeframe momentum dashboard displays a clean and color-coded overview of key trend and momentum indicators across 6 major timeframes (5m to 1W), directly on your chart. It’s ideal for quickly identifying market strength, trend alignment, and potential reversals at a glance.
🔍 Features:
EMA Trend Check (EMA 9, 20, 100, 200):
Compares the current close against each EMA.
✅ Green check = price is above the EMA (bullish bias).
🔻 Red arrow = price is below the EMA (bearish bias).
Visual trend alignment helps you spot strong directional setups.
RSI (Relative Strength Index):
Displays current RSI (14) value per timeframe.
Background color highlights momentum conditions:
🔴 Red = Overbought (>70)
🟢 Green = Oversold (<30)
⚪ Gray = Neutral
Stochastic RSI:
Uses Stoch RSI applied to RSI (14) for sensitivity.
Background color follows the same logic as RSI for quick visual cues.
Compact Visual Table:
Located in the bottom-right corner.
Clean design with headers and rows labeled by timeframe.
Helps traders monitor trend and momentum confluence across multiple timeframes in real time.
This tool supports momentum-based strategies, EMA stacking confirmation, and multi-timeframe alignment, making it ideal for scalpers, swing traders, and trend followers alike.

Momentum Zones [TradersPro]OVERVIEW
The Momentum Zones indicator is designed for momentum stock traders to provide a visible trend structure with actionable price levels. The indicator has been designed for high-growth, bullish stocks on a daily time frame but can be used on any chart and timeframe.
Momentum zones help traders focus on the momentum structure of price, enabling disciplined trading plans with specific entry, exit, and risk management levels.
It is built using CCI values, allowing for fixed trend range calculations. It is most effective when applied to screens of stocks with high RSI, year-to-date (YTD) price gains of 25% or higher, as well as stocks showing growth in both sales and earnings quarter-over-quarter and year-over-year.
CONCEPTS
The indicator defines and colors uptrends (green), downtrends (red), and trends in transition or pausing (yellow).
The indicator can be used for new trend entry or trend continuation entry. New trend entry can be done on the first green bar after a red bar. Trend continuation entries can be done with the first green bar after a yellow bar. The yellow transition zones can be used as price buffers for stop-loss management on new entries.
To see the color changes, users need to be sure to uncheck the candlestick color settings. This can be done by right-clicking the chart, going to Symbols, and unchecking the candle color body, border, and wick boxes.
Remember to check them if the indicator is turned off, or the candles will be blank with no color.
The settings also correspond to the screening function to get a list of stocks entering various momentum zones so you can have a prime list of the stocks meeting any other fundamental criteria you may desire. Traders can then use the indicator for the entry and risk structure of the trading plan.

Momentum Performance This Indicator displays the momentum (performance) of the symbol in percent.
You can compare the performance with other symbols.
The default benchmarks are the S&P 500, the MSCI World and the FTSE All World EX US.
The default length corresponds to one year in the timeframes monthly, weekly and daily.
In intraday the default length is 200, but you can also set your own setting.
You have also the opportunity to display a average momentum performance of the main symbol.

Momentum Indicator avg short return minus avg long returnAverage daily return over the period 2-12 months ago minus the average daily return over the period 1-5 years ago
=> a higher return 2-12 months ago indicates a higher return in coming months according to research, because of the momentum risk factor premium
=> a higher return 1-5 years ago indicates a lower return in coming months according to research, because of the momentum risk factor premium

Momentum Acceleration by DGTItalian physicist Galileo Galilei is usually credited with being the first to measure speed by considering the distance covered and the time it takes. Galileo defined speed as the distance covered during a period of time. In equation form, that is v = Δd / Δt where v is speed, Δd is change in distance, and Δt is change in time. The Greek symbol for delta, a triangle (Δ), means change.
Is the speed getting faster or slower?
Acceleration will be the answer, acceleration is defined as the rate of change of speed over a set period of time, meaning something is getting faster or slower. Mathematically expressed, acceleration denoted as a is a = Δv / Δt , where Δv is the change in speed and Δt is the change in time.
How to apply in trading
Lets think about Momentum, Rate of Return, Rate of Change all are calculated in almost same approach with Speed
Momentum measures change in price over a specified time period,
Rate of Change measures percent change in price over a specified time period,
Rate of Return measures the net gain or loss over a specified time period,
And Speed measures change in distance over a specified time period
So we may state that measuring the change in distance is also measuring the change in price over a specified time period which is length, hence
speed can be calculated as (source – source )/length and acceleration becomes (speed – speed )/length
In this study acceleration is used as signal line and result plotted as arrows demonstrating bull or bear direction where direction changes can be considered as trading setups
Just a little fun, since we deal with speed the short name of the study is named after famous cartoon character Speedy Gonzales
Trading success is all about following your trading strategy and the indicators should fit within your trading strategy, and not to be traded upon solely
Disclaimer: The script is for informational and educational purposes only. Use of the script does not constitutes professional and/or financial advice. You alone the sole responsibility of evaluating the script output and risks associated with the use of the script. In exchange for using the script, you agree not to hold dgtrd TradingView user liable for any possible claim for damages arising from any decision you make based on use of the script

Momentum Linear RegressionThe original script was posted on ProRealCode by user Nicolas.
This is an indicator made of the linear regression applied to the rate of change of price (or momentum). I made a simple signal line just by duplicating the first one within a period decay in the past, to make those 2 lines cross. You can add more periods decay to made signal smoother with less false entry.


MomentumIndicatorsLibrary "MomentumIndicators"
This is a library of 'Momentum Indicators', also denominated as oscillators.
The purpose of this library is to organize momentum indicators in just one place, making it easy to access.
In addition, it aims to allow customized versions, not being restricted to just the price value.
An example of this use case is the popular Stochastic RSI.
# Indicators:
1. Relative Strength Index (RSI):
Measures the relative strength of recent price gains to recent price losses of an asset.
2. Rate of Change (ROC):
Measures the percentage change in price of an asset over a specified time period.
3. Stochastic Oscillator (Stoch):
Compares the current price of an asset to its price range over a specified time period.
4. True Strength Index (TSI):
Measures the price change, calculating the ratio of the price change (positive or negative) in relation to the
absolute price change.
The values of both are smoothed twice to reduce noise, and the final result is normalized
in a range between 100 and -100.
5. Stochastic Momentum Index (SMI):
Combination of the True Strength Index with a signal line to help identify turning points in the market.
6. Williams Percent Range (Williams %R):
Compares the current price of an asset to its highest high and lowest low over a specified time period.
7. Commodity Channel Index (CCI):
Measures the relationship between an asset's current price and its moving average.
8. Ultimate Oscillator (UO):
Combines three different time periods to help identify possible reversal points.
9. Moving Average Convergence/Divergence (MACD):
Shows the difference between short-term and long-term exponential moving averages.
10. Fisher Transform (FT):
Normalize prices into a Gaussian normal distribution.
11. Inverse Fisher Transform (IFT):
Transform the values of the Fisher Transform into a smaller and more easily interpretable scale is through the
application of an inverse transformation to the hyperbolic tangent function.
This transformation takes the values of the FT, which range from -infinity to +infinity, to a scale limited
between -1 and +1, allowing them to be more easily visualized and compared.
12. Premier Stochastic Oscillator (PSO):
Normalizes the standard stochastic oscillator by applying a five-period double exponential smoothing average of
the %K value, resulting in a symmetric scale of 1 to -1
# Indicators of indicators:
## Stochastic:
1. Stochastic of RSI (Relative Strengh Index)
2. Stochastic of ROC (Rate of Change)
3. Stochastic of UO (Ultimate Oscillator)
4. Stochastic of TSI (True Strengh Index)
5. Stochastic of Williams R%
6. Stochastic of CCI (Commodity Channel Index).
7. Stochastic of MACD (Moving Average Convergence/Divergence)
8. Stochastic of FT (Fisher Transform)
9. Stochastic of Volume
10. Stochastic of MFI (Money Flow Index)
11. Stochastic of On OBV (Balance Volume)
12. Stochastic of PVI (Positive Volume Index)
13. Stochastic of NVI (Negative Volume Index)
14. Stochastic of PVT (Price-Volume Trend)
15. Stochastic of VO (Volume Oscillator)
16. Stochastic of VROC (Volume Rate of Change)
## Inverse Fisher Transform:
1.Inverse Fisher Transform on RSI (Relative Strengh Index)
2.Inverse Fisher Transform on ROC (Rate of Change)
3.Inverse Fisher Transform on UO (Ultimate Oscillator)
4.Inverse Fisher Transform on Stochastic
5.Inverse Fisher Transform on TSI (True Strength Index)
6.Inverse Fisher Transform on CCI (Commodity Channel Index)
7.Inverse Fisher Transform on Fisher Transform (FT)
8.Inverse Fisher Transform on MACD (Moving Average Convergence/Divergence)
9.Inverse Fisher Transfor on Williams R% (Williams Percent Range)
10.Inverse Fisher Transfor on CMF (Chaikin Money Flow)
11.Inverse Fisher Transform on VO (Volume Oscillator)
12.Inverse Fisher Transform on VROC (Volume Rate of Change)
## Stochastic Momentum Index:
1.Stochastic Momentum Index of RSI (Relative Strength Index)
2.Stochastic Momentum Index of ROC (Rate of Change)
3.Stochastic Momentum Index of VROC (Volume Rate of Change)
4.Stochastic Momentum Index of Williams R% (Williams Percent Range)
5.Stochastic Momentum Index of FT (Fisher Transform)
6.Stochastic Momentum Index of CCI (Commodity Channel Index)
7.Stochastic Momentum Index of UO (Ultimate Oscillator)
8.Stochastic Momentum Index of MACD (Moving Average Convergence/Divergence)
9.Stochastic Momentum Index of Volume
10.Stochastic Momentum Index of MFI (Money Flow Index)
11.Stochastic Momentum Index of CMF (Chaikin Money Flow)
12.Stochastic Momentum Index of On Balance Volume (OBV)
13.Stochastic Momentum Index of Price-Volume Trend (PVT)
14.Stochastic Momentum Index of Volume Oscillator (VO)
15.Stochastic Momentum Index of Positive Volume Index (PVI)
16.Stochastic Momentum Index of Negative Volume Index (NVI)
## Relative Strength Index:
1. RSI for Volume
2. RSI for Moving Average
rsi(source, length)
RSI (Relative Strengh Index). Measures the relative strength of recent price gains to recent price losses of an asset.
Parameters:
source : (float) Source of series (close, high, low, etc.)
length : (int) Period of loopback
Returns: (float) Series of RSI
roc(source, length)
ROC (Rate of Change). Measures the percentage change in price of an asset over a specified time period.
Parameters:
source : (float) Source of series (close, high, low, etc.)
length : (int) Period of loopback
Returns: (float) Series of ROC
stoch(kLength, kSmoothing, dSmoothing, maTypeK, maTypeD, almaOffsetKD, almaSigmaKD, lsmaOffSetKD)
Stochastic Oscillator. Compares the current price of an asset to its price range over a specified time period.
Parameters:
kLength
kSmoothing : (int) Period for smoothig stochastic
dSmoothing : (int) Period for signal (moving average of stochastic)
maTypeK : (int) Type of Moving Average for Stochastic Oscillator
maTypeD : (int) Type of Moving Average for Stochastic Oscillator Signal
almaOffsetKD : (float) Offset for Arnaud Legoux Moving Average for Oscillator and Signal
almaSigmaKD : (float) Sigma for Arnaud Legoux Moving Average for Oscillator and Signal
lsmaOffSetKD : (int) Offset for Least Squares Moving Average for Oscillator and Signal
Returns: A tuple of Stochastic Oscillator and Moving Average of Stochastic Oscillator
stoch(source, kLength, kSmoothing, dSmoothing, maTypeK, maTypeD, almaOffsetKD, almaSigmaKD, lsmaOffSetKD)
Stochastic Oscillator. Customized source. Compares the current price of an asset to its price range over a specified time period.
Parameters:
source : (float) Source of series (close, high, low, etc.)
kLength : (int) Period of loopback to calculate the stochastic
kSmoothing : (int) Period for smoothig stochastic
dSmoothing : (int) Period for signal (moving average of stochastic)
maTypeK : (int) Type of Moving Average for Stochastic Oscillator
maTypeD : (int) Type of Moving Average for Stochastic Oscillator Signal
almaOffsetKD : (float) Offset for Arnaud Legoux Moving Average for Stoch and Signal
almaSigmaKD : (float) Sigma for Arnaud Legoux Moving Average for Stoch and Signal
lsmaOffSetKD : (int) Offset for Least Squares Moving Average for Stoch and Signal
Returns: A tuple of Stochastic Oscillator and Moving Average of Stochastic Oscillator
tsi(source, shortLength, longLength, maType, almaOffset, almaSigma, lsmaOffSet)
TSI (True Strengh Index). Measures the price change, calculating the ratio of the price change (positive or negative) in relation to the absolute price change.
The values of both are smoothed twice to reduce noise, and the final result is normalized in a range between 100 and -100.
Parameters:
source : (float) Source of series (close, high, low, etc.)
shortLength : (int) Short length
longLength : (int) Long length
maType : (int) Type of Moving Average for TSI
almaOffset : (float) Offset for Arnaud Legoux Moving Average
almaSigma : (float) Sigma for Arnaud Legoux Moving Average
lsmaOffSet : (int) Offset for Least Squares Moving Average
Returns: (float) TSI
smi(sourceTSI, shortLengthTSI, longLengthTSI, maTypeTSI, almaOffsetTSI, almaSigmaTSI, lsmaOffSetTSI, maTypeSignal, smoothingLengthSignal, almaOffsetSignal, almaSigmaSignal, lsmaOffSetSignal)
SMI (Stochastic Momentum Index). A TSI (True Strengh Index) plus a signal line.
Parameters:
sourceTSI : (float) Source of series for TSI (close, high, low, etc.)
shortLengthTSI : (int) Short length for TSI
longLengthTSI : (int) Long length for TSI
maTypeTSI : (int) Type of Moving Average for Signal of TSI
almaOffsetTSI : (float) Offset for Arnaud Legoux Moving Average
almaSigmaTSI : (float) Sigma for Arnaud Legoux Moving Average
lsmaOffSetTSI : (int) Offset for Least Squares Moving Average
maTypeSignal
smoothingLengthSignal
almaOffsetSignal
almaSigmaSignal
lsmaOffSetSignal
Returns: A tuple with TSI, signal of TSI and histogram of difference
wpr(source, length)
Williams R% (Williams Percent Range). Compares the current price of an asset to its highest high and lowest low over a specified time period.
Parameters:
source : (float) Source of series (close, high, low, etc.)
length : (int) Period of loopback
Returns: (float) Series of Williams R%
cci(source, length, maType, almaOffset, almaSigma, lsmaOffSet)
CCI (Commodity Channel Index). Measures the relationship between an asset's current price and its moving average.
Parameters:
source : (float) Source of series (close, high, low, etc.)
length : (int) Period of loopback
maType : (int) Type of Moving Average
almaOffset : (float) Offset for Arnaud Legoux Moving Average
almaSigma : (float) Sigma for Arnaud Legoux Moving Average
lsmaOffSet : (int) Offset for Least Squares Moving Average
Returns: (float) Series of CCI
ultimateOscillator(fastLength, middleLength, slowLength)
UO (Ultimate Oscilator). Combines three different time periods to help identify possible reversal points.
Parameters:
fastLength : (int) Fast period of loopback
middleLength : (int) Middle period of loopback
slowLength : (int) Slow period of loopback
Returns: (float) Series of Ultimate Oscilator
ultimateOscillator(source, fastLength, middleLength, slowLength)
UO (Ultimate Oscilator). Customized source. Combines three different time periods to help identify possible reversal points.
Parameters:
source : (float) Source of series (close, high, low, etc.)
fastLength : (int) Fast period of loopback
middleLength : (int) Middle period of loopback
slowLength : (int) Slow period of loopback
Returns: (float) Series of Ultimate Oscilator
macd(source, fastLength, slowLength, signalLength, maTypeFast, maTypeSlow, maTypeMACD, almaOffset, almaSigma, lsmaOffSet)
MACD (Moving Average Convergence/Divergence). Shows the difference between short-term and long-term exponential moving averages.
Parameters:
source : (float) Source of series (close, high, low, etc.)
fastLength : (int) Period for fast moving average
slowLength : (int) Period for slow moving average
signalLength : (int) Signal length
maTypeFast : (int) Type of fast moving average
maTypeSlow : (int) Type of slow moving average
maTypeMACD : (int) Type of MACD moving average
almaOffset : (float) Offset for Arnaud Legoux Moving Average
almaSigma : (float) Sigma for Arnaud Legoux Moving Average
lsmaOffSet : (int) Offset for Least Squares Moving Average
Returns: A tuple with MACD, Signal, and Histgram
fisher(length)
Fisher Transform. Normalize prices into a Gaussian normal distribution.
Parameters:
length
Returns: A tuple with Fisher Transform and signal
fisher(source, length)
Fisher Transform. Customized source. Normalize prices into a Gaussian normal distribution.
Parameters:
source : (float) Source of series (close, high, low, etc.)
length
Returns: A tuple with Fisher Transform and signal
inverseFisher(source, length, subtrahend, denominator)
Inverse Fisher Transform.
Transform the values of the Fisher Transform into a smaller and more easily interpretable scale is
through the application of an inverse transformation to the hyperbolic tangent function.
This transformation takes the values of the FT, which range from -infinity to +infinity,
to a scale limited between -1 and +1, allowing them to be more easily visualized and compared.
Parameters:
source : (float) Source of series (close, high, low, etc.)
length : (int) Period for loopback
subtrahend : (int) Denominator. Useful in unbounded indicators. For example, in CCI.
denominator
Returns: (float) Series of Inverse Fisher Transform
premierStoch(length, smoothlen)
Premier Stochastic Oscillator (PSO).
Normalizes the standard stochastic oscillator by applying a five-period double exponential smoothing
average of the %K value, resulting in a symmetric scale of 1 to -1.
Parameters:
length : (int) Period for loopback
smoothlen : (int) Period for smoothing
Returns: (float) Series of PSO
premierStoch(source, smoothlen, subtrahend, denominator)
Premier Stochastic Oscillator (PSO) of custom source.
Normalizes the source by applying a five-period double exponential smoothing average.
Parameters:
source : (float) Source of series (close, high, low, etc.)
smoothlen : (int) Period for smoothing
subtrahend : (int) Denominator. Useful in unbounded indicators. For example, in CCI.
denominator
Returns: (float) Series of PSO
stochRsi(sourceRSI, lengthRSI, kLength, kSmoothing, dSmoothing, maTypeK, maTypeD, almaOffsetKD, almaSigmaKD, lsmaOffSetKD)
Parameters:
sourceRSI
lengthRSI
kLength
kSmoothing
dSmoothing
maTypeK
maTypeD
almaOffsetKD
almaSigmaKD
lsmaOffSetKD
stochRoc(sourceROC, lengthROC, kLength, kSmoothing, dSmoothing, maTypeK, maTypeD, almaOffsetKD, almaSigmaKD, lsmaOffSetKD)
Parameters:
sourceROC
lengthROC
kLength
kSmoothing
dSmoothing
maTypeK
maTypeD
almaOffsetKD
almaSigmaKD
lsmaOffSetKD
stochUO(fastLength, middleLength, slowLength, kLength, kSmoothing, dSmoothing, maTypeK, maTypeD, almaOffsetKD, almaSigmaKD, lsmaOffSetKD)
Parameters:
fastLength
middleLength
slowLength
kLength
kSmoothing
dSmoothing
maTypeK
maTypeD
almaOffsetKD
almaSigmaKD
lsmaOffSetKD
stochTSI(source, shortLength, longLength, maType, almaOffset, almaSigma, lsmaOffSet, kLength, kSmoothing, dSmoothing, maTypeK, maTypeD, almaOffsetKD, almaSigmaKD, lsmaOffSetKD)
Parameters:
source
shortLength
longLength
maType
almaOffset
almaSigma
lsmaOffSet
kLength
kSmoothing
dSmoothing
maTypeK
maTypeD
almaOffsetKD
almaSigmaKD
lsmaOffSetKD
stochWPR(source, length, kLength, kSmoothing, dSmoothing, maTypeK, maTypeD, almaOffsetKD, almaSigmaKD, lsmaOffSetKD)
Parameters:
source
length
kLength
kSmoothing
dSmoothing
maTypeK
maTypeD
almaOffsetKD
almaSigmaKD
lsmaOffSetKD
stochCCI(source, length, maType, almaOffset, almaSigma, lsmaOffSet, kLength, kSmoothing, dSmoothing, maTypeK, maTypeD, almaOffsetKD, almaSigmaKD, lsmaOffSetKD)
Parameters:
source
length
maType
almaOffset
almaSigma
lsmaOffSet
kLength
kSmoothing
dSmoothing
maTypeK
maTypeD
almaOffsetKD
almaSigmaKD
lsmaOffSetKD
stochMACD(source, fastLength, slowLength, signalLength, maTypeFast, maTypeSlow, maTypeMACD, almaOffset, almaSigma, lsmaOffSet, kLength, kSmoothing, dSmoothing, maTypeK, maTypeD, almaOffsetKD, almaSigmaKD, lsmaOffSetKD)
Parameters:
source
fastLength
slowLength
signalLength
maTypeFast
maTypeSlow
maTypeMACD
almaOffset
almaSigma
lsmaOffSet
kLength
kSmoothing
dSmoothing
maTypeK
maTypeD
almaOffsetKD
almaSigmaKD
lsmaOffSetKD
stochFT(length, kLength, kSmoothing, dSmoothing, maTypeK, maTypeD, almaOffsetKD, almaSigmaKD, lsmaOffSetKD)
Parameters:
length
kLength
kSmoothing
dSmoothing
maTypeK
maTypeD
almaOffsetKD
almaSigmaKD
lsmaOffSetKD
stochVolume(kLength, kSmoothing, dSmoothing, maTypeK, maTypeD, almaOffsetKD, almaSigmaKD, lsmaOffSetKD)
Parameters:
kLength
kSmoothing
dSmoothing
maTypeK
maTypeD
almaOffsetKD
almaSigmaKD
lsmaOffSetKD
stochMFI(source, length, kLength, kSmoothing, dSmoothing, maTypeK, maTypeD, almaOffsetKD, almaSigmaKD, lsmaOffSetKD)
Parameters:
source
length
kLength
kSmoothing
dSmoothing
maTypeK
maTypeD
almaOffsetKD
almaSigmaKD
lsmaOffSetKD
stochOBV(source, kLength, kSmoothing, dSmoothing, maTypeK, maTypeD, almaOffsetKD, almaSigmaKD, lsmaOffSetKD)
Parameters:
source
kLength
kSmoothing
dSmoothing
maTypeK
maTypeD
almaOffsetKD
almaSigmaKD
lsmaOffSetKD
stochPVI(source, kLength, kSmoothing, dSmoothing, maTypeK, maTypeD, almaOffsetKD, almaSigmaKD, lsmaOffSetKD)
Parameters:
source
kLength
kSmoothing
dSmoothing
maTypeK
maTypeD
almaOffsetKD
almaSigmaKD
lsmaOffSetKD
stochNVI(source, kLength, kSmoothing, dSmoothing, maTypeK, maTypeD, almaOffsetKD, almaSigmaKD, lsmaOffSetKD)
Parameters:
source
kLength
kSmoothing
dSmoothing
maTypeK
maTypeD
almaOffsetKD
almaSigmaKD
lsmaOffSetKD
stochPVT(source, kLength, kSmoothing, dSmoothing, maTypeK, maTypeD, almaOffsetKD, almaSigmaKD, lsmaOffSetKD)
Parameters:
source
kLength
kSmoothing
dSmoothing
maTypeK
maTypeD
almaOffsetKD
almaSigmaKD
lsmaOffSetKD
stochVO(shortLen, longLen, maType, almaOffset, almaSigma, lsmaOffSet, kLength, kSmoothing, dSmoothing, maTypeK, maTypeD, almaOffsetKD, almaSigmaKD, lsmaOffSetKD)
Parameters:
shortLen
longLen
maType
almaOffset
almaSigma
lsmaOffSet
kLength
kSmoothing
dSmoothing
maTypeK
maTypeD
almaOffsetKD
almaSigmaKD
lsmaOffSetKD
stochVROC(length, kLength, kSmoothing, dSmoothing, maTypeK, maTypeD, almaOffsetKD, almaSigmaKD, lsmaOffSetKD)
Parameters:
length
kLength
kSmoothing
dSmoothing
maTypeK
maTypeD
almaOffsetKD
almaSigmaKD
lsmaOffSetKD
iftRSI(sourceRSI, lengthRSI, lengthIFT)
Parameters:
sourceRSI
lengthRSI
lengthIFT
iftROC(sourceROC, lengthROC, lengthIFT)
Parameters:
sourceROC
lengthROC
lengthIFT
iftUO(fastLength, middleLength, slowLength, lengthIFT)
Parameters:
fastLength
middleLength
slowLength
lengthIFT
iftStoch(kLength, kSmoothing, dSmoothing, maTypeK, maTypeD, almaOffsetKD, almaSigmaKD, lsmaOffSetKD, lengthIFT)
Parameters:
kLength
kSmoothing
dSmoothing
maTypeK
maTypeD
almaOffsetKD
almaSigmaKD
lsmaOffSetKD
lengthIFT
iftTSI(source, shortLength, longLength, maType, almaOffset, almaSigma, lsmaOffSet, lengthIFT)
Parameters:
source
shortLength
longLength
maType
almaOffset
almaSigma
lsmaOffSet
lengthIFT
iftCCI(source, length, maType, almaOffset, almaSigma, lsmaOffSet, lengthIFT)
Parameters:
source
length
maType
almaOffset
almaSigma
lsmaOffSet
lengthIFT
iftFisher(length, lengthIFT)
Parameters:
length
lengthIFT
iftMACD(source, fastLength, slowLength, signalLength, maTypeFast, maTypeSlow, maTypeMACD, almaOffset, almaSigma, lsmaOffSet, lengthIFT)
Parameters:
source
fastLength
slowLength
signalLength
maTypeFast
maTypeSlow
maTypeMACD
almaOffset
almaSigma
lsmaOffSet
lengthIFT
iftWPR(source, length, lengthIFT)
Parameters:
source
length
lengthIFT
iftMFI(source, length, lengthIFT)
Parameters:
source
length
lengthIFT
iftCMF(length, lengthIFT)
Parameters:
length
lengthIFT
iftVO(shortLen, longLen, maType, almaOffset, almaSigma, lsmaOffSet, lengthIFT)
Parameters:
shortLen
longLen
maType
almaOffset
almaSigma
lsmaOffSet
lengthIFT
iftVROC(length, lengthIFT)
Parameters:
length
lengthIFT
smiRSI(source, length, shortLengthTSI, longLengthTSI, maTypeTSI, almaOffsetTSI, almaSigmaTSI, lsmaOffSetTSI, maTypeSignal, smoothingLengthSignal, almaOffsetSignal, almaSigmaSignal, lsmaOffSetSignal)
Parameters:
source
length
shortLengthTSI
longLengthTSI
maTypeTSI
almaOffsetTSI
almaSigmaTSI
lsmaOffSetTSI
maTypeSignal
smoothingLengthSignal
almaOffsetSignal
almaSigmaSignal
lsmaOffSetSignal
smiROC(source, length, shortLengthTSI, longLengthTSI, maTypeTSI, almaOffsetTSI, almaSigmaTSI, lsmaOffSetTSI, maTypeSignal, smoothingLengthSignal, almaOffsetSignal, almaSigmaSignal, lsmaOffSetSignal)
Parameters:
source
length
shortLengthTSI
longLengthTSI
maTypeTSI
almaOffsetTSI
almaSigmaTSI
lsmaOffSetTSI
maTypeSignal
smoothingLengthSignal
almaOffsetSignal
almaSigmaSignal
lsmaOffSetSignal
smiVROC(length, shortLengthTSI, longLengthTSI, maTypeTSI, almaOffsetTSI, almaSigmaTSI, lsmaOffSetTSI, maTypeSignal, smoothingLengthSignal, almaOffsetSignal, almaSigmaSignal, lsmaOffSetSignal)
Parameters:
length
shortLengthTSI
longLengthTSI
maTypeTSI
almaOffsetTSI
almaSigmaTSI
lsmaOffSetTSI
maTypeSignal
smoothingLengthSignal
almaOffsetSignal
almaSigmaSignal
lsmaOffSetSignal
smiWPR(source, length, shortLengthTSI, longLengthTSI, maTypeTSI, almaOffsetTSI, almaSigmaTSI, lsmaOffSetTSI, maTypeSignal, smoothingLengthSignal, almaOffsetSignal, almaSigmaSignal, lsmaOffSetSignal)
Parameters:
source
length
shortLengthTSI
longLengthTSI
maTypeTSI
almaOffsetTSI
almaSigmaTSI
lsmaOffSetTSI
maTypeSignal
smoothingLengthSignal
almaOffsetSignal
almaSigmaSignal
lsmaOffSetSignal
smiFT(length, shortLengthTSI, longLengthTSI, maTypeTSI, almaOffsetTSI, almaSigmaTSI, lsmaOffSetTSI, maTypeSignal, smoothingLengthSignal, almaOffsetSignal, almaSigmaSignal, lsmaOffSetSignal)
Parameters:
length
shortLengthTSI
longLengthTSI
maTypeTSI
almaOffsetTSI
almaSigmaTSI
lsmaOffSetTSI
maTypeSignal
smoothingLengthSignal
almaOffsetSignal
almaSigmaSignal
lsmaOffSetSignal
smiFT(source, length, shortLengthTSI, longLengthTSI, maTypeTSI, almaOffsetTSI, almaSigmaTSI, lsmaOffSetTSI, maTypeSignal, smoothingLengthSignal, almaOffsetSignal, almaSigmaSignal, lsmaOffSetSignal)
Parameters:
source
length
shortLengthTSI
longLengthTSI
maTypeTSI
almaOffsetTSI
almaSigmaTSI
lsmaOffSetTSI
maTypeSignal
smoothingLengthSignal
almaOffsetSignal
almaSigmaSignal
lsmaOffSetSignal
smiCCI(source, length, maTypeCCI, almaOffsetCCI, almaSigmaCCI, lsmaOffSetCCI, shortLengthTSI, longLengthTSI, maTypeTSI, almaOffsetTSI, almaSigmaTSI, lsmaOffSetTSI, maTypeSignal, smoothingLengthSignal, almaOffsetSignal, almaSigmaSignal, lsmaOffSetSignal)
Parameters:
source
length
maTypeCCI
almaOffsetCCI
almaSigmaCCI
lsmaOffSetCCI
shortLengthTSI
longLengthTSI
maTypeTSI
almaOffsetTSI
almaSigmaTSI
lsmaOffSetTSI
maTypeSignal
smoothingLengthSignal
almaOffsetSignal
almaSigmaSignal
lsmaOffSetSignal
smiUO(fastLength, middleLength, slowLength, shortLengthTSI, longLengthTSI, maTypeTSI, almaOffsetTSI, almaSigmaTSI, lsmaOffSetTSI, maTypeSignal, smoothingLengthSignal, almaOffsetSignal, almaSigmaSignal, lsmaOffSetSignal)
Parameters:
fastLength
middleLength
slowLength
shortLengthTSI
longLengthTSI
maTypeTSI
almaOffsetTSI
almaSigmaTSI
lsmaOffSetTSI
maTypeSignal
smoothingLengthSignal
almaOffsetSignal
almaSigmaSignal
lsmaOffSetSignal
smiMACD(source, fastLength, slowLength, signalLength, maTypeFast, maTypeSlow, maTypeMACD, almaOffset, almaSigma, lsmaOffSet, shortLengthTSI, longLengthTSI, maTypeTSI, almaOffsetTSI, almaSigmaTSI, lsmaOffSetTSI, maTypeSignal, smoothingLengthSignal, almaOffsetSignal, almaSigmaSignal, lsmaOffSetSignal)
Parameters:
source
fastLength
slowLength
signalLength
maTypeFast
maTypeSlow
maTypeMACD
almaOffset
almaSigma
lsmaOffSet
shortLengthTSI
longLengthTSI
maTypeTSI
almaOffsetTSI
almaSigmaTSI
lsmaOffSetTSI
maTypeSignal
smoothingLengthSignal
almaOffsetSignal
almaSigmaSignal
lsmaOffSetSignal
smiVol(shortLengthTSI, longLengthTSI, maTypeTSI, almaOffsetTSI, almaSigmaTSI, lsmaOffSetTSI, maTypeSignal, smoothingLengthSignal, almaOffsetSignal, almaSigmaSignal, lsmaOffSetSignal)
Parameters:
shortLengthTSI
longLengthTSI
maTypeTSI
almaOffsetTSI
almaSigmaTSI
lsmaOffSetTSI
maTypeSignal
smoothingLengthSignal
almaOffsetSignal
almaSigmaSignal
lsmaOffSetSignal
smiMFI(source, length, shortLengthTSI, longLengthTSI, maTypeTSI, almaOffsetTSI, almaSigmaTSI, lsmaOffSetTSI, maTypeSignal, smoothingLengthSignal, almaOffsetSignal, almaSigmaSignal, lsmaOffSetSignal)
Parameters:
source
length
shortLengthTSI
longLengthTSI
maTypeTSI
almaOffsetTSI
almaSigmaTSI
lsmaOffSetTSI
maTypeSignal
smoothingLengthSignal
almaOffsetSignal
almaSigmaSignal
lsmaOffSetSignal
smiCMF(length, shortLengthTSI, longLengthTSI, maTypeTSI, almaOffsetTSI, almaSigmaTSI, lsmaOffSetTSI, maTypeSignal, smoothingLengthSignal, almaOffsetSignal, almaSigmaSignal, lsmaOffSetSignal)
Parameters:
length
shortLengthTSI
longLengthTSI
maTypeTSI
almaOffsetTSI
almaSigmaTSI
lsmaOffSetTSI
maTypeSignal
smoothingLengthSignal
almaOffsetSignal
almaSigmaSignal
lsmaOffSetSignal
smiOBV(source, shortLengthTSI, longLengthTSI, maTypeTSI, almaOffsetTSI, almaSigmaTSI, lsmaOffSetTSI, maTypeSignal, smoothingLengthSignal, almaOffsetSignal, almaSigmaSignal, lsmaOffSetSignal)
Parameters:
source
shortLengthTSI
longLengthTSI
maTypeTSI
almaOffsetTSI
almaSigmaTSI
lsmaOffSetTSI
maTypeSignal
smoothingLengthSignal
almaOffsetSignal
almaSigmaSignal
lsmaOffSetSignal
smiPVT(source, shortLengthTSI, longLengthTSI, maTypeTSI, almaOffsetTSI, almaSigmaTSI, lsmaOffSetTSI, maTypeSignal, smoothingLengthSignal, almaOffsetSignal, almaSigmaSignal, lsmaOffSetSignal)
Parameters:
source
shortLengthTSI
longLengthTSI
maTypeTSI
almaOffsetTSI
almaSigmaTSI
lsmaOffSetTSI
maTypeSignal
smoothingLengthSignal
almaOffsetSignal
almaSigmaSignal
lsmaOffSetSignal
smiVO(shortLen, longLen, maType, almaOffset, almaSigma, lsmaOffSet, shortLengthTSI, longLengthTSI, maTypeTSI, almaOffsetTSI, almaSigmaTSI, lsmaOffSetTSI, maTypeSignal, smoothingLengthSignal, almaOffsetSignal, almaSigmaSignal, lsmaOffSetSignal)
Parameters:
shortLen
longLen
maType
almaOffset
almaSigma
lsmaOffSet
shortLengthTSI
longLengthTSI
maTypeTSI
almaOffsetTSI
almaSigmaTSI
lsmaOffSetTSI
maTypeSignal
smoothingLengthSignal
almaOffsetSignal
almaSigmaSignal
lsmaOffSetSignal
smiPVI(source, shortLengthTSI, longLengthTSI, maTypeTSI, almaOffsetTSI, almaSigmaTSI, lsmaOffSetTSI, maTypeSignal, smoothingLengthSignal, almaOffsetSignal, almaSigmaSignal, lsmaOffSetSignal)
Parameters:
source
shortLengthTSI
longLengthTSI
maTypeTSI
almaOffsetTSI
almaSigmaTSI
lsmaOffSetTSI
maTypeSignal
smoothingLengthSignal
almaOffsetSignal
almaSigmaSignal
lsmaOffSetSignal
smiNVI(source, shortLengthTSI, longLengthTSI, maTypeTSI, almaOffsetTSI, almaSigmaTSI, lsmaOffSetTSI, maTypeSignal, smoothingLengthSignal, almaOffsetSignal, almaSigmaSignal, lsmaOffSetSignal)
Parameters:
source
shortLengthTSI
longLengthTSI
maTypeTSI
almaOffsetTSI
almaSigmaTSI
lsmaOffSetTSI
maTypeSignal
smoothingLengthSignal
almaOffsetSignal
almaSigmaSignal
lsmaOffSetSignal
rsiVolume(length)
Parameters:
length
rsiMA(sourceMA, lengthMA, maType, almaOffset, almaSigma, lsmaOffSet, lengthRSI)
Parameters:
sourceMA
lengthMA
maType
almaOffset
almaSigma
lsmaOffSet
lengthRSI

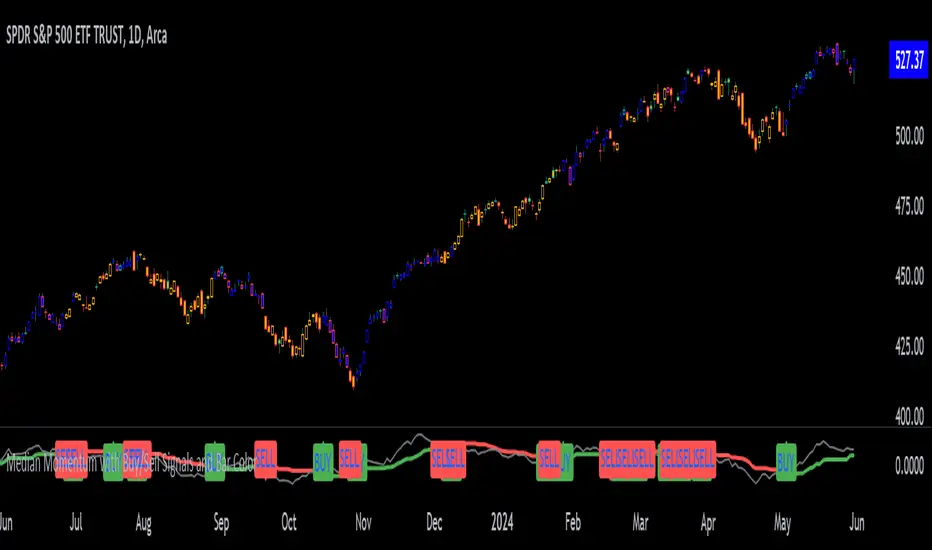
Median Momentum with Buy/Sell Signals and Bar ColorMomentum Calculation:
Momentum is calculated as the difference between the current close price and the close price momentum_length periods ago: momentum = close - close .
Highest and Lowest Momentum:
The highest and lowest momentum values over the specified length are calculated.
Median Momentum:
The median momentum is calculated as the average of the highest and lowest momentum values.
Color Setting:
medianColor is set based on whether the momentum is above, below, or equal to the median momentum.
barColor is set similarly for bar coloring.
Plotting:
The script plots the median momentum and the actual momentum values.
Buy and sell signals are generated when momentum crosses over or under the median momentum.
The script also plots the buy and sell signals with arrows on the chart.
MomentumLibrary "Momentum"
Contains utilities varying algorithms for measuring momentum.
simple(fast, slow, src, fastType, slowType) Derives momentum from two moving averages of different lengths.
Parameters:
fast : The length of the fast moving average.
slow : The length of the slow moving average.
src : The series to measure from. Default is 'close'.
fastType : The type of moving average the fast should use. Values allowed are: SMA, EMA, WMA, VWMA and VAWMA.
slowType : The type of moving average the slow should use. Values allowed are: SMA, EMA, WMA, VWMA and VAWMA.
stochRSI(fast, fast, rsiLen, stochLen, src, kmode) Returns the K and D values of a Stochastic RSI. Allows for different moving averages to produce the K value.
Parameters:
fast : The length to average the stochastic.
fast : The length to smooth out K and produce D.
rsiLen : The length of the RSI.
stochLen : The length of stochastic.
src : The series to measure from. Default is 'close'.
kmode : The type of moving average to generate. Values allowed are: SMA, EMA, WMA, VWMA and VAWMA.
Returns:
macd(fast, slow, signal, src, fastType, slowType, slowType) Same as well-known MACD formula but allows for different moving averages types to be used.
Parameters:
fast : The length of the fast moving average.
slow : The length of the slow moving average.
signal : The length of average to applied to smooth out the signal.
src : The series to measure from. Default is 'close'.
fastType : The type of moving average the fast should use. Values allowed are: SMA, EMA, WMA, VWMA and VAWMA.
slowType : The type of moving average the slow should use. Values allowed are: SMA, EMA, WMA, VWMA and VAWMA.
slowType : The type of moving average the signal should use. Values allowed are: SMA, EMA, WMA, VWMA and VAWMA.
Returns:

GRJMOM - Risk-Adjusted MomentumGRJMOM – Risk-Adjusted Momentum
GRJMOM stands for Generalized Risk-Adjusted Momentum. This indicator adjusts traditional momentum by dividing it by realized volatility over the same formation period. The result is a cleaner, more risk-sensitive momentum signal designed to avoid momentum crashes and volatility-driven false breakouts.
How it works:
Calculates raw momentum: Close - Close
Computes realized volatility using standard deviation of log returns
Outputs a risk-adjusted momentum score (Momentum / Volatility)
Optional smoothing can be applied to reduce short-term noise
Background coloring highlights bullish (green) and bearish (red) regimes
Use Cases:
GRJMOM > 0 suggests a bullish risk-adjusted trend
GRJMOM < 0 indicates a weakening or bearish trend
Can be used as a trend confirmation filter
Pairs well with cycle indicators like HHT or FFT for timing
Best for:
Swing traders, trend followers, and systematic strategy builders looking for smarter momentum signals with built-in risk awareness
Adaptive Z-Momentum (AZM) [Blk0ut]Adaptive Z-Momentum (AZM) is a momentum indicator that expresses the normalized deviation of price from a dynamic anchor (VWAP or EMA) in standard-score (z-score) terms, with adaptive “extreme” thresholds, trend sensitivity, and optional regime filtering. The line color, background shading, and labels help you visually discern when momentum is mild, building, or overextended.
---
## Features & Concept
* Computes **z = (price – anchor) / σ**, where the anchor is either Session VWAP (intraday) or EMA (non-intraday).
* Uses exponential moving averages (EWMA) to adaptively estimate the running mean and variance, making the indicator responsive to regime changes.
* Defines an **adaptive extreme threshold** (±z threshold) based on the chosen percentile of |z| over a lookback window (e.g. 90th percentile) — dynamically adjusting to volatility environment.
* Colors the main z-line **differently when inside vs. outside the extreme thresholds**, giving immediate visual feedback.
* Optionally shades the background when momentum is over the extremes (bullish or bearish).
* Supports a **self-tuning mode** (ADX-aware) that tightens or relaxes lookback/smoothing in strong trend vs. chop regimes.
* Regime filtering options (EMA slope or ADX threshold) let you filter signals in trend vs. non-trend markets.
* Plots Δz (the change in z) in various styles to help detect acceleration or deceleration in momentum.
* Adds optional thrust/fade labels to highlight when z crosses ±extreme zones, or when momentum stalls.
---
## How to Use
* Look for **z crossing** above zero (bullish momentum) or below zero (bearish momentum).
* When **z enters the extreme band**, it suggests strong momentum; when it exits, that may indicate exhaustion or reversal.
* Watch **Δz** (momentum acceleration) for clues of weakening or strengthening momentum before z itself reacts.
* Use the **regime filter** to enforce that signals only count in favorable directional markets.
* Customize inputs: lookback window, smoothing length, extreme percentile, ADX/auto settings, colors, etc., to match your trading style and timeframe.
*Use VWAP as the anchor on intraday/session charts — because it resets each session, it highlights deviations from session “fair value” and captures volume-flow bias.
*Use EMA on swing or multi-day charts — it doesn’t reset, so it preserves trend structure and gives a smoother momentum baseline across sessions.
*In trending markets, EMA tends to deliver more reliable momentum extremes; in range or mean-reversion regimes, VWAP often gives more intuitive reversal zones.
---
## Limitations & Disclaimers
* Like all indicators, AZM is **lagging** (though adaptive) and should not be used as a standalone entry/exit trigger — always combine with price action, structure, or confirmation.
* The extreme thresholds are **percentile-based**, meaning in very quiet or very noisy periods, “extreme” may shift rapidly; use your eyes alongside the indicator.
* Because the script uses historical data and smoothing, earlier bars may differ from real-time behavior.
* Past behavior is no guarantee of future performance. Use proper risk management and test ideas on historical data before trading live.
---
## Inputs & Customization
* **Anchor** mode: Session VWAP (intraday) or EMA
* **Lookback window** and **smoothing EMA** for computing z
* **Extreme percentile** (e.g. 90) to define ±z thresholds
* **Auto / ADX-based tuning** to allow dynamic parameter changes in trending vs chop markets
* **Regime filter** (EMA slope or ADX) to restrict signals to trending conditions
* **Color settings** for inside vs outside extremes, background shading, zero line, Δz style, labels, etc.
* **Show/hide labels**, choose Δz style (columns, histogram, line, etc.)
---
## Why It’s Useful
By combining standard-score normalization with adaptive thresholds and regime sensitivity, AZM helps you see **relative momentum extremes** in a way that adjusts to market regime shifts. The dual visual cues (line color + background) reduce ambiguity at a glance.
---
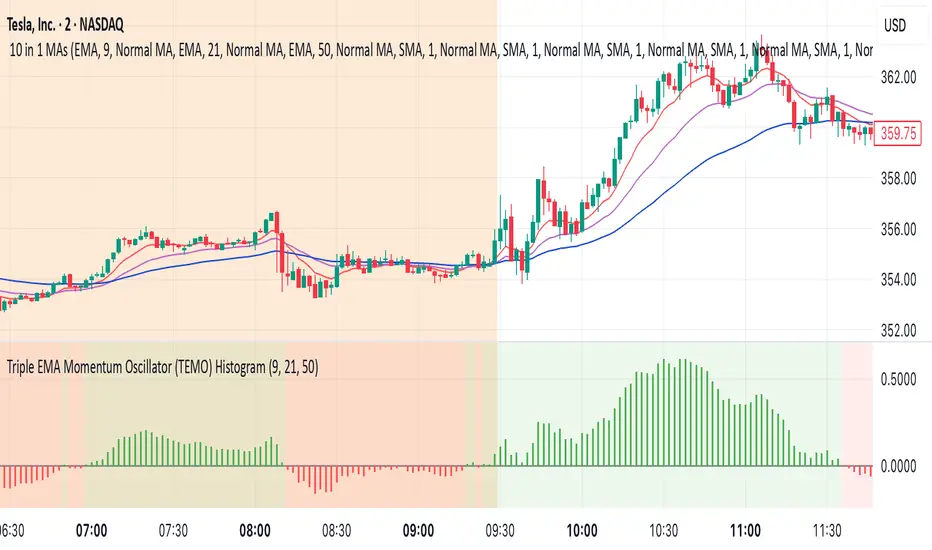
Triple EMA Momentum Oscillator (TEMO) HistogramThis Pine Script code replicates the Python indicator you provided, calculating the Triple EMA Momentum Oscillator (TEMO) and generating signals based on its value and momentum.
Explanation of the Code:
User Inputs:
Allows you to adjust the periods for the short, mid, and long EMAs.
Calculate EMAs:
Computes the Exponential Moving Averages for the specified periods.
Calculate EMA Spreads (Distances):
Finds the differences between the EMAs to understand the spread between them.
Calculate Spread Velocities:
Determines the change in spreads from the previous period, indicating momentum.
Composite Strength Score:
Weighted calculation of the spreads normalized by the EMA values.
Velocity Accelerator:
Weighted calculation of the velocities normalized by the EMA values.
Final TEMO Oscillator:
Combines the spread strength and velocity accelerator to create the TEMO.
Generate Signals:
Signals are generated when TEMO is positive and increasing (buy), or negative and decreasing (sell).
Plotting:
Zero Line: Helps visualize when TEMO crosses from positive to negative.
TEMO Oscillator: Plotted with green for positive values and red for negative values.
Signals: Displayed as a histogram to indicate buy (1) and sell (-1) signals.
Usage:
Buy Signal: When TEMO is above zero and increasing.
Sell Signal: When TEMO is below zero and decreasing.
Note: This oscillator helps identify momentum changes based on EMAs of different periods. It's useful for detecting trends and potential reversal points in the market.