Zero Lag Trend Signals (MTF) [Quant Trading] V7Overview
The Zero Lag Trend Signals (MTF) V7 is a comprehensive trend-following strategy that combines Zero Lag Exponential Moving Average (ZLEMA) with volatility-based bands to identify high-probability trade entries and exits. This strategy is designed to reduce lag inherent in traditional moving averages while incorporating dynamic risk management through ATR-based stops and multiple exit mechanisms.
This is a longer term horizon strategy that takes limited trades. It is not a high frequency trading and therefore will also have limited data and not > 100 trades.
How It Works
Core Signal Generation:
The strategy uses a Zero Lag EMA (ZLEMA) calculated by applying an EMA to price data that has been adjusted for lag:
Calculate lag period: floor((length - 1) / 2)
Apply lag correction: src + (src - src )
Calculate ZLEMA: EMA of lag-corrected price
Volatility bands are created using the highest ATR over a lookback period multiplied by a band multiplier. These bands are added to and subtracted from the ZLEMA line to create upper and lower boundaries.
Trend Detection:
The strategy maintains a trend variable that switches between bullish (1) and bearish (-1):
Long Signal: Triggers when price crosses above ZLEMA + volatility band
Short Signal: Triggers when price crosses below ZLEMA - volatility band
Optional ZLEMA Trend Confirmation:
When enabled, this filter requires ZLEMA to show directional momentum before entry:
Bullish Confirmation: ZLEMA must increase for 4 consecutive bars
Bearish Confirmation: ZLEMA must decrease for 4 consecutive bars
This additional filter helps avoid false signals in choppy or ranging markets.
Risk Management Features:
The strategy includes multiple stop-loss and take-profit mechanisms:
Volatility-Based Stops: Default stop-loss is placed at ZLEMA ± volatility band
ATR-Based Stops: Dynamic stop-loss calculated as entry price ± (ATR × multiplier)
ATR Trailing Stop: Ratcheting stop-loss that follows price but never moves against position
Risk-Reward Profit Target: Take-profit level set as a multiple of stop distance
Break-Even Stop: Moves stop to entry price after reaching specified R:R ratio
Trend-Based Exit: Closes position when price crosses EMA in opposite direction
Performance Tracking:
The strategy includes optional features for monitoring and analyzing trades:
Floating Statistics Table: Displays key metrics including win rate, GOA (Gain on Account), net P&L, and max drawdown
Trade Log Labels: Shows entry/exit prices, P&L, bars held, and exit reason for each closed trade
CSV Export Fields: Outputs trade data for external analysis
Default Strategy Settings
Commission & Slippage:
Commission: 0.1% per trade
Slippage: 3 ticks
Initial Capital: $1,000
Position Size: 100% of equity per trade
Main Calculation Parameters:
Length: 70 (range: 70-7000) - Controls ZLEMA calculation period
Band Multiplier: 1.2 - Adjusts width of volatility bands
Entry Conditions (All Disabled by Default):
Use ZLEMA Trend Confirmation: OFF - Requires ZLEMA directional momentum
Re-Enter on Long Trend: OFF - Allows multiple entries during sustained trends
Short Trades:
Allow Short Trades: OFF - Strategy is long-only by default
Performance Settings (All Disabled by Default):
Use Profit Target: OFF
Profit Target Risk-Reward Ratio: 2.0 (when enabled)
Dynamic TP/SL (All Disabled by Default):
Use ATR-Based Stop-Loss & Take-Profit: OFF
ATR Length: 14
Stop-Loss ATR Multiplier: 1.5
Profit Target ATR Multiplier: 2.5
Use ATR Trailing Stop: OFF
Trailing Stop ATR Multiplier: 1.5
Use Break-Even Stop-Loss: OFF
Move SL to Break-Even After RR: 1.5
Use Trend-Based Take Profit: OFF
EMA Exit Length: 9
Trade Data Display (All Disabled by Default):
Show Floating Stats Table: OFF
Show Trade Log Labels: OFF
Enable CSV Export: OFF
Trade Label Vertical Offset: 0.5
Backtesting Date Range:
Start Date: January 1, 2018
End Date: December 31, 2069
Important Usage Notes
Default Configuration: The strategy operates in its most basic form with default settings - using only ZLEMA crossovers with volatility bands and volatility-based stop-losses. All advanced features must be manually enabled.
Stop-Loss Priority: If multiple stop-loss methods are enabled simultaneously, the strategy will use whichever condition is hit first. ATR-based stops override volatility-based stops when enabled.
Long-Only by Default: Short trading is disabled by default. Enable "Allow Short Trades" to trade both directions.
Performance Monitoring: Enable the floating stats table and trade log labels to visualize strategy performance during backtesting.
Exit Mechanisms: The strategy can exit trades through multiple methods: stop-loss hit, take-profit reached, trend reversal, or trailing stop activation. The trade log identifies which exit method was used.
Re-Entry Logic: When "Re-Enter on Long Trend" is enabled with ZLEMA trend confirmation, the strategy can take multiple long positions during extended uptrends as long as all entry conditions remain valid.
Capital Efficiency: Default setting uses 100% of equity per trade. Adjust "default_qty_value" to manage position sizing based on risk tolerance.
Realistic Backtesting: Strategy includes commission (0.1%) and slippage (3 ticks) to provide realistic performance expectations. These values should be adjusted based on your broker and market conditions.
Recommended Use Cases
Trending Markets: Best suited for markets with clear directional moves where trend-following strategies excel
Medium to Long-Term Trading: The default length of 70 makes this strategy more appropriate for swing trading rather than scalping
Risk-Conscious Traders: Multiple stop-loss options allow traders to customize risk management to their comfort level
Backtesting & Optimization: Comprehensive performance tracking features make this strategy ideal for testing different parameter combinations
Limitations & Considerations
Like all trend-following strategies, performance may suffer in choppy or ranging markets
Default 100% position sizing means full capital exposure per trade - consider reducing for conservative risk management
Higher length values (70+) reduce signal frequency but may improve signal quality
Multiple simultaneous risk management features may create conflicting exit signals
Past performance shown in backtests does not guarantee future results
Customization Tips
For more aggressive trading:
Reduce length parameter (minimum 70)
Decrease band multiplier for tighter bands
Enable short trades
Use lower profit target R:R ratios
For more conservative trading:
Increase length parameter
Enable ZLEMA trend confirmation
Use wider ATR stop-loss multipliers
Enable break-even stop-loss
Reduce position size from 100% default
For optimal choppy market performance:
Enable ZLEMA trend confirmation
Increase band multiplier
Use tighter profit targets
Avoid re-entry on trend continuation
Visual Elements
The strategy plots several elements on the chart:
ZLEMA line (color-coded by trend direction)
Upper and lower volatility bands
Long entry markers (green triangles)
Short entry markers (red triangles, when enabled)
Stop-loss levels (when positions are open)
Take-profit levels (when enabled and positions are open)
Trailing stop lines (when enabled and positions are open)
Optional ZLEMA trend markers (triangles at highs/lows)
Optional trade log labels showing complete trade information
Exit Reason Codes (for CSV Export)
When CSV export is enabled, exit reasons are coded as:
0 = Manual/Other
1 = Trailing Stop-Loss
2 = Profit Target
3 = ATR Stop-Loss
4 = Trend Change
Conclusion
Zero Lag Trend Signals V7 provides a robust framework for trend-following with extensive customization options. The strategy balances simplicity in its core logic with sophisticated risk management features, making it suitable for both beginner and advanced traders. By reducing moving average lag while incorporating volatility-based signals, it aims to capture trends earlier while managing risk through multiple configurable exit mechanisms.
The modular design allows traders to start with basic trend-following and progressively add complexity through ZLEMA confirmation, multiple stop-loss methods, and advanced exit strategies. Comprehensive performance tracking and export capabilities make this strategy an excellent tool for systematic testing and optimization.
Note: This strategy is provided for educational and backtesting purposes. All trading involves risk. Past performance does not guarantee future results. Always test thoroughly with paper trading before risking real capital, and adjust position sizing and risk parameters according to your risk tolerance and account size.
================================================================================
TAGS:
================================================================================
trend following, ZLEMA, zero lag, volatility bands, ATR stops, risk management, swing trading, momentum, trend confirmation, backtesting
================================================================================
CATEGORY:
================================================================================
Strategies
================================================================================
CHART SETUP RECOMMENDATIONS:
================================================================================
For optimal visualization when publishing:
Use a clean chart with no other indicators overlaid
Select a timeframe that shows multiple trade signals (4H or Daily recommended)
Choose a trending asset (crypto, forex major pairs, or trending stocks work well)
Show at least 6-12 months of data to demonstrate strategy across different market conditions
Enable the floating stats table to display key performance metrics
Ensure all indicator lines (ZLEMA, bands, stops) are clearly visible
Use the default chart type (candlesticks) - avoid Heikin Ashi, Renko, etc.
Make sure symbol information and timeframe are clearly visible
================================================================================
COMPLIANCE NOTES:
================================================================================
✅ Open-source publication with complete code visibility
✅ English-only title and description
✅ Detailed explanation of methodology and calculations
✅ Realistic commission (0.1%) and slippage (3 ticks) included
✅ All default parameters clearly documented
✅ Performance limitations and risks disclosed
✅ No unrealistic claims about performance
✅ No guaranteed results promised
✅ Appropriate for public library (original trend-following implementation with ZLEMA)
✅ Educational disclaimers included
✅ All features explained in detail
================================================================================
Cerca negli script per "momentum"

BankNifty Etharia Aggresive Buyer / SellerOverview
Professional intraday trading strategy for BankNifty Futures that identifies high-probability setups by combining multiple technical indicators. Works in BOTH directions - LONG and SHORT.
Best Timeframe: 5-Minute Chart
Key Features:
✅ Multi-Confluence Entry System - All indicators must align for signal
✅ Bidirectional Trading - Captures both uptrends and downtrends
✅ Advanced Risk Management - Daily loss limits, consecutive loss protection
✅ Smart Exit System - Partial profit taking + trailing stops
✅ Session-Based Trading - Avoids opening and closing volatility
Entry Logic:
LONG Signals:
Price above Kernel Regression (trend confirmation)
Price above VWAP with positive slope (momentum)
Cumulative Volume Delta bullish (buying pressure)
Volume spike or increasing volume (strength confirmation)
Strong bullish candle with 60%+ body ratio
RSI filter to avoid overbought entries
SHORT Signals:
Price below Kernel Regression (downtrend confirmation)
Price below VWAP with negative slope (bearish momentum)
CVD bearish (selling pressure dominates)
High volume confirmation
Strong bearish candle pattern
RSI filter to avoid oversold entries
Exit Management:
🎯 Target 1: 1.5 R:R (50% position exit)
🎯 Target 2: 2.5 R:R (full exit)
🛡️ Stop Loss Options: ATR-based, Swing-based, or Fixed
🟡 Trailing Stop: Activates after 1.2 R:R, trails at 0.8 R:R
⏰ Time-Based Exit: Closes all positions 5 mins before session end
Risk Controls:
Maximum trades per day (default: 5)
Consecutive loss limit (default: 2)
Daily loss limit: 2.5% of capital
Daily profit target: 5% (stops trading when reached)
Position sizing based on account risk percentage
Recommended Settings:
Asset: BankNifty Futures (NSE:BANKNIFTY1!)
Timeframe: 5-minute
Initial Capital: ₹1,00,000
Risk per trade: 1%
Commission: 0.05%
Slippage: 5 points
Performance Expectations:
Win Rate: 55-65%
Profit Factor: 1.5-2.0
Average Trades/Day: 3-8
Risk:Reward: 1:1.8 average
Customizable Parameters:
Trading direction (Long Only / Short Only / Both)
Indicator lengths and thresholds
Stop loss type and targets
Risk management limits
Trading session hours
Best For:
Intraday traders seeking systematic, rule-based entries with strong confluence, proper risk management, and the ability to profit from both bullish and bearish market conditions.

Adaptive Trend 1m ### Overview
The "Adaptive Trend Impulse Parallel SL/TP 1m Realistic" strategy is a sophisticated trading system designed specifically for high-volatility markets like cryptocurrencies on 1-minute timeframes. It combines trend-following with momentum filters and adaptive parameters to dynamically adjust to market conditions, ensuring more reliable entries and risk management. This strategy uses SuperTrend for primary trend detection, enhanced by MACD, RSI, Bollinger Bands, and optional volume spikes. It incorporates parallel stop-loss (SL) and multiple take-profit (TP) levels based on ATR, with options for breakeven and trailing stops after the first TP. Optimized for realistic backtesting on short timeframes, it avoids over-optimization by adapting indicators to market speed and efficiency.
### Principles of Operation
The strategy operates on the principle of adaptive impulse trading, where entry signals are generated only when multiple conditions align to confirm a strong trend reversal or continuation:
1. **Trend Detection (SuperTrend)**: The core signal comes from an adaptive SuperTrend indicator. It calculates upper and lower bands using ATR (Average True Range) with dynamic periods and multipliers. A buy signal occurs when the price crosses above the lower band (from a downtrend), and a sell signal when it crosses below the upper band (from an uptrend). Adaptation is based on Rate of Change (ROC) to measure market speed, shortening periods in fast markets for quicker responses.
2. **Momentum and Trend Filters**:
- **MACD**: Uses adaptive fast and slow lengths. In "Trend Filter" mode (default when "Use MACD Cross" is false), it checks if the MACD line is above/below the signal for long/short. In cross mode, it requires a crossover/crossunder.
- **RSI**: Adaptive period RSI must be above 50 for longs and below 50 for shorts, confirming overbought/oversold conditions dynamically.
- **Bollinger Bands (BB)**: Depending on the mode ("Midline" by default), it requires the price to be above/below the BB midline for longs/shorts, or a breakout in "Breakout" mode. Deviation adapts to market efficiency.
- **Volume Spike Filter** (optional): Entries require volume to exceed an adaptive multiple of its SMA, signaling strong impulse.
3. **Volatility Filter**: Entries are only allowed if current ATR percentage exceeds a historical minimum (adaptive), preventing trades in low-volatility ranges.
4. **Risk Management (Parallel SL/TP)**:
- **Stop-Loss**: Set at an adaptive ATR multiple below/above entry for long/short.
- **Take-Profits**: Three levels at adaptive ATR multiples, with partial position closures (e.g., 51% at TP1, 25% at TP2, remainder at TP3).
- **Post-TP1 Features**: Optional breakeven moves SL to entry after TP1. Trailing SL uses BB midline as a dynamic trail.
- All levels are calculated per trade using the ATR at entry, making them "realistic" for 1m charts by widening SL and tightening initial TPs.
The strategy enters long on buy signals with all filters met, and short on sell signals. It uses pyramid margin (100% long/short) for full position sizing.
Adaptation is driven by:
- **Market Speed (normSpeed)**: Based on ROC, tightens multipliers in volatile periods.
- **Efficiency Ratio (ER)**: Measures trend strength, adjusting periods for trending vs. ranging markets.
This ensures the strategy "adapts" without manual tweaks, reducing false signals in varying conditions.
### Main Advantages
- **Adaptability**: Unlike static strategies, parameters dynamically adjust to market volatility and trend strength, improving performance across ranging and trending phases without over-optimization.
- **Realistic Risk Management for 1m**: Wider SL and tiered TPs prevent premature stops in noisy short-term charts, while partial profits lock in gains early. Breakeven/trailing options protect profits in extended moves.
- **Multi-Filter Confirmation**: Combines trend, momentum, and volume for high-probability entries, reducing whipsaws. The volatility filter avoids flat markets.
- **Debug Visualization**: Built-in plots for signals, levels, and component checks (when "Show Debug" is enabled) help users verify logic on charts.
- **Efficiency**: Low computational load, suitable for real-time trading on TradingView with alerts.
Backtesting shows robust results on volatile assets, with a focus on sustainable risk (e.g., SL at 3x ATR avoids excessive drawdowns).
### Uniqueness
What sets this strategy apart is its **fully adaptive framework** integrating multiple indicators with real-time market metrics (ROC for speed, ER for efficiency). Most trend strategies use fixed parameters, leading to poor adaptation; here, every key input (periods, multipliers, deviations) scales dynamically within bounds, creating a "self-tuning" system. The "parallel SL/TP with 1m realism" adds custom handling for micro-timeframes: tightened initial TPs for quick wins and adaptive min-ATR filter to skip low-vol bars. Unlike generic mashups, it justifies the combination—SuperTrend for trend, MACD/RSI/BB for impulse confirmation, volume for conviction—working synergistically to capture "trend impulses" while filtering noise. The post-TP1 breakeven/trailing tied to BB adds a unique profit-locking mechanism not common in open-source scripts.
### Recommended Settings
These settings are optimized and recommended for trading ASTER/USDT on Bybit, with 1-minute chart, x10 leverage, and cross margin mode. They provide a balanced risk-reward for this volatile pair:
- **Base Inputs**:
- Base ATR Period: 10
- Base SuperTrend ATR Multiplier: 2.5
- Base MACD Fast: 8
- Base MACD Slow: 17
- Base MACD Signal: 6
- Base RSI Period: 9
- Base Bollinger Period: 12
- Bollinger Deviation: 1.8
- Base Volume SMA Period: 19
- Base Volume Spike Multiplier: 1.8
- Adaptation Window: 54
- ROC Length: 10
- **TP/SL Settings**:
- Use Stop Loss: True
- Base SL Multiplier (ATR): 3
- Use Take Profits: True
- Base TP1 Multiplier (ATR): 5.5
- Base TP2 Multiplier (ATR): 10.5
- Base TP3 Multiplier (ATR): 19
- TP1 % Position: 51
- TP2 % Position: 25
- Breakeven after TP1: False
- Trailing SL after TP1: False
- Base Min ATR Filter: 0.001
- Use Volume Spike Filter: True
- BB Condition: Midline
- Use MACD Cross (false=Trend Filter): True
- Show Debug: True
For backtesting, use initial capital of 30 USD, base currency USDT, order size 100 USDT, pyramiding 1, commission 0.1%, slippage 0 ticks, long/short margin 0%.
Always backtest on your platform and use risk management—risk no more than 1-2% per trade. This is not financial advice; trade at your own risk.

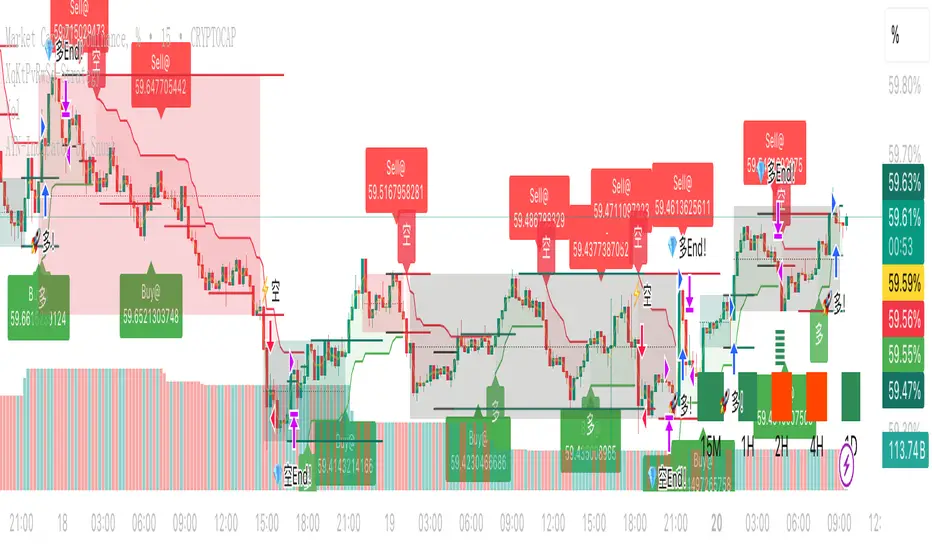
XqKtPvRwSd-StrategyTradingView Pine Script Suite (v4.0) — General Overview
Purpose
A modular indicator and strategy suite designed for crypto markets, focusing on trend detection, momentum, range visualization, and signal generation. The suite supports popular symbols (BTC, ETH, BNB, SOL, DOGE) and offers flexible visualization and alert options.
Main Components
- v4.0-indicator: Multi-signal display for monitoring market conditions and trend bias.
- v4.0-watch-15m: Watchlist-style indicator with symbol-aware auto-tuning and optional chart timeframe adaptation.
- v4.0-strategy: Backtestable strategy using a unified, SuperTrend-based trend determination for entries/exits.
- v4.0-range: Range and structure visualization with dynamic lines, zones, and basic breakout cues.
- Two Poles.pinescript and fengzi/Two Poles Trend: Low-lag trend and smoothing filters for stability.
- supertrend.pinescript: SuperTrend variations used across the suite for direction and stops.
- fengzi utilities:
- Hann Window FIR Filter: Denoising and smoothing to reduce noise without excessive lag.
- Heatmap + Hann Resonance: Visual heat/energy mapping for momentum and resonance cues.
- Heatmap Trailing Stop with Breakouts: Trailing stop framework with breakout detection.
- Additional modules: super Z, AI JX, v3.2, and 4.0.pinescript (combined or experimental entries).
Key Features
- Unified Trend Logic: Strategy and visual components rely on a consistent SuperTrend-based direction model, improving clarity and consistency.
- Adaptive Timeframe: Option to use the chart’s timeframe; parameters scale from a 15m baseline to maintain relative behavior.
- Symbol Auto-Tuning: Default parameter sets are tailored for common crypto symbols; manual overrides are available.
- RSI Top/Bottom Hints: Optional dynamic cues for potential peaks in uptrends and troughs in downtrends; can contribute to scoring and alerts.
- Visual Customization: Configurable markers (arrows, dots, crosses), colors, line widths, and subtle background highlighting.
- Scoring and Clustering: Combines checks into a simplified score and clusters signals to reduce noise.
- Alerts: Supports TradingView alerts for entries, exits, and RSI hints.
- Compatibility: Designed to compile across common Pine versions and avoid local-scope plotting issues.
Basic Usage
- Add the indicator or strategy to your chart depending on your goal (monitoring vs. backtesting).
- Choose to follow the chart’s timeframe or set a working timeframe manually.
- Keep symbol auto-tuning enabled for a balanced default, or adjust parameters to match your preferences.
- Toggle optional modules (RSI hints, scoring contribution, visualization) based on your needs.
- For strategies, run backtests across your target period and review performance metrics (win rate, drawdown, and trade frequency).
Configuration Guidelines
- For earlier entries: lower SuperTrend period or multiplier; relax RSI thresholds.
- For more conservative behavior: increase SuperTrend period or multiplier; tighten thresholds; use stricter RSI logic.
- For cleaner signals: rely on the unified trend and consider limiting trades during extreme volatility or illiquid sessions.
Outputs
- Trend markers and lines indicating bullish/bearish bias and reversals.
- Range drawings with dynamic line coordinates, zones, and visual cues for consolidations and breakouts.
- Optional multi-timeframe dashboard-style summaries where applicable.
Extensibility
- Parameters and defaults can be extended for additional symbols and styles.
- Optional weighting or neutrality rules can be added to trend logic if you prefer stricter confirmation.
- Additional filters (volatility, session, volume) can be integrated to refine entries and exits.
Notes
- Not financial advice; backtest thoroughly before using any strategy live.
- Performance and signal quality vary by symbol, timeframe, and market conditions; adjust parameters as needed.
- Pine version differences may require minor adjustments; keep your environment up to date.
Sniper Algo TradingThis indicator analyzes market momentum and trend shifts using advanced multi-timeframe algorithms. It helps visualize potential reversals, continuations, and momentum flips with clear, intuitive signals designed for experienced traders.
Built for precision and adaptability — suitable for crypto, forex, and indices.
Note: For educational use only. Not financial advice.

MTF MACD + Accelerator Oscillator Strategy ※日本語説明は英文の下にあります。
Concept:
This is a multi-timeframe trend-following strategy that combines:
Higher timeframe MACD → determines the major trend direction.
Lower timeframe Accelerator Oscillator (AC) → identifies acceleration in momentum for optimal entry timing.
The strategy enters trades in the direction of the higher timeframe trend when the AC shows a momentum acceleration.
Entry Rules:
Long (Buy):
Higher timeframe MACD line > signal line (uptrend)
AC crosses above zero line on the lower timeframe
Short (Sell):
Higher timeframe MACD line < signal line (downtrend)
AC crosses below zero line on the lower timeframe
Exit Rules:
Take Profit: ATR(14) * 1.5 (configurable)
Stop Loss: ATR(14) * 1.0 (configurable)
Exit on opposite signal or if TP/SL is hit
Plotting:
AC is plotted on the chart (green for positive, red for negative)
Buy/Sell signals are marked with small triangles below/above bars
Customization:
Timeframe, MACD parameters, ATR multipliers can be adjusted in the input settings.
Works for scalping, day trading, or swing trading on various instruments.
---------------------------------------------------------------------
コンセプト:
この戦略はマルチタイムフレームのトレンドフォロー型で、以下を組み合わせています:
上位足MACD → 大きなトレンド方向を確認
下位足Accelerator Oscillator(AC) → モメンタム加速のタイミングを捉え、最適なエントリーを判断
上位足のトレンド方向に沿って、下位足でACが勢いの加速を示したタイミングでエントリーします。
エントリールール:
ロング(買い):
上位足MACDライン > シグナルライン(上昇トレンド)
下位足ACが0ラインを上抜け
ショート(売り):
上位足MACDライン < シグナルライン(下降トレンド)
下位足ACが0ラインを下抜け
エグジットルール:
利確:ATR(14) * 1.5(設定可能)
損切り:ATR(14) * 1.0(設定可能)
逆シグナル発生時やTP/SL到達時にも決済
チャート表示:
ACはチャート上にプロット(正なら緑、負なら赤)
買い/売りシグナルはバーの下/上に小さな三角で表示
カスタマイズ:
時間足、MACDパラメータ、ATR倍率は入力設定で変更可能
スキャルピング、デイトレード、スイングトレードなど幅広く利用可能

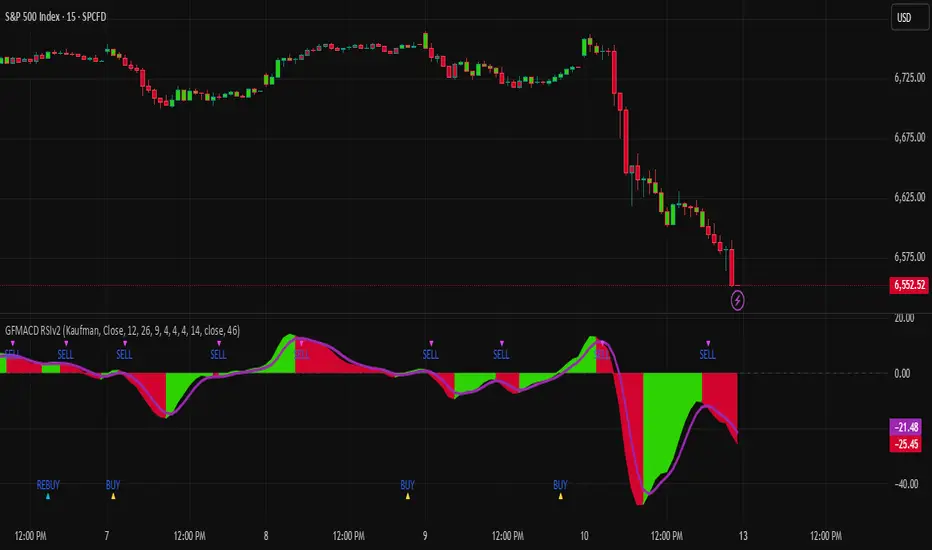
Gaussian MACD RSI v2Gaussian Filter MACD Strategy (Zero Cross + RSI Gate)
What it does
This strategy evaluates momentum using a Gaussian-smoothed MACD and requires a MACD zero-line cross to confirm trend initiation. A configurable RSI threshold filters weak signals, aiming to reduce whipsaws around the zero line. Entries occur only when momentum and baseline strength agree; exits are triggered by MACD crossing below its signal to capture the meat of the move while avoiding discretionary overrides.
How it works (concepts, not code)
Gaussian MACD: The fast/slow components are smoothed with a Gaussian-style filter to reduce noise relative to standard EMA MACD.
Zero-line confirmation: Longs require MACD to cross above zero, aligning entries with positive momentum regimes.
RSI gate: A threshold (default 50) further filters entries so that only setups with baseline strength qualify.
Exit logic: Positions close when MACD crosses below its signal line, providing an objective exit without trailing logic.
Sources: The script supports standard and Heikin-Ashi-derived sources for traders who prefer alternate preprocessing.
How to use it
Add the strategy to a clean chart.
Keep default settings for initial testing; then adjust the RSI threshold and symbol/timeframe for your market.
Favor liquid instruments where slippage and fills are reliable.
Forward-test and walk-forward before any live use.
Default Properties (used for this publication)
Initial Capital: $25,000
Order Size: 100% of equity per trade (no leverage).
Commission: 0.02% per side.
Slippage: 2 ticks (or 0.02% on percent-based markets).
Timeframe used for the published chart: 15-minute (example)
Dataset: SPY/QQQ/large-cap equities (2+ years) producing 100+ trades in sample.
Note: This strategy does not use hard stops by default. If you prefer risk caps ≤ 5–10% per trade, add a stop in the Inputs and re-publish; otherwise, this description explains the deviation per House Rules.
Disclosures
Backtest results are estimates; real-world fills, slippage, and availability may differ. No guarantee of performance. Use prudent position sizing and independent verification.
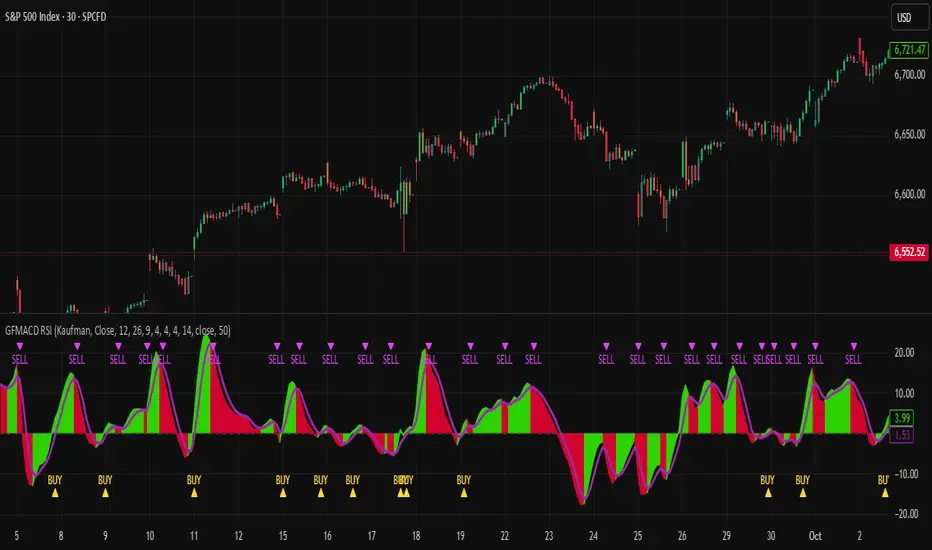
MAUL RSI Gaussian Filter MACD Gaussian Filter MACD — Strategy (with RSI Gate)
A momentum-first, chop-aware strategy built on a Gaussian-smoothed MACD with an optional RSI threshold filter. It looks for clean transitions in trend and ignores half-hearted wiggles around the zero line. You choose how signals are confirmed and whether shorts are allowed—no clutter, just deliberate entries and exits.
What it does (at a glance)
Confirms momentum using a smoothed MACD and a selectable signal mode.
Optional RSI gate to avoid low-quality breakouts.
Flexible source options (incl. Heikin-Ashi families) to match your charting style.
Long-only by default; shorts are an option.
Built-in alerts for entries/exits.
How to use
Add to chart and select your preferred signal mode.
Toggle the RSI gate and set your threshold to filter weak setups.
Forward-test across symbols/timeframes; then walk it into live with conservative sizing.
Notes
The parameters and internals are intentionally locked to protect IP and avoid over-fitting by casual copycats.
Works best on liquid symbols with consistent session structure.
Risk
Backtests are not a promise. Markets are noisy, slippage is real, and capital at risk should be sized accordingly. Use with sound risk management and a clear exit plan.
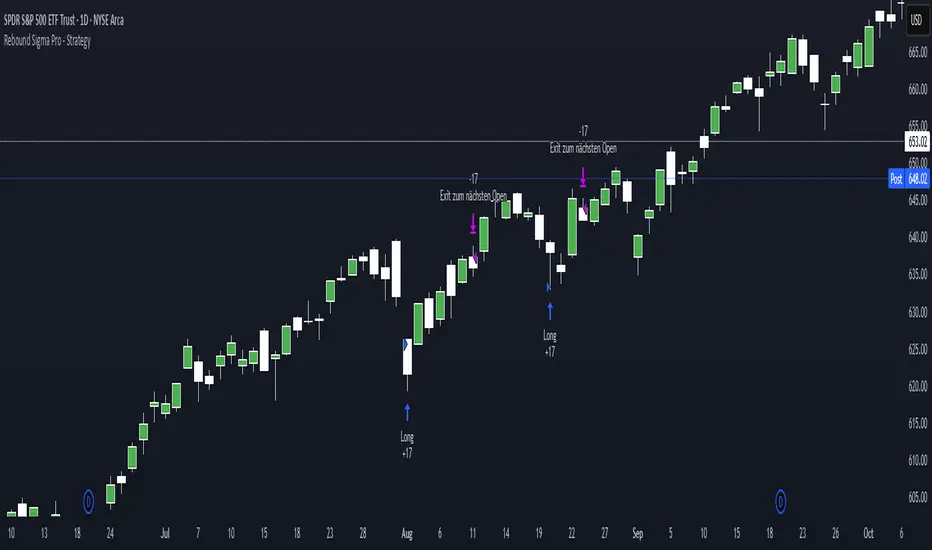
Rebound Sigma Pro - StrategyOverview
Rebound Sigma Pro is a mean-reversion indicator that detects statistically oversold conditions in trending markets.
It helps traders identify potential short-term rebounds based on momentum exhaustion and volatility-adjusted entry zones.
Concept
The indicator combines two quantitative components:
Short-term momentum to detect short-term exhaustion
Trend filter to ensure setups align with the long-term direction
When a stock in an uptrend becomes temporarily oversold, a limit-entry signal is plotted.
The trade is then tracked until short-term conditions normalize or a time-based exit occurs.
Visual Signals
Green Triangle: Suggests placing a limit order for the next session
Green Circle: Confirms entry was filled
Red Triangle: Signals an exit for the next session’s open
Orange Background: Pending order
Green Background: Position active
Red Background: Exit phase
Yellow Line: Entry reference price
User Inputs
Limit Entry (% below previous close) – Default 1 %
Use Limit Entry – Switch between limit or market entries
Enable Time Exit – Optional holding-period constraint
Maximum Holding Days
All other internal parameters (momentum length, filters) are pre-configured.
Alerts
Limit Order Signal: New setup detected
Entry Confirmed: Order filled
Exit Signal: Exit expected next day
Usage
Designed for liquid equities and ETFs
Works best in confirmed uptrends
Backtesting encouraged to adapt parameters per symbol and timeframe
Notes
Not an automated strategy; manual order execution required
Past behavior does not imply future performance
Always apply sound position sizing and risk management
Disclaimer
This indicator is provided for educational and analytical purposes only.
It does not constitute financial advice or performance assurance.
Tight Entry Trend Engine Strategy═══════════════════════════════════════
TIGHT ENTRY TREND ENGINE
═══════════════════════════════════════
A breakout-based trend-following system designed to capture explosive
moves by entering at precise resistance/support breakouts with minimal
entry risk and massive profit potential.
⚠️ LOW WIN RATE, HIGH REWARD SYSTEM ⚠️
This is NOT a high win-rate strategy. Expect 25-35% winners, but
when it hits, winners are typically 10X+ larger than losers.
═══════════════════════════════════════
🎯 WHAT THIS SYSTEM DOES
═══════════════════════════════════════
The Tight Entry Trend Engine identifies powerful breakout opportunities
by detecting when price breaks through established trendlines with
confirmation from higher timeframe trends:
1. DYNAMIC TRENDLINE DETECTION (3 BANKS)
• Automatically draws support and resistance trendlines
• 3 separate "banks" capture short-term, medium-term, and long-term levels
• Each bank has configurable parameters (required pivot touch count,
angle limits, lengths)
2. BREAKOUT ENTRY TIMING
• Enters LONG when price breaks ABOVE resistance trendlines
• Enters SHORT when price breaks BELOW support trendlines
• Entry Alert occurs at the exact moment of breakout = "tight entry"
• Stop-loss placed just below/above the broken trendline (configurable)
3. HIGHER TIMEFRAME TREND FILTER
• Uses Hull Moving Average (HMA) on higher timeframe for trend following
• Auto-adjusts HTF based on your chart timeframe
• Optional filters prevent entries against major trend
• Optional "overextension" filter avoids buying parabolic moves
4. VOLATILITY-ADAPTIVE RISK MANAGEMENT
• Stop-loss calculated using Average True Range (ATR)
• Tighter stops = better R:R
• Profit targets adjust dynamically with volatility
• Breakeven stop moves automatically when in profit
• Extended profit targets when far from HTF trend
═══════════════════════════════════════
📊 HOW IT WORKS (METHODOLOGY)
═══════════════════════════════════════
STEP 1: TRENDLINE FORMATION
The system continuously scans for pivot highs and pivot lows to
construct trendlines. You control:
BANK 1 (Short-Term):
- Pivot Length: How many bars to look back for swing points
- Min Touches: How many pivots needed to form a line (default: 3)
- Max Length: How far back lines can reach (default: 180 bars)
- Angle Limits: Maximum steepness allowed for valid trendlines
- Tolerance: How close pivots must align to form horizontal lines
BANK 2 (Medium-Term):
- Slightly longer pivot periods for more significant levels
- Captures medium-term trend structure
- Default Max Length: 200 bars
BANK 3 (Long-Term):
- Focuses on major support/resistance zones
- Often uses horizontal levels (angled lines disabled by default)
- Default Max Length: 300 bars
The system draws RESISTANCE lines (red) above price and SUPPORT
lines (green) below price. These adapt in real-time as new pivots form.
STEP 2: BREAKOUT DETECTION
LONG SIGNALS:
- Price closes above a resistance trendline
- Higher timeframe trend is up (optional filter)
- Price not overextended from HTF trend (optional filter)
- No position currently open
SHORT SIGNALS:
- Price closes below a support trendline
- Higher timeframe trend is down (optional filter)
- Price not overextended from HTF trend (optional filter)
- No position currently open
The "tight" aspect: Because you're entering right at the trendline
break, your stop-loss can be placed very close (just below the
broken resistance for longs), creating exceptional risk/reward ratios.
STEP 3: POSITION SIZING
Choose between:
- Fixed $ Risk Per Trade: Risk same dollar amount every trade
- % Risk Per Trade: Risk percentage of current equity
Position size automatically calculated based on:
- Your risk amount
- Distance to stop-loss (ATR-based)
- Works with stocks, futures, crypto (auto-adjusts for contract multipliers)
STEP 4: EXIT MANAGEMENT
Multiple exit methods working together:
- PROFIT TARGET: Exits when profit reaches 100x your risk
- EXTENDED PROFIT: Earlier exit (80R) when very far from HTF trend
- STOP LOSS: Fixed ATR-based stop below entry
- HTF TREND EXIT: Exits when price crosses below HTF trend with profit
- BREAKEVEN PULLBACK: Exits if profit drops below 0.6R after reaching breakeven
- PARTIAL PROFITS: Optional - take partial profits at specified R-multiple
═══════════════════════════════════════
🔧 KEY COMPONENTS EXPLAINED
═══════════════════════════════════════
HULL MOVING AVERAGE (HMA)
A smoothed moving average that reduces lag compared to traditional
MAs. The system uses HMA on a higher timeframe to determine the
dominant trend direction. You can choose:
- Auto HTF: System picks appropriate HTF based on your chart timeframe
- Manual HTF: You specify the higher timeframe
AVERAGE TRUE RANGE (ATR)
Measures current market volatility. Used for:
- Stop-loss distance (tighter when volatility low)
- Profit targets (larger when volatility high)
- Position sizing (smaller positions in volatile conditions)
- Breakeven trigger distance
TRENDLINE ANGLE FILTERING
Each trendline bank has angle limits to ensure quality:
- Resistance lines: Max downward/upward slope allowed
- Support lines: Max downward/upward slope allowed
- Angles automatically adjust based on current volatility
- Prevents overly steep/unreliable trendlines
SENSITIVITY CONTROL
One master slider adjusts multiple parameters:
- Trendline detection sensitivity
- HTF MA length
- Exit timing
- Auto-adjusts for daily+ timeframes (60% increase)
═══════════════════════════════════════
⚙️ WHAT YOU SEE ON YOUR CHART
═══════════════════════════════════════
TRENDLINES:
✓ Red resistance lines above price
✓ Green support lines below price
✓ Orange broken lines (past breakouts)
✓ Lines extend to show current levels
HTF TREND:
✓ Thick colored line showing higher timeframe trend
✓ Color gradient: Red (bearish) → Orange → Yellow → Green (bullish)
✓ 250-bar smoothed curve for visual clarity
ENTRY/EXIT SIGNALS:
✓ Small green dot below bar = Long entry
✓ Small red dot above bar = Short entry
✓ Small red dot above = Long exit
✓ Small black dot below = Short exit
OPTIONAL DETAILED LABELS:
✓ Bank number that triggered entry (Bank 1, 2, or 3)
✓ Exit reason (Profit Target, Stop Loss, HTF Exit, etc.)
✓ Partial profit notifications
POSITION TRACKING:
✓ Yellow dashed line at entry price (extends right)
✓ Green/red fill showing current profit/loss zone
✓ Lime arrows at top = Currently in long position
✓ Red arrows at bottom = Currently in short position
✓ Gray background = No position (flat)
STATS TABLE (Top Right):
✓ Current position (LONG/SHORT/FLAT)
✓ Risk per trade ($ or %)
✓ Entry price
✓ Unrealized P/L in dollars
✓ P/L in R-multiples (how many R's profit/loss)
✓ Average winner/loser R ($ mode) OR CAGR (% mode)
═══════════════════════════════════════
📈 OPTIMAL USAGE
═══════════════════════════════════════
BEST ASSETS:
- NASDAQ:QQQ on 1-hour (reg) chart ⭐ (PRIMARY OPTIMIZATION)
- Strong trending stocks: NVDA, AAPL, TSLA, MSFT, GOOGL, AMZN
- High volatility tech stocks
- Crypto: BTC, ETH
- Any liquid asset with clear trends and momentum (GOLD)
AVOID:
- Low volatility stocks
- Ranging/choppy markets
- Penny stocks or illiquid assets
- Assets without clear directional movement
BEST TIMEFRAMES:
- PRIMARY: 1-hour charts (optimal for QQQ)
- ALSO EXCELLENT: 2H, 4H, 8H
- WORKS: 15min, 30min (only momentum leaders, more noise)
- WORKS WITH ADJUSTMENTS: 1D, 2D (decrease trendline pivot lengths)
═══════════════════════════════════════
📊 BACKTEST RESULTS (QQQ 1H (Reg hours), 1999-2024)
═══════════════════════════════════════
The system showed on NASDAQ:QQQ 1-hour timeframe (regular hours):
- Total Return: 1,100,000%+ over 24 years
- Total Trades: 500+
- Win Rate: ~20-24% (LOW - this is by design!)
- Average Winner: 8-15% gain
- Average Loser: 2-4% loss
- Win/Loss Ratio: 10:1 (winners much bigger than losers)
- Profit Factor: 3+
- Max Drawdown: 45-50%
- Risk per trade: 3% of capital
KEY INSIGHT: This is a LOW WIN RATE, HIGH REWARD system. You will
lose more trades than you win, but the few winners are so large
they more than compensate for many small losses.
IMPORTANT: These are backtested results using optimal parameters
on historical data. Real trading results will vary based on:
- Your execution and timing
- Slippage and commissions
- Your emotional discipline
- Market conditions during your trading period
═══════════════════════════════════════
🎓 WHO IS THIS FOR?
═══════════════════════════════════════
IDEAL FOR:
✓ Swing traders comfortable holding winners for longer period
✓ Part-time traders (1H = check 2-3x per day)
✓ Traders seeking exceptional risk/reward ratios
✓ Those comfortable with low win rates if winners are huge
✓ Technical analysis enthusiasts
✓ Breakout traders
✓ Trend followers
═══════════════════════════════════════
🚀 GETTING STARTED - STEP BY STEP
═══════════════════════════════════════
STEP 1: APPLY TO YOUR CHART
- Search "Tight Entry Trend Engine" in indicators
- Click to apply to your chart
- Trendlines and HTF line will appear immediately
STEP 2: CHOOSE YOUR SETTINGS
For BEGINNERS - Use These Settings First:
1. Trade Direction & Filters:
• ENABLE LONGS: ✓ ON
• ENABLE SHORTS: ✗ OFF (start with longs only)
• Sensitivity: 1.0 (default)
• HTF Trend Entry Filter: ✓ ON (safer entries)
• Block Entries When Overextended: ✓ ON (avoid parabolic tops)
2. Position Sizing & Risk:
• Position Sizing: "Per Risk"
• RISK Type: "$ Per Trade"
• Risk Amount: $200 (or 1-3% of your account)
3. Visual Settings:
• Show Support Lines: ✗ OFF (unless trading shorts)
• Show Detailed Entry/Exit Labels: ✓ ON
• Show Stats Table: ✓ ON
• Show Entry Line & P/L Fill: ✓ ON
4. Leave everything else at DEFAULT for now
STEP 3: UNDERSTAND WHAT YOU SEE
When trendlines appear:
- RED lines above = Resistance (watch for price breaking UP through these)
- GREEN lines below = Support (watch for price breaking DOWN)
- When price breaks a red line = Potential LONG entry
- When price breaks a green line = Potential SHORT entry
The HTF trend line (thick colored):
- Green/lime = Strong uptrend (favorable for longs)
- Red = Strong downtrend (favorable for shorts if enabled)
- Orange/yellow = Transitioning
STEP 4: OBSERVE SIGNALS
- Small GREEN dot below bar = System entered LONG
- Small RED dot above bar = System exited LONG
- Check the label to see which "Bank" triggered (Bank 1, 2, or 3)
- Watch the yellow entry line and colored fill show your P/L
STEP 5: PAPER TRADE FIRST
- Use TradingView's paper trading feature
- Watch how signals perform on YOUR chosen asset
- Understand the win rate will be LOW (20-35%)
- Verify that winners are indeed much larger than losers
- Test for at least 20-30 signals before going live
STEP 6: OPTIMIZE FOR YOUR ASSET (OPTIONAL)
If default settings aren't working well:
For FASTER signals (more trades):
- Reduce Pivot Length 1 to 3-4
- Reduce Max Length 1 to 120-150
- Increase Sensitivity to 1.2-1.5
For SLOWER signals (higher quality):
- Increase Pivot Length 1 to 7-10
- Increase Max Length 1 to 250+
- Decrease Sensitivity to 0.7-0.9
For DAILY timeframes:
- Increase all Pivot Lengths by 30-50%
- Increase all Max Lengths significantly
- Sensitivity: 0.6-0.8
═══════════════════════════════════════
⚙️ ADVANCED SETTINGS EXPLAINED
═══════════════════════════════════════
TRENDLINE BANK SETTINGS:
Each bank (1, 2, 3) has these parameters:
- Min Touches: Minimum pivots to form a line
- Lower (2) = More lines, earlier detection
- Higher (4+) = Fewer lines, higher quality
- Pivot Length: Lookback for swing points
- Lower (3-5) = Reacts to recent price action
- Higher (10+) = Only major swing points
- Max Length: How old a trendline can be
- Shorter (100-150) = Only recent lines
- Longer (300+) = Include historical levels
- Tolerance: Alignment strictness for horizontal lines
- Lower (3.0-3.5) = Very strict horizontal
- Higher (4.5+) = More forgiving alignment
- Allow Angled Lines: Enable diagonal trendlines
- ON = Catches sloped support/resistance
- OFF = Only horizontal levels
- Angle Limits: Maximum steepness allowed
- Lower (1-2) = Only gentle slopes
- Higher (4-6) = Accept steeper angles
- Automatically adjusts for volatility
ATR MULTIPLIERS:
- STOP LOSS ATR (0.6): Distance to stop-loss
- Lower (0.4-0.5) = Tighter stops, stopped out more
- Higher (0.8-1.0) = Wider stops, more room
- PROFIT TARGET ATR (100): Main profit target
- This is 100x your risk = 10,000% R:R
- Lower (50-80) = Take profits sooner
- Higher (120+) = Let winners run longer
- BREAKEVEN ATR (40): When to move stop to breakeven
- Lower (20-30) = Protect profits earlier
- Higher (60+) = Give more room before protecting
HIGHER TIMEFRAME:
- Auto HTF: Automatically selects appropriate HTF
- 5min chart → uses 2H
- 15-30min → uses 6H
- 1-4H → uses 2D
- Daily → uses 4D
- HTF MA Length (300): HMA period for trend
- Lower (150-250) = More responsive
- Higher (400-500) = Smoother, less whipsaw
- HTF Trend Following Exit: Exits when crossing HTF
- ON = Additional exit method
- OFF = Rely only on profit targets/stops
- HTF Trend Entry Filter: Only trade with HTF trend
- ON = Safer, fewer signals
- OFF = More aggressive, more signals
- Block Entries When Overextended: Prevents chasing
- ON = Avoids parabolic tops/bottoms
- OFF = Enter all breakouts regardless
═══════════════════════════════════════
💡 TRADING PHILOSOPHY & EXPECTATIONS
═══════════════════════════════════════
This system is built on one core principle:
"ACCEPT SMALL, FREQUENT LOSSES TO CAPTURE RARE, MASSIVE WINS"
What this means:
- You WILL lose 65%-75% of your trades
- Most losses will be small (1-2R)
- Some winners hit 80R+
- Over time, math works in your favour

Camarilla Pivots + 20 EMA StrategyThis is an intraday volatility and trend-following system for commodities like Natural Gas, combining dynamic pivot levels (Camarilla) with a trend filter (20-period EMA) to improve risk-reward and reduce false breakouts.
Core Components
1. Camarilla Pivots:
These are special support and resistance levels (H3, H4, L3, L4) calculated each day based on the previous day's high, low, and close.
The pivots adapt to daily volatility, giving more relevant breakout and bounce zones than static lines.
H4: Aggressive resistance (used for breakout LONG entry)
H3: Moderate resistance/support (used for bounce or stoploss)
L4: Aggressive support (used for breakout SHORT entry)
L3: Moderate support/resistance (used for bounce or stoploss)
2. 20 EMA (Exponential Moving Average):
Plotted on the 30-minute chart, this acts as a trend filter.
If the price is above 20 EMA: Only look for long trades (bullish bias).
If below 20 EMA: Only look for short trades (bearish bias).
How the Strategy Works
Setup (30-Min Chart):
Camarilla pivots for the day are drawn on the chart.
20 EMA is also plotted.
Trade Filter:
Bullish: Trade ONLY if price is above 20 EMA.
Bearish: Trade ONLY if price is below 20 EMA.
Entry:
LONG: Enter when price breaks and closes above the H4 pivot AND is above 20 EMA.
SHORT: Enter when price breaks and closes below the L4 pivot AND is below 20 EMA.
Stop Loss:
LONG: Place stoploss at H3 (the next lower Camarilla resistance).
SHORT: Place stoploss at L3 (the next higher Camarilla support).
Target:
Always set a profit target at 2x the distance (risk) between entry and stoploss (strict R:R 2).
For example, if your entry is at H4 and stoploss at H3, your target is entry + 2*(entry - stoploss).
Alerts & Visuals:
The strategy plots entry arrows, stoploss and target lines for immediate visual reference.
Alerts trigger on breakout signals so you never miss a trade.
Why This Works Well for Natural Gas
Adapts to volatility: The pivots change daily, handling wide-ranging and choppy price moves better than fixed breakouts.
Trend filter: EMA prevents counter-trend whipsaws, only trades with market momentum.
Risk control: Every trade must meet strict risk-reward criteria, so losses are contained and winners can outweigh losers.

DCA with the Money Supply Index DCA with the Money Supply Index (MSI) by zdmre
This strategy is based on the Money Supply Index (MSI) by zdmre and enhances it with two functional options for users: a DCA (Dollar-Cost Averaging) approach and a signal-based buy/sell mode. It’s designed to help traders and investors make data-driven, disciplined entry decisions based on monetary supply trends.
🧠 Concept Overview
The Money Supply Index (MSI) provides insight into how liquidity (money supply) influences market movements. This strategy builds upon that foundation by allowing users to either:
Accumulate positions over time using DCA, based on favorable MSI conditions.
Execute a single buy and sell trade, optimized for bull market conditions.
⚙️ Inputs Explained
General Parameters
Start Bar Index / Stop Bar Index
Defines the range of bars (historical data) for backtesting or strategy visualization.
Long DCA
Activates the DCA mode. If unchecked, the strategy operates in single-entry/single-exit signal mode.
Trading Signal
Enables signal-based entries and exits when the MSI reaches predefined thresholds.
DCA Parameters
Entry Value
The MSI value that triggers a DCA buy event. When the MSI crosses below this value, the strategy considers it a favorable moment to deploy the saved capital.
Saved Amount
The amount of money set aside regularly (e.g., monthly) for investment. This simulates the DCA effect by accumulating capital and deploying it when conditions are optimal.
Data Inputs
Money Supply
The data source for the Money Supply Index (default: ECONOMICS:USM2).
Relational Symbol
The market instrument to compare against the money supply (default: NASDAQ_DLY:NDX). This allows the strategy to measure liquidity impact on a specific market.
Chart Display Options
You can toggle these metrics on the chart for better visualization:
Entry Price (green) – The price level of executed buys.
Cash Balance (yellow) – Remaining uninvested capital.
Invested Capital (red) – Total amount currently invested.
Current Value (blue) – The current valuation of the investment.
Profit (purple) – The total realized and unrealized profit.
Trades on Chart / Signal Labels / Quantity – Enables trade markers, signal text, and position size visualization.
📈 How the Strategy Works
1️⃣ DCA Mode
In DCA mode, the strategy simulates periodic savings and only invests when the MSI indicates favorable liquidity conditions (based on the Entry Value).
This approach aims to achieve the best possible average entry price over time — a powerful strategy for long-term investors seeking stable accumulation with reduced emotional bias.
2️⃣ Signal-Based Mode
In signal mode (with DCA disabled), the strategy performs one buy and one sell trade based on MSI turning points.
It’s most effective during bull markets, where liquidity expansion supports upward momentum.
This mode helps identify high-probability entry and exit zones rather than averaging in continuously.
💡 Additional Notes
This strategy includes helpful metrics to monitor your personal investment performance — showing invested capital, cash reserves, and profit in real-time.
The goal is to combine macroeconomic insight (money supply) with disciplined execution and capital management.
⚠️ Disclaimer
This strategy is for educational and research purposes only. It does not constitute financial advice. Always conduct your own analysis before making investment decisions.

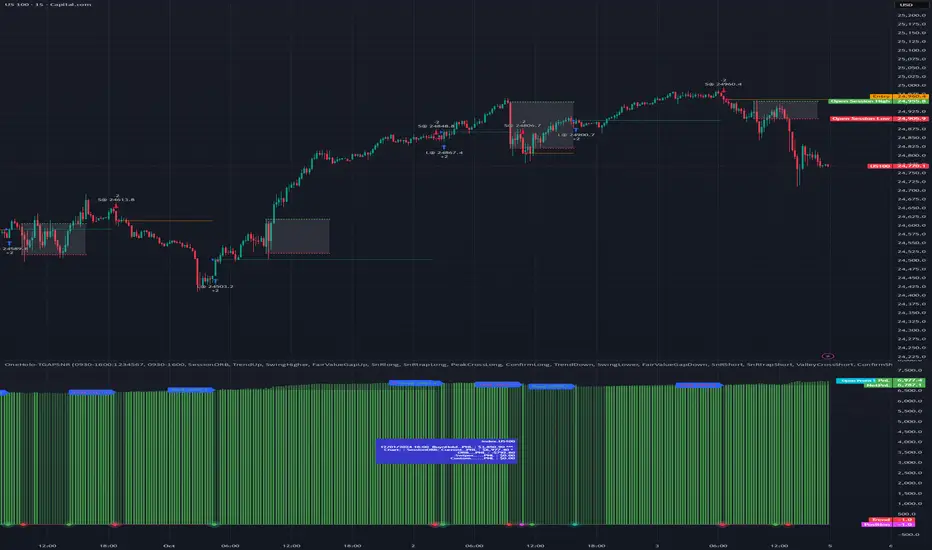
OneHolo-TGAPSNRTGAPSNR: Multi time frame - Trend Gap Stop And Reverse strategy/Study PnL. This script outlines a systematic approach to generating buy and sell signals by combining Fair Value Gaps (FVGs), specific market structures, and three different trend direction methods (Swing, Gravity, and FVG Inverse direction). The strategy incorporates multiple entry modes, such as Hyper Mode, Swiper Mode, and a Custom mode, allowing users to tailor signal conditions, alongside extensive logic for trade management, higher time frame analysis, and various visual indicators for plotting trend, pivots, and profit and loss information.
I. Core Trend Direction Consensus (The Three-Pillar System)
The primary method for determining market bias is a three-pillar consensus model, requiring all directional methods to align before the overall Trend Direction is established (up or down). This ensures high conviction for trend signals.
• Pillar 1: Swing Direction: Determines market direction based on classic price action, specifically checking for continuous higher highs and higher lows for an upward bias, or lower lows and lower highs for a downward bias.
• Pillar 2: Gravity Direction (Peak and Valley): This uses specific market structure pivots. Direction is set based on whether the close price successfully crosses the established recent Peak High (indicating upward momentum) or crosses under the recent Valley Low (indicating downward pressure).
• Pillar 3: FVG Inverse Direction: This relies on Fair Value Gaps (FVGs), defined as a gap between the current bar's price and the price two bars prior. Direction shifts occur when the Close price crosses the midpoint of the last relevant FVG. For instance, crossing above the midpoint of the last FVG Down signals a potential inverse long trade.
II. Flexible Signal Generation Modes
The strategy offers several pre-configured and highly detailed entry modes, plus a powerful Custom Mode:
• Session Open Range Break (ORB) Mode: Uses the high/low of the session's first bar to generate initial signals, then defaults to the Three-Pillar Trend Direction after the ORB session concludes.
• Swiper Mode: Designed to identify continuations, combining a confirmed Trend Direction with a Stop and Reverse signal (SnR) while actively avoiding confirmed pivot breaks.
• Hyper/Aggressive Modes: These modes use broad combinations of signals, allowing for earlier entry based on momentum and structural breaks (like PeakCrossLong, SnRtrapLong, or FVG signals).
• Custom Query Mode (The Seven-Slot Logic): This non-redundant system allows the user to define complex, tailored entry conditions by selecting any combination of 14 core patterns across seven distinct slots.
◦ AND/OR Combination: For each of the seven slots, the user determines if the chosen pattern must be met (AND component) or if it can serve as an alternative trigger (OR component).
◦ The final signal requires that all configured AND conditions are true and then integrates the result of the OR conditions, allowing for highly specific "hook queries" (e.g., "Condition A AND Condition B, OR Condition C").
III. Advanced PnL and Mobile App Diagnostics
A key proprietary element is the implementation of a dual PnL system and customized visualization features:
• Dual PnL Display (Strategy PnL vs. Study PnL): Users can choose to view either the native platform's strategy performance data or the script's internal, proprietary Study PnL. The Study PnL calculates profits/losses based strictly on the close price and tracks performance using Pine Script® arrays, providing a transparent, diagnostic view of performance independent of broker/platform simulation biases.
• Lower Panel Visualization: Both PnL types are displayed on the lower panel using detailed bar plots (style=plot.style_columns), which color according to profitability, and include labels that show current open profit and total net profit.
• Detailed Trade Labels: The script generates detailed, customizable labels on both the chart (above/below bars) and the lower PnL panel, providing historical PnL, number of trades, and real-time profit information for each entry or exit.
IV. Higher Time Frame (HTF) Context and Lookahead Prevention
The strategy integrates multi-time frame analysis using strict methodology to prevent lookahead bias:
• HTF Bias Filtering: When enabled, the strategy uses the position calculated on a user-defined higher time frame (HTF) as a mandatory filter. A long signal on the current chart is only executed if the HTF is also in a long position, and vice-versa.
• Lookahead Prevention: To maintain integrity, all HTF data requests use a mandatory lookback index (often ) to ensure the script only accesses confirmed data from the prior completed bar on the higher timeframe.
• HTF Visual Mode: The user can opt to display key structural elements—such as the Gravity Pivots and the Trend Direction blocks—as calculated on the HTF, overlaying this higher-level context onto the current chart for visual analysis.
The TGAPSNR: Multi time frame - Trend Gap Stop And Reverse strategy/Study PnL script, despite its complexity, intentionally excludes realistic considerations such as fees, slippage, and explicit risk management settings (like fixed stop-loss or take-profit rules) from its primary logic.
Here is an explanation of why these elements are omitted in the strategy's current implementation and why they must be applied by the user for real-world application, drawing on the context of the sources:
1. Absence of Realistic Fees, Commissions, and Slippage
The primary function of the TGAPSNR script is to execute intricate signal generation and diagnostic PnL calculation based on its three-pillar trend system and Custom Mode logic.
However, the strategy's backtesting results, particularly those displayed by the internal Study PnL feature, are based purely on price difference (e.g., (close - lse) * syminfo.pointvalue * IUnits).
• Strategy Result Requirements: TradingView explicitly states that strategies published publicly should strive to use realistic commission AND slippage when calculating backtesting results to avoid misleading traders.
• User Responsibility: Since the script currently focuses on signal integrity and uses a fixed contract size (IUnits = 1) without configurable commission/slippage inputs shown in the source, the user must manually configure these fees within the Pine Script® Strategy Tester settings (Properties tab) to ensure the strategy results are reflective of actual trading costs.
2. Omission of Built-in Risk Management (Stop-Loss and Take-Profit)
The TGAPSNR strategy's core focuses on entry signals and trend confirmation. Exits are primarily governed by:
• Reversal signals (BuyStop or SellStop).
• End-of-Day (EOD) session closures (EODStop).
• HTF bias opposition.
What is Missing: The script does not include explicit, hard-coded risk management parameters for traditional stop-loss (SL) or take-profit (TP) levels (e.g., risk percentage or ATR-based exits).
• Viable Risk: TradingView guidelines stipulate that strategies should generally risk sustainable amounts of equity, usually not exceeding 5-10% on a single trade, and trade size must be appropriate.
• User Application: To ensure the strategy operates within realistic risk boundaries, users must apply their own risk management rules. This includes:
◦ Implementing realistic stops and profit targets, which can be added via Pine Script® code or manually managed during live trading.
◦ Sizing trades to only risk sustainable amounts of equity. The current default unit size (IUnits = 1) is unrealistic for risk assessment unless the symbol is micro-sized.
3. Execution Quality (Fills)
The strategy is set to fill_orders_on_standard_ohlc = true and operates on confirmed bar closes (barstate.isconfirmed).
• Fill Assumption: This suggests the strategy primarily uses close price or the HTF close price (EntryPrice = HTFClose) for execution.
• Real-World Limitation: In volatile markets, obtaining a fill price equal to the close of the bar is rare. The user must be aware that the simulated fill price shown in backtesting may differ significantly from actual execution prices due to market action and chosen order type, reinforcing the importance of applying slippage settings.
In summary, while the script provides highly detailed and unique signal generation and internal PnL diagnostics, users must exercise caution and apply their own realistic parameters for fees, slippage, and explicit risk controls to prevent misleading performance results and ensure viable trading
Universal Breakout Strategy [KedArc Quant]Description:
A flexible breakout framework where you can test different logics (Prev Day, Bollinger, Volume, ATR, EMA Trend, RSI Confirm, Candle Confirm, Time Filter) under one system.
Choose your breakout mode, and the strategy will handle entries, exits, and optional risk management (ATR stops, take-profits, daily loss guard, cooldowns).
An on-chart info table shows live mode values (like Prev High/Low, Bollinger levels, RSI, etc.) plus P&L stats for quick analysis.
Use it to compare which breakout style works best on your instrument and timeframe, whether intraday, swing, or positional trading
🔑 Why it’s useful
* Flexibility: Switch between breakout strategies without loading different indicators.
* Clarity: On-chart info table displays current mode, relevant indicator levels, and live strategy P&L stats.
* Testing efficiency: Quickly A/B test different breakout styles under the same backtest environment.
* Transparency: Every trade is rule-based and displayed with entry/exit markers.
🚀 How it helps traders
* Lets you experiment with breakout strategies quickly without loading multiple scripts.
* Helps identify which breakout method fits your instrument & timeframe.
* Gives clear on-chart visual + statistical feedback for confident decision-making.
⚙️ Input Configuration
* Breakout Mode → choose which strategy to test:
* *Prev Day* → breakouts of yesterday’s High/Low.
* *Bollinger* → Upper/Lower BB pierce.
* *Volume* → Breakout confirmed with volume above average.
* *ATR Stop* → Wide range breakout using ATR filter.
* *Time Filter* → Breakouts inside defined session hours.
* *EMA Trend* → Breakouts only in EMA fast > slow alignment.
* *RSI Confirm* → Breakouts with RSI confirmation (e.g. >55 for longs).
* *Candle Confirm* → Breakouts validated by bullish/bearish candle.
* Lookback / ATR / Bollinger inputs → adjust sensitivity.
* Intrabar mode → option to evaluate breakouts using bar highs/lows instead of closes.
* Table options → show/hide info table, show/hide P&L stats, choose corner placement.
📈 Entry & Exit Logic
* Entry → occurs when breakout condition of chosen mode is met.
* Exit → default exits via opposite signals or optional stop/target if enabled.
* Session filter → optional auto-flat at session end.
* P&L management → optional daily loss guard, cooldown between trades, and ATR-based stop/take profit.
❓ FAQ — Choosing the best setup
Q: Which strategy should I use for which chart?
* *Prev Day Breakouts*: Best on indices, FX, and liquid futures with strong daily levels.
* *Bollinger*: Works well in range-bound environments, or crypto pairs with volatility compression.
* *Volume*: Good on equities where breakout strength is tied to volume spikes.
* *ATR Stop*: Suits volatile instruments (commodities, crypto).
* *EMA Trend*: Useful in trending markets (stocks, indices).
* *RSI Confirm*: Adds momentum filter, better for swing trades.
* *Candle Confirm*: Ideal for scalpers needing visual confirmation.
* *Time Filter*: For intraday traders who want signals only in high-liquidity sessions.
Q: What timeframe should I use?
* Intraday traders → 5m to 15m (Time Filter, Candle Confirm).
* Swing traders → 1H to 4H (EMA Trend, RSI Confirm, ATR Stop).
* Position traders → Daily (Prev Day, Bollinger).
* Breakout
A trade entry condition triggered when price crosses above a resistance level (for longs) or below a support level (for shorts).
* Prev Day High/Low
Formula:
Prev High = High of (Day )
Prev Low = Low of (Day )
* Bollinger Bands
Formula:
Basis = SMA(Close, Length)
Upper Band = Basis + (Multiplier × StdDev(Close, Length))
Lower Band = Basis – (Multiplier × StdDev(Close, Length))
* Volume Confirmation
A breakout is only valid if:
Volume > SMA(Volume, Length)
* ATR (Average True Range)
Measures volatility.
Formula:
ATR = SMA(True Range, Length)
where True Range = max(High–Low, |High–Close |, |Low–Close |)
* EMA (Exponential Moving Average)
Weighted moving average giving more weight to recent prices.
Formula:
EMA = (Price × α) + (EMA × (1–α))
with α = 2 / (Length + 1)
* RSI (Relative Strength Index)
Momentum oscillator scaled 0–100.
Formula:
RSI = 100 – (100 / (1 + RS))
where RS = Avg(Gain, Length) ÷ Avg(Loss, Length)
* Candle Confirmation
Bullish candle: Close > Open AND Close > Close
Bearish candle: Close < Open AND Close < Close
Win Rate (%)
Formula:
Win Rate = (Winning Trades ÷ Total Trades) × 100
* Average Trade P&L
Formula:
Avg Trade = Net Profit ÷ Total Trades
📊 Performance Notes
The Universal Breakout Strategy is designed as a framework rather than a single-asset optimized system. Results will vary depending on the chart, timeframe, and asset chosen.
On the current defaults (15-minute, INR-denominated example), the backtest produced 132 trades over the selected period. This provides a statistically sufficient sample size.
Win rate (~35%) is relatively low, but this is balanced by a positive reward-to-risk ratio (~1.8). In practice, a lower win rate with larger wins versus smaller losses is sustainable.
The average P&L per trade is close to breakeven under default settings. This is expected, as the strategy is not tuned for a single symbol but offered as a universal breakout framework.
Commissions (0.1%) and slippage (1 tick) are included in the simulation, ensuring realistic conditions.
Risk management is conservative, with order sizing set at 1 unit per trade. This avoids over-leveraging and keeps exposure well under the 5-10% equity risk guideline.
👉 Traders are encouraged to:
Experiment with inputs such as ATR period, breakout length, or Bollinger parameters.
Test across different timeframes and instruments (equities, futures, forex, crypto) to find optimal setups.
Combine with filters (trend direction, volatility regimes, or volume conditions) for further refinement.
⚠️ Disclaimer This script is provided for educational purposes only.
Past performance does not guarantee future results.
Trading involves risk, and users should exercise caution and use proper risk management when applying this strategy.

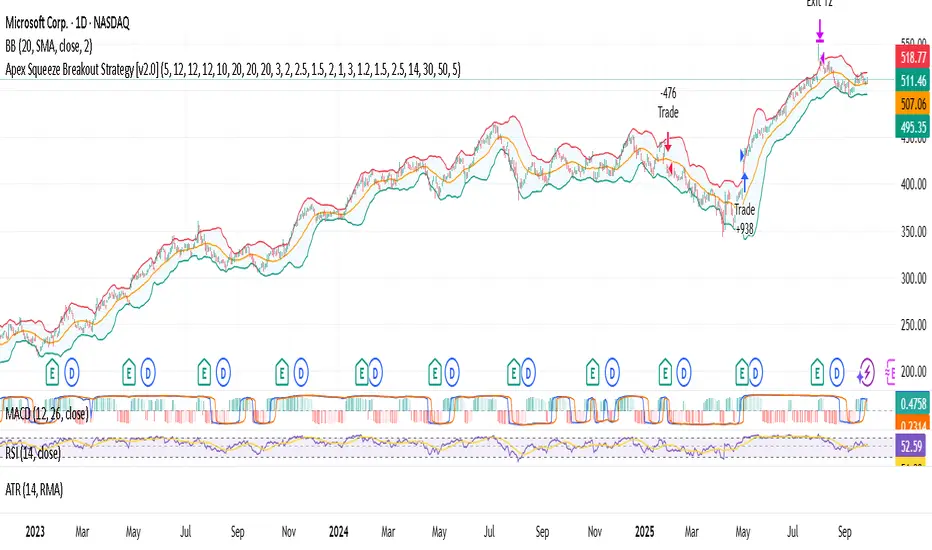
Apex Squeeze Breakout Strategy (v1.0 by SKC)The Apex Squeeze Breakout Strategy is a powerful momentum-based system designed to capture explosive price moves following periods of low volatility compression (squeeze). It combines five key conditions to validate high-probability breakouts:
🔵 TTM Squeeze Detection using Bollinger Bands and Keltner Channels
🔊 Volume Spike Confirmation relative to a moving average
📈 Breakout Trigger above/below a recent high/low range
💪 Momentum Acceleration using percentage change over time
♻️ RSI Recovery / Overbought Logic to confirm shift in strength
The strategy includes:
Configurable swing/day trading modes
Dynamic ATR-based Stop Loss and TP1/TP2 system
Modular input structure for easy customization
Clear entry/exit visual markers and trade zones
It’s designed for disciplined traders who want to catch high-energy moves after consolidation, suitable for both intraday and swing setups.
AI - Gaussian Channel Strategy AI – Gaussian Channel Strategy is a long-only swing trading strategy designed for Bitcoin and other assets on daily charts. It combines an adaptive Gaussian Channel with Supertrend and Stochastic RSI filters to identify potential bullish breakouts or pullback entries. The channel defines trend direction and volatility, while the Stochastic RSI provides momentum confirmation. Positions are opened only when the price closes above the channel’s upper band under favorable momentum conditions, and are closed when the price crosses back below the band.
This script is intended for educational and research purposes. Parameters such as poles, period length, ATR factor, and RSI settings can be adjusted to fit different markets and timeframes.
Disclaimer: This script does not guarantee profits and should not be considered financial advice. Past performance is not indicative of future results. Trading involves risk, and you are solely responsible for your own decisions and outcomes.

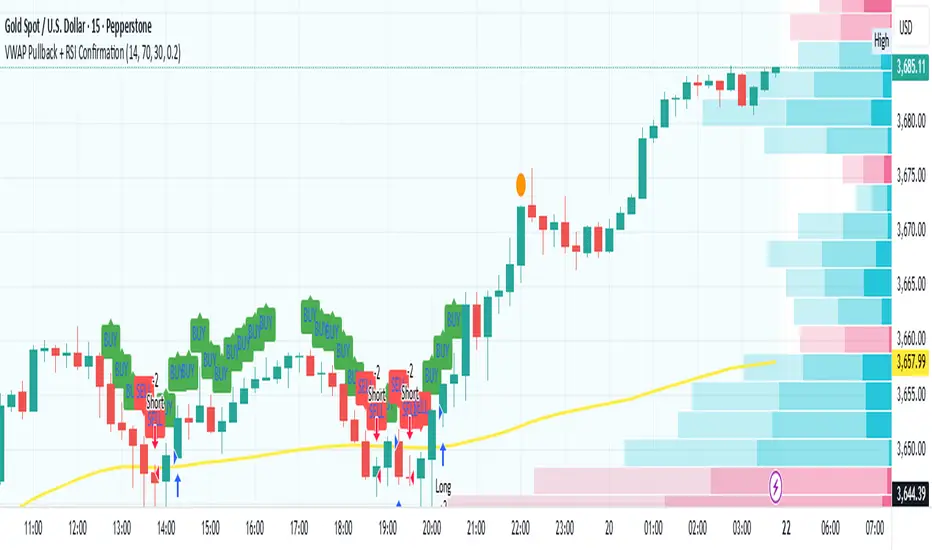
VWAP Pullback + RSI ConfirmationThis strategy focuses on trend continuation entries. Instead of betting on reversions, it looks for opportunities when price pulls back to VWAP but the dominant trend remains intact.
Trend Bias:
Price above VWAP = bullish environment → look for BUY pullbacks.
Price below VWAP = bearish environment → look for SELL pullbacks.
Entry Logic:
BUY: Price pulls back near VWAP, RSI stays above oversold (momentum intact).
SELL: Price pulls back near VWAP, RSI stays below overbought (momentum intact).
Exit Rule:
Stop-loss just below/above VWAP.
Take-profit at 1.5–2x risk (default script uses ~2%).
Best Timeframes:
15m–1H → good for intraday trend-following setups.
Daily → captures stronger, longer trends.
⚡ This strategy is powerful in trending markets because VWAP acts as a "magnet" for pullbacks, while RSI prevents overbought/oversold traps.
Grand Master's Candlestick Dominance (ATR Enhanced)### Grand Master's Candlestick Dominance (ATR Enhanced)
**Overview**
Unleash the ancient wisdom of Japanese candlestick charting with a modern twist! This comprehensive Pine Script v5 strategy and indicator scans for over 75 classic and advanced candlestick patterns (bullish, bearish, and neutral), assigning dynamic strength scores (1-10) to each for precise signal filtering. Enhanced with Average True Range (ATR) for volatility-aware body size validation, it dominates the markets by combining timeless pattern recognition with robust confirmation layers. Whether used as a backtestable strategy or visual indicator, it empowers traders to spot high-probability reversals, continuations, and indecision setups with surgical accuracy.
Inspired by Steve Nison's *Japanese Candlestick Charting Techniques*, this tool elevates pattern analysis beyond basics—think Hammers, Engulfing patterns, Morning Stars, and rare gems like Abandoned Baby or Concealing Baby Swallow—all consolidated into intelligent arrays for real-time averaging and prioritization.
**Key Features**
- **Extensive Pattern Library**:
- **Bullish (25+ patterns)**: Hammer (8.0), Bullish Engulfing (10.0), Morning Star (7.0), Three White Soldiers (9.0), Dragonfly Doji (8.0), and more (e.g., Rising Three, Unique Three River Bottom).
- **Bearish (25+ patterns)**: Hanging Man (8.0), Bearish Engulfing (10.0), Evening Star (7.0), Three Black Crows (9.0), Gravestone Doji (8.0), and exotics like Upside Gap Two Crows or Stalled Pattern.
- **Neutral/Indecision (34+ patterns)**: Doji variants (Long-Legged, Four Price), Spinning Tops, Harami Crosses, and multi-bar setups like Upside Tasuki Gap or Advancing Block.
Each pattern includes duration tracking (1-5 bars) and ATR-adjusted body/shadow criteria for relevance in volatile conditions.
- **Smart Confirmation Filters** (All Toggleable):
- **Trend Alignment**: 20-period SMA (customizable) ensures entries align with the prevailing trend; optional higher timeframe (e.g., Daily) MA crossover for multi-timeframe confluence.
- **Support/Resistance (S/R)**: Pivot-based levels with 0.01% tolerance to confirm bounces or breaks.
- **Volume Surge**: 20-period volume MA with 1.5x spike multiplier to validate momentum.
- **ATR Body Sizing**: Filters small bodies (<0.3x ATR) and long bodies (>0.8x ATR) for context-aware pattern reliability.
- **Follow-Through**: Ensures post-pattern confirmation via bullish/bearish closes or closes beyond prior bars.
Minimum average strength (default 7.0) and individual pattern thresholds (5.0) prevent weak signals.
- **Entry & Exit Logic**:
- **Long Entry**: Bullish average strength ≥7.0 (outweighing bearish), uptrend, volume spike, near support, follow-through, and HTF alignment.
- **Short Entry**: Mirror for bearish dominance in downtrends near resistance.
- **Exits**: Bearish/neutral shift, or fixed TP (5%) / SL (2%)—pyramiding disabled, 10% equity sizing.
- Backtest range: Jan 1, 2020 – Dec 31, 2025 (editable). Initial capital: $10,000.
- **Interactive Dashboard** (Top-Right Panel):
Real-time insights including:
- Market phase (e.g., "Bullish Phase (Avg Str: 8.2)"), active pattern (e.g., "BULLISH: Bullish Engulfing (Str: 10.0, Bars: 2)"), and trend status.
- Strength breakdowns (Bull/Bear/Neutral counts & averages).
- Filter status (e.g., "Volume: ✔ Spike", "ATR: Enabled (L:0.8, S:0.3)").
- Backtest stats: Total trades, win rate, streak, and last entry/exit details (price & timestamp).
Toggle mode: Strategy (live trades) or Indicator (signals only).
- **Advanced Alerts** (15+ Toggleable Types):
Set up via TradingView's "Any alert() function call" for bar-close triggers:
- Entry/Exit signals with strength & pattern details.
- Strong patterns (≥2 bullish/bearish), neutral indecision, volume spikes.
- S/R breakouts, HTF reversals, high-confidence singles (≥8.0 strength).
- Conflicting signals, MA crossovers, ATR volatility bursts, multi-bar completions.
Example: "STRONG BULLISH PATTERN detected! Strength: 9.5 | Top Pattern: Three White Soldiers | Trend: Up".
**Customization & Usage Tips**
- **Inputs Groups**: Strategy toggles, confirmations, exits, backtest dates, and 15+ alert switches—all intuitively grouped.
- **Optimization**: Tune min strengths for aggressive (lower) or conservative (higher) trading; enable/disable filters to suit your style (e.g., disable S/R for scalping).
- **Best For**: Forex, stocks, crypto on 1H–Daily charts. Test on historical data to refine TP/SL.
- **Limitations**: No external data installs; relies on built-in TA functions. Patterns are probabilistic—combine with your risk management.
Master the candles like a grandmaster. Deploy on TradingView, backtest relentlessly, and let dominance begin! Questions? Drop a comment.
*Version: 1.0 | Updated: September 2025 | Credits: Built on Pine Script v5 with nods to Nison's timeless techniques.*

回撤再入场引擎This is a long-only, counter-trend strategy that aims to buy dips in a medium-term downtrend. The entry logic is based on a confluence of four filters:
1. **Trend Filter:** The price must be trading below the 60-period Simple Moving Average (SMA).
2. **Oversold Condition:** The WaveTrend Oscillator must first dip below -60 and then recover above -55.
3. **Momentum Confirmation:** The MACD must show sustained bullish momentum for at least 2 bars.
4. **Re-entry Filter:** A new trade is only allowed if the price is at least a certain percentage lower than the last trade's exit price.
The exit is based on a fixed Take Profit target. This version does not include a stop-loss.

Tristan's Box: Pre-Market Range Breakout + RetestMarket Context:
This is designed for U.S. stocks, focusing on pre-market price action (4:00–9:30 AM ET) to identify key support/resistance levels before the regular session opens.
Built for 1 min and 5 min timelines, and is intended for day trading / scalping.
Core Idea:
Pre-market range (high/low) often acts as a magnet for price during regular hours.
The first breakout outside this range signals potential strong momentum in that direction.
Retest of the breakout level confirms whether the breakout is valid, avoiding false moves.
Step-by-Step Logic:
Pre-Market Range Identification:
Track high and low from 4:00–9:30 AM ET.
Draw a box spanning this range for visual reference and calculation.
Breakout Detection:
When the first candle closes above the pre-market high → long breakout.
When the first candle closes below the pre-market low → short breakout.
The first breakout candle is highlighted with a “YOLO” label for visual confirmation.
Retest Confirmation:
Identify the first candle whose wick touches the pre-market box (high touches top for short, low touches bottom for long).
Wait for the next candle: if it closes outside the box, it confirms the breakout.
Entry Execution:
Long entry: on the confirming candle after a wick-touch above the pre-market high.
Short entry: on the confirming candle after a wick-touch below the pre-market low.
Only the first valid entry per direction per day is taken.
Visuals & Alerts:
Box represents pre-market high/low.
Top/bottom box border lines show the pre-market high / low levels cleanly.
BUY/SELL markers are pinned to the confirming candle.
Added a "YOLO" marker on breakout candle.
Alert conditions trigger when a breakout is confirmed by the retest.
Strategy Type:
Momentum breakout strategy with confirmation retest.
Combines pre-market structure and risk-managed entries.
Designed to filter false breakouts by requiring confirmation on the candle after the wick-touch.
In short, it’s a pre-market breakout momentum strategy: it uses the pre-market high/low as reference, waits for a breakout, and then enters only after a confirmation retest, reducing the chance of entering on a false spike.
Always use good risk management.

Disparity(20MA) ±1 × Stochastic 80/20 + ATR SL/TP[by Irum]Disparity(20MA) ±1 × Stochastic 80/20 + ATR SL/TP
사용 설명서 (KR/EN Bilingual Manual)
1) 목적 & 정의 / Purpose & Definition
KR — 목적 & 정의
이 스크립트는 이격도(Disparity) 와 스토캐스틱(80/20) 의 동시 신호를 활용해 추세 전환/지속 구간의 고확률 진입 시점을 포착하고, ATR 기반 손절/익절(고정 또는 트레일링)로 리스크를 정량화하여 운용 효율을 높이기 위해 설계되었습니다.
핵심 아이디어:
가격이 20MA 대비 ±임계값을 크로스(과열/침체 해소 신호)하고,
스토캐스틱이 80/20을 돌파/이탈(모멘텀 전환 신호)할 때,
두 신호가 동일봉 또는 N봉 내 동기화되면 진입.
청산: ATR×배수를 이용한 고정 TP/SL 또는 ATR 트레일링.
EN — Purpose & Definition
This strategy combines Disparity (price vs. 20MA) and Stochastic (80/20) to identify high-probability entries when momentum confirms mean-reversion/continuation, while ATR-based stops/take-profits (fixed or trailing) provide quantified risk control.
Core Idea:
Disparity crosses ±threshold (overbought/oversold release),
Stochastic crosses 80/20 (momentum shift),
Both conditions sync on the same bar or within N bars → entry.
Exits: Fixed ATR TP/SL or ATR trailing.
2) 신호 로직 요약 / Signal Logic Overview
KR
롱 진입: Disparity가 −임계값 상향 돌파 & Stochastic 20 상향 돌파가 syncBars 이내에 동시 충족.
숏 진입: Disparity가 +임계값 하향 돌파 & Stochastic 80 하향 돌파가 syncBars 이내에 동시 충족.
완화 옵션(useRelaxStoch): 최근 relaxLookback 내 20/80 터치 이력 + 현재 방향성만으로도 모멘텀 전환을 인정(교차 미충족 보완).
EN
Long: Disparity crosses up −threshold & Stochastic crosses up 20 within syncBars.
Short: Disparity crosses down +threshold & Stochastic crosses down 80 within syncBars.
Relaxed option (useRelaxStoch): Accepts momentum shift if 20/80 was touched in the last relaxLookback bars and the current slope confirms, even without a strict cross.
3) 설정 메뉴 안내 / Settings Menu Guide
A. 기본 / Core
기준가격 / Source (source)
설명: Disparity 계산에 쓰는 가격 소스.
입력: close, hl2, ohlc4 등.
기본값: close.
팁: 변동성 큰 종목은 hlc3/ohlc4가 노이즈를 줄이기도 함.
이격도 기준 MA 길이 / MA Length (for Disparity) (int ≥1)
설명: Disparity의 기준선이 되는 단순이동평균 길이.
기본값: 20.
영향: 길이↑ → 신호 빈도↓, 안정성↑.
이격도 임계값(±%) / Disparity Threshold (±%) (float ≥0.1, step 0.1)
설명: Disparity가 +임계값 아래로 하향 크로스(숏) 또는 −임계값 위로 상향 크로스(롱)할 때 신호.
기본값: 1.0%.
팁: 너무 크면 신호 드뭄, 너무 작으면 과다.
B. 스토캐스틱 / Stochastic
%K Length / K 길이 (int ≥1, 기본 14)
%K Smoothing / K 스무딩 (int ≥1, 기본 1)
%D Length / D 길이 (int ≥1, 기본 3)
설명: ta.stoch의 K를 스무딩한 kSlow와, 추가 스무딩한 dSlow(참조용)를 구성.
Buy Level (↑20) / 매수 기준선 (0~100, 기본 20)
Sell Level (↓80) / 매도 기준선 (0~100, 기본 80)
C. 신호 로직 / Signal Logic
Signal Sync Window (bars) / 신호 동기화 윈도우 (0~10, 기본 0)
설명: 0=두 신호가 같은 봉에서 모두 충족해야 함. N>0=최근 N봉 내에서 각각 한 번 발생하면 인정.
팁: 1~3은 현실적 체결/지연을 반영하며 과최적화 방지에 도움.
Relaxed Stochastic? (교차 완화) (bool, 기본 false)
설명: 교차 대신 최근 20/80 터치 + 현재 기울기만으로도 모멘텀 전환을 인정. 신호 빈도↑.
Relax lookback bars (int ≥1, 기본 5)
설명: 완화판정에 쓰는 최근 봉 수.
D. 리스크 / Risk (ATR)
ATR Length / ATR 길이 (int ≥1, 기본 14)
ATR Mult for Stop / 손절 ATR 배수 (float ≥0.1, 기본 1.5)
ATR Mult for Take-Profit / 익절 ATR 배수 (float ≥0.1, 기본 2.0)
설명: 진입가 ± ATR×배수로 SL/TP 설정.
팁: 변동성 큰 자산은 SL 배수↑, TP 배수도 함께 조정 권장.
Use ATR Trailing Stop? / ATR 트레일링 사용 (bool, 기본 false)
ATR Mult for Trailing / 트레일링 ATR 배수 (float ≥0.1, 기본 2.0)
설명: 고정 TP/SL 대신 추적 손절을 사용(수익 추적에 유리).
E. 시각화 / Visualization
Plot 20MA / 20MA 표시 (bool, 기본 true)
Show Entry Markers / 진입 마커 표시 (bool, 기본 true)
4) 진입·청산 규칙 / Entry & Exit Rules
KR
진입: 위 “신호 로직” 충족 시 strategy.entry("L"/"S").
청산 (고정형):
롱: Stop = 진입 − ATR×SL, TP = 진입 + ATR×TP
숏: Stop = 진입 + ATR×SL, TP = 진입 − ATR×TP
청산 (트레일링형):
ATR×trailMult로 산출한 trail_points/offset으로 추적 손절.
EN
Entry: Place strategy.entry("L"/"S") when sync conditions are met.
Exit (Fixed):
Long: Stop = Entry − ATR×SL, TP = Entry + ATR×TP
Short: Stop = Entry + ATR×SL, TP = Entry − ATR×TP
Exit (Trailing):
Use ATR×trailMult as trailing distance & offset.
5) 알림 / Alerts
조건
Long Entry (Disp −Thr & Stoch Up, sync) → longSignal
Short Entry (Disp +Thr & Stoch Down, sync) → shortSignal
메시지 포맷 / Message format
{"signal":"long|short","symbol":"{{ticker}}","price":{{close}}}
Webhook(예: 거래소·봇)에서 signal/symbol/price를 활용해 체결 로직과 연동하십시오.
6) 빠른 시작 & 권장 프리셋 / Quick Start & Suggested Presets
KR — BTC/USDT (15분봉) 제안
maLen=20, thrPct=1.0~1.5, kLen=14, kS=1, dLen=3, stBuyLv=20, stSellLv=80
syncBars=1~3 (동시성 여유), useRelaxStoch=true, relaxLookback=5
고정형: atrLen=14, atrMultSL=1.5~2.0, atrMultTP=2.0~3.0
트레일링형: useTrail=true, trailMult=2.0~3.0
EN — BTC/USDT (15-min) suggestion
Above defaults, with syncBars=1~3, useRelaxStoch=true to improve fill realism.
Increase atrMultSL on high-volatility days to reduce whipsaws.
7) 운용 팁 & 점검 / Tips & Troubleshooting
KR
신호가 안 나와요: thrPct가 지나치게 크거나 syncBars=0으로 너무 엄격할 수 있음. thrPct↓, syncBars↑ 조정.
휩쏘 과다: useRelaxStoch를 끄거나 thrPct↑, atrMultSL↑.
TP 도달 전에 청산: 트레일링 사용 시 변동성 확대로 SL이 따라붙다 체결될 수 있음 → trailMult↑ 또는 고정형 전환.
과최적화 방지: 한 구간에 과특화된 튜닝(특히 syncBars, thrPct)은 다른 시장에서 성능 저하. Walk-forward 권장.
EN
No signals: Lower thrPct and/or increase syncBars.
Too many whipsaws: Disable relaxed mode, raise thrPct and/or atrMultSL.
Stopped before TP (trailing): Increase trailMult or switch to fixed exits.
Robustness: Avoid over-tuning; validate via walk-forward testing.
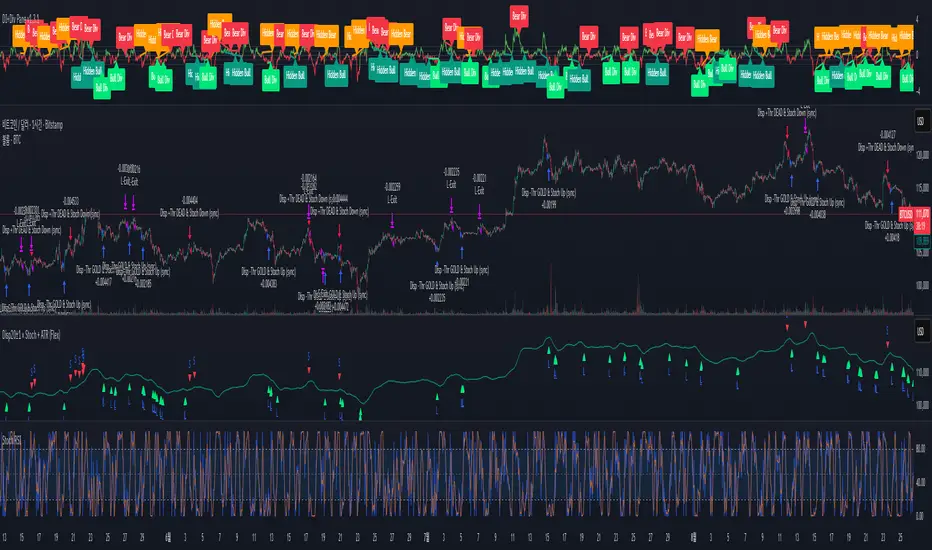
Hilly's Advanced Crypto Scalping Strategy - 5 Min ChartTo determine the "best" input parameters for the Advanced Crypto Scalping Strategy on a 5-minute chart, we need to consider the goals of optimizing for profitability, minimizing false signals, and adapting to the volatile nature of cryptocurrencies. The default parameters in the script are a starting point, but the optimal values depend on the specific cryptocurrency pair, market conditions, and your risk tolerance. Below, I'll provide recommended input values based on common practices in crypto scalping, along with reasoning for each parameter. I’ll also suggest how to fine-tune them using TradingView’s backtesting and optimization tools.
Recommended Input Parameters
These values are tailored for a 5-minute chart for liquid cryptocurrencies like BTC/USD or ETH/USD on exchanges like Binance or Coinbase. They aim to balance signal frequency and accuracy for day trading.
Fast EMA Length (emaFastLen): 9
Reasoning: A 9-period EMA is commonly used in scalping to capture short-term price movements while remaining sensitive to recent price action. It reacts faster than the default 10, aligning with the 5-minute timeframe.
Slow EMA Length (emaSlowLen): 21
Reasoning: A 21-period EMA provides a good balance for identifying the broader trend on a 5-minute chart. It’s slightly longer than the default 20 to reduce noise while confirming the trend direction.
RSI Length (rsiLen): 14
Reasoning: The default 14-period RSI is a standard choice for momentum analysis. It works well for detecting overbought/oversold conditions without being too sensitive on short timeframes.
RSI Overbought (rsiOverbought): 75
Reasoning: Raising the overbought threshold to 75 (from 70) reduces false sell signals in strong bullish trends, which are common in crypto markets.
RSI Oversold (rsiOversold): 25
Reasoning: Lowering the oversold threshold to 25 (from 30) filters out weaker buy signals, ensuring entries occur during stronger reversals.
MACD Fast Length (macdFast): 12
Reasoning: The default 12-period fast EMA for MACD is effective for capturing short-term momentum shifts in crypto, aligning with scalping goals.
MACD Slow Length (macdSlow): 26
Reasoning: The default 26-period slow EMA is a standard setting that works well for confirming momentum trends without lagging too much.
MACD Signal Smoothing (macdSignal): 9
Reasoning: The default 9-period signal line is widely used and provides a good balance for smoothing MACD crossovers on a 5-minute chart.
Bollinger Bands Length (bbLen): 20
Reasoning: The default 20-period Bollinger Bands are effective for identifying volatility breakouts, which are key for scalping in crypto markets.
Bollinger Bands Multiplier (bbMult): 2.0
Reasoning: A 2.0 multiplier is standard and captures most price action within the bands. Increasing it to 2.5 could reduce signals but improve accuracy in highly volatile markets.
Stop Loss % (slPerc): 0.8%
Reasoning: A tighter stop loss of 0.8% (from 1.0%) suits the high volatility of crypto, helping to limit losses on false breakouts while keeping risk manageable.
Take Profit % (tpPerc): 1.5%
Reasoning: A 1.5% take-profit target (from 2.0%) aligns with scalping’s goal of capturing small, frequent gains. Crypto markets often see quick reversals, so a smaller target increases the likelihood of hitting profits.
Use Candlestick Patterns (useCandlePatterns): True
Reasoning: Enabling candlestick patterns (e.g., engulfing, hammer) adds confirmation to signals, reducing false entries in choppy markets.
Use Volume Filter (useVolumeFilter): True
Reasoning: The volume filter ensures signals occur during high-volume breakouts, which are more likely to sustain in crypto markets.
Signal Arrow Size (signalSize): 2.0
Reasoning: Increasing the arrow size to 2.0 (from 1.5) makes buy/sell signals more visible on the chart, especially on smaller screens or volatile price action.
Background Highlight Transparency (bgTransparency): 85
Reasoning: A slightly higher transparency (85 from 80) keeps the background highlights subtle but visible, avoiding chart clutter.
How to Apply These Parameters
Copy the Script: Use the Pine Script provided in the previous response.
Paste in TradingView: Open TradingView, go to the Pine Editor, paste the code, and click "Add to Chart."
Set Parameters: In the strategy settings, manually input the recommended values above or adjust them via the input fields.
Test on a 5-Minute Chart: Apply the strategy to a liquid crypto pair (e.g., BTC/USDT, ETH/USDT) on a 5-minute chart.
Fine-Tuning for Optimal Performance
To find the absolute best parameters for your specific trading pair and market conditions, use TradingView’s Strategy Tester and optimization features:
Backtesting:
Run the strategy on historical data for your chosen pair (e.g., BTC/USDT on Binance).
Check metrics like Net Profit, Profit Factor, Win Rate, and Max Drawdown in the Strategy Tester.
Focus on a sample period of at least 1–3 months to capture various market conditions (bull, bear, sideways).
Parameter Optimization:
In the Strategy Tester, click the settings gear next to the strategy name.
Enable optimization for key inputs like emaFastLen (test range: 7–12), emaSlowLen (15–25), slPerc (0.5–1.5), and tpPerc (1.0–3.0).
Run the optimization to find the combination with the highest net profit or best Sharpe ratio, but avoid over-optimization (curve-fitting) by testing on out-of-sample data.
Market-Specific Adjustments:
Volatile Pairs (e.g., DOGE/USDT): Use tighter stop losses (e.g., 0.5–0.7%) and smaller take-profit targets (e.g., 1.0–1.2%) to account for rapid price swings.
Stable Pairs (e.g., BTC/USDT): Slightly wider stop losses (e.g., 1.0–1.2%) and take-profit targets (e.g., 1.8–2.5%) may work better.
Trending Markets: Increase emaSlowLen (e.g., to 25–30) to follow stronger trends.
Choppy Markets: Tighten bbMult (e.g., to 1.8) and lower rsiOverbought/rsiOversold (e.g., to 70/30) to filter noise.
Forward Testing:
After backtesting, run the strategy in real-time on a demo account for 1–2 weeks to validate performance under current market conditions.
Important Notes
No Universal "Best" Numbers: Optimal parameters vary by crypto pair, exchange, and market conditions (e.g., bull vs. bear market). The suggested values are a starting point based on common scalping practices.
Risk Management: Never risk more than 1–2% of your account per trade. Adjust position sizing in TradingView’s strategy settings to align with your risk tolerance.
Market Volatility: Crypto markets are highly volatile. Test the strategy on your specific pair and adjust parameters if signals are too frequent or too rare.
Not Financial Advice: This is an educational tool. Backtest thoroughly and use a demo account before trading with real funds.
If you want me to generate a chart showing backtest performance for specific parameters or to tweak the script further (e.g., adding more indicators or adjusting signal logic), let me know!can you add clear buy ans sell signs above the candles in this codeTo add clear buy and sell signals above the candles in the provided Pine Script, I'll modify the existing code to include prominent text labels directly above (for sell signals) and below (for buy signals) the candles. These labels will be larger, color-coded, and positioned to avoid clutter, ensuring they are easily visible on the chart. The core strategy logic (EMA, RSI, MACD, Bollinger Bands, candlestick patterns, and volume filter) will remain unchanged, and I'll reuse the same artifact_id since this is an update to the previous script.AdvancedCryptoScalpingStrategy.pinex-pine

NIFTY_2min_FVG_Buy_StrategySummary
This strategy is designed for scalping Nifty on a 2-minute chart, focusing exclusively on long entries. The script's purpose is to identify and act on specific bullish reversal patterns based on volume analysis and price action.
Concept & Core Logic
The strategy operates on a two-stage confirmation process:
Volume Absorption: The initial condition seeks to identify potential bullish reversals by detecting signs of selling pressure being absorbed by buyers. This suggests that a downward move may be losing momentum.
Fair Value Gap (FVG) Confirmation: After a volume absorption signal, the strategy waits for a Fair Value Gap (FVG) to appear. A long entry signal is generated only after a candle closes above the FVG zone, serving as confirmation of bullish intent.
Risk Management
The strategy employs a fixed take profit and stop loss for each trade, based on the Nifty underlying price:
Take Profit: The exit signal is triggered when a trade reaches a 25-point profit.
Stop Loss: The exit signal is triggered when a trade reaches a 30-point loss.
Intended Use
This tool is intended for traders who:
Utilize mechanical, rule-based systems for intraday trading and scalping.
Are interested in studying a structured approach that combines volume analysis with price action inefficiencies like Fair Value Gaps.
