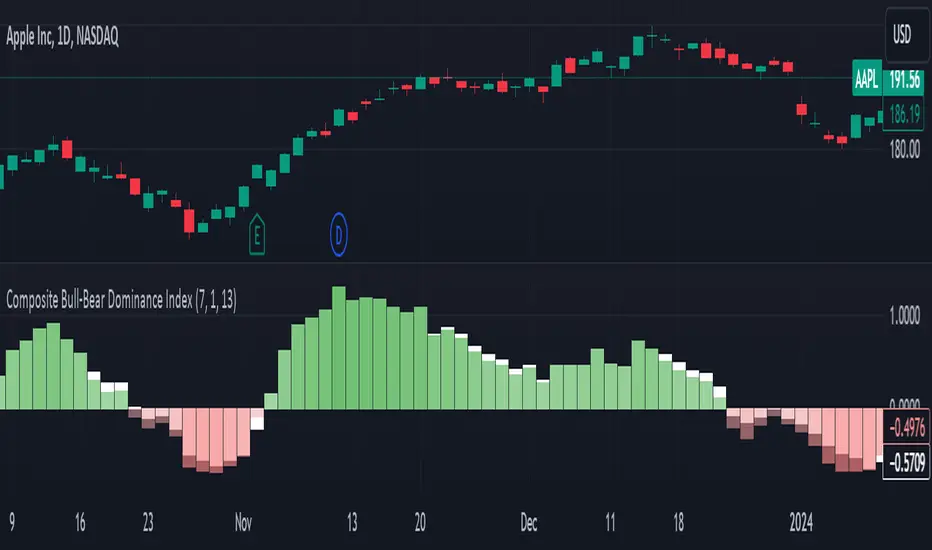
Composite Bull-Bear Dominance IndexNote: CREDITS: This is based on the Up Down Volume Indicator (published in Trading View) and Elder Ray Index (Bull Bear Power).
The Composite Bull Bear Dominance Index (CBBDI) is a indicator that combines up down volume analysis with Bull and Bear Power to provide a comprehensive view of market dynamics. It calculates Z-scores for up down volume delta and bull bear power measures, averages them, and then smoothes the result using Weighted Moving Average (WMA) for Bull and Bear Power and Volume Weighted Moving Average (VWMA) for Up and Down Volume Delta. The advantages include responsiveness to short-term trends, noise reduction through weighting, incorporation of volume information, and the ability to identify significant changes in buying and selling pressure. The indicator aims to offer clear signals for traders seeking insights into overall market dominance and indicate if the bulls or the bears have the upper hand.
Volume Analysis (Up/Down Volume Delta):
Up/Down Volume Delta reflects the net difference between buying and selling volume, providing insights into the prevailing market sentiment.
Positive Delta: Indicates potential bullish dominance due to higher buying volume.
Negative Delta: Suggests potential bearish dominance as selling volume surpasses buying volume.
Price Analysis (Bull and Bear Power):
Bull and Bear Power measure the strength of buying and selling forces based on price movements and the Exponential Moving Average (EMA) of the closing price.
Positive Bull Power: Reflects bullish dominance, indicating potential upward momentum.
Positive Bear Power: Suggests bearish dominance, indicating potential downward momentum.
Composite Bull Bear Dominance Index (CBBDI):
CBBDI combines the standardized Z-scores of Up/Down Volume Delta and Bull Bear Power, providing an average measure of both volume and price-related dominance.
Positive CBBDI: Indicates an overall bullish dominance in both volume and price dynamics.
Negative CBBDI: Suggests an overall bearish dominance in both volume and price dynamics.
Smoothing Techniques:
The use of Weighted Moving Average (WMA) for smoothing Bull and Bear Power Z-scores, and Volume Weighted Moving Average (VWMA) for smoothing Up/Down Volume Delta, reduces noise and provides a clearer trend signal.
Smoothing helps filter out short-term fluctuations and emphasizes more significant trends in both volume and price movements.
Color Coding:
CBBDI values are color-coded based on their direction, visually representing the prevailing market sentiment.
Green Colors: Positive values indicate potential bullish dominance.
Red Colors: Negative values suggest potential bearish dominance.
Cerca negli script per "momentum"
Logical Trading Indicator V.1Features of the Logical Trading Indicator V.1
ATR-Based Trailing Stop Loss
The Logical Trading Indicator V.1 utilizes the Average True Range (ATR) to implement a dynamic trailing stop loss. You can customize the sensitivity of your alerts by adjusting the ATR Multiple and ATR Period settings.
Higher ATR Multiple values create wider stops, while lower values result in tighter stops. This feature ensures that your trades are protected against adverse price movements. For best practice, use higher values on higher timeframes and lower values on lower term timeframes.
Bollinger Bands
The Logical Trading Indicator V.1 includes Bollinger Bands, which can be customized to use either a Simple Moving Average (SMA) or an Exponential Moving Average (EMA) as the basis.
You can adjust the length and standard deviation multiplier of the Bollinger Bands to fine-tune your strategy. The color of the basis line changes to green when price is above and red when price is below the line to represent the trend.
The bands show a range vs a single band that also represents when the price is in overbought and oversold ranges similar to an RSI. These bands also control the take profit signals.
You also have the ability to change the band colors as well as toggle them off, which only affects the view, they are still active which will still fire the take profit signals.
Momentum Indicator
Our indicator offers a momentum filter option that highlights market momentum directly on the candlesticks, identifying periods of bullish, bearish, or consolidation phases. You can enable or disable this filter as needed, providing valuable insights into market conditions.
By default, you will see the candlestick colors represent the momentum direction as green or red, and consolidation periods as white, but the filter on the BUY and SELL signals is not active. The view options and filter can be toggled on and off in the settings.
Buy and Sell Signals
The Logical Trading Indicator V.1 generates buy and sell signals based on a combination of ATR-based filtering, Bollinger Band basis crossover, and optional momentum conditions if selected in the settings. These signals help you make informed decisions about when to enter or exit a trade. You can also enable a consolidation filter to stay out of trades during tight ranges.
Basically a BUY signal fires when the price closes above the basis line, and the price meets or exceeds the ATR multiple from the previous candle length, which is also editable in the settings.
If the momentum filter is engaged, it will not fire BUY signals when in consolidation periods. It works just the opposite for SELL signals.
Take Profit Signals
We've integrated a Take Profit feature that helps you identify points to exit your trades with profits. The indicator marks Long Take Profit when prices close below the upper zone line of the Bollinger Bands after the previous candle closes inside the band, suggesting an optimal point to exit a long trade or consider a short position.
Conversely, Short Take Profit signals appear when prices close above the lower zone after the previous candle closes inside of it, indicating the right time to exit a short trade or contemplate a long position.
Alerts for Informed Trading
The Logical Trading Indicator V.1 comes equipped with alert conditions for buy signals, sell signals, take profit points, and more. Receive real-time notifications to your preferred devices or platforms to stay updated on market movements and trading opportunities.

Zaree - FX Index RSI IndicatorDescription:
The "Zaree - FX Index RSI Indicator" (FIRI) is a technical analysis tool designed to provide insights into the relative strength of two selected currency indices using the Relative Strength Index (RSI). It allows traders to compare the RSI values of a primary currency index and a secondary currency index, helping them identify potential overbought and oversold conditions in the currency market.
Details of the Indicator:
The indicator calculates the RSI for both the primary and secondary currency indices based on the user's selections.
Traders can choose from a variety of currency indices to use as the primary and secondary indices for comparison.
The indicator offers settings for customizing the calculation of the RSI, including selecting the type of moving average (SMA, EMA, WMA, SMMA) and adjusting the length of the RSI and moving average.
Upper and lower RSI bands are displayed on the chart to highlight potential overbought and oversold conditions.
The RSI values and their corresponding moving average values are plotted on the chart, allowing traders to visually analyze the relative strength of the indices.
How to Use the Indicator:
Select the primary and secondary currency indices you want to compare from the provided dropdown menus. These indices will serve as the basis for RSI calculation.
Choose the type of moving average (SMA, EMA, WMA, SMMA) to use for RSI calculation and set the desired length for the moving average.
Decide whether you want to visualize the RSI and moving average values for the primary and secondary indices on the chart.
Observe the RSI values and moving averages plotted on the chart. The indicator's upper and lower bands can help you identify potential overbought (above the upper band) and oversold (below the lower band) conditions.
Pay attention to the intersections between the RSI values and the moving average lines. These intersections can provide insights into potential trend changes or reversals in the currency market.
Example of Usage:
Let's say you're a swing trader focusing on currency pairs involving the US Dollar (USD) and Euro (EUR). You want to compare the relative strength of the USD Index (USDINX) and the EUR Index (EURINX) to identify potential trading opportunities. Here's how you can use the FIRI indicator:
Select "USDINX" as the primary index and "EURINX" as the secondary index.
Choose "SMA" as the moving average type and set the RSI length to 14.
Enable the visualization of RSI values for both the primary and secondary indices.
Observe the chart to identify instances where the RSI values of the indices cross above the upper band (potential overbought) or below the lower band (potential oversold).
Look for intersections between the RSI values and the moving average lines. A bullish signal may occur when the RSI crosses above the moving average, indicating potential upward momentum, while a bearish signal may occur when the RSI crosses below the moving average, indicating potential downward momentum.
Remember that the FIRI indicator is a tool to assist you in your analysis. It's important to consider other technical and fundamental factors before making trading decisions.
Feel free to adjust the settings of the indicator based on your trading preferences and strategy. Keep in mind that no indicator is foolproof, and it's recommended to use the FIRI indicator in conjunction with other analysis techniques for a comprehensive trading approach.

Musashi_Slasher (Mometum+Volatility)--- Musashi Slasher (Momentum + Volatility ) ---
This tool was designed to fit my particular trading style and personal theories about the "Alchemy of the markets".
Velocity
This concept will be represented by the light blue and gray lines, a fast RSI (11 periods Relative Strength Index ), and a slow one ( RSI 14 periods as Wilder's half-cycle recommendation).
Note: Regular and hidden divergences will be plotted to help spot interesting spots and help with timing.
- Regular divergences will hint at a slowdown in price action.
- Hidden divergences will hint at a continuation as energy stored as some type of potential energy ready to be released violently. It is also referred ad 'The Slingshot'
Momentum
To understand Momentum, we must know that in physics Momentum = mass * velocity
We will understand mass as the mass of money of the market, which is found in the volume. To represent this concept a colored cloud will be plotted, this area will be given by MFI (13 periods Money Flow Index) and VRSI (Volume RSI ), when MFI is above VRSI will be colored dark blue, else red.
Note: Regular and hidden divergences on MFI will be plotted.
Volatility
The key to making this Alchemic theory work is to understand the "Transmutation" of the volatility which will be plotted by a multicolor line which will be blue in periods of low volatility and Red in periods of high volatility. I like to see these states as 'Ice' and 'Magma', as some periods the volatility just freezes, giving you hints that maybe a big move can be approaching, and at some points is just burning hot. Something I like about this indicator is that is trend agnostic. The line is named BBWP ( Bollinger Bands Width Percentile), as it calculates the width of the Bollinger bands (13 periods) and plot it as a percentile.
Finally, we will study the volatility of the volume, plotted as the red and purple mountains at the bottom of the indicator. This will complement and confirm the information provided by the Velocity-Momentum concepts.
Final Note
This indicator will only help identify interesting moments in the market, it's very powerful if used correctly, but it might be difficult to read in the beginning. It won't give "signals", as it is for understanding different dimensions in the market, I use it as it fits perfectly my trading strategies and tactics.
Best!
Musashi Alchemist
TopTenAlg0 1. Sentiment & MomentumEN: Mum Sentiment & Momentum is an indicator that measures the psychological thresholds of the O candle and the rate of change of the price (Rate of Chance / Bar Momentum). Each price action is a separate action with flexibility. Mum Sentiment & Momentum shows you the speed and direction of this price action. If sentiment and momentum are green, the rise will continue, if it is much above momentum sentiment, it indicates the presence of an enthusiastic psychological movement. If sentiment and momentum are red, a correction may come and a decrease is expected, and if momentum is well below sentiment, there is an enthusiastic sale.
This algorithm is prepared with @Top10Algo ... Optimization periods
TR: Mum Sentiment & Momentum her barda ayrı ayrı olmak üzere O muma ait psikolojik eşikleri ve fiyatın değişim hızını ( Rate of Chance / Mum Momentumu ) ölçen bir göstergedir. Her bir fiyat hareketi esnekliği olan ayrı birer aksiyondur. Mum Sentiment & Momentum size bu fiyat aksiyonunun hızını ve yönünün ne olduğunu gösterir. Eğer sentiment ve momentum yeşil ise yükselişin devam edeceğini, momentum sentiment’ in çok üstünde ise coşkulu bir psikolojik hareketin varlığını gösterir. Eğer sentiment ve momentum kırmızı ise düzeltme gelebileceğini ve düşüş beklenildiğini, momentum ise sentiment’in çok altında ise coşkulu bir satış’ ın olduğunu gösterir.
Bu algoritma @Top10Algo ile beraber hazırlanmıştır... Periyotlar optimize edilmiştir.

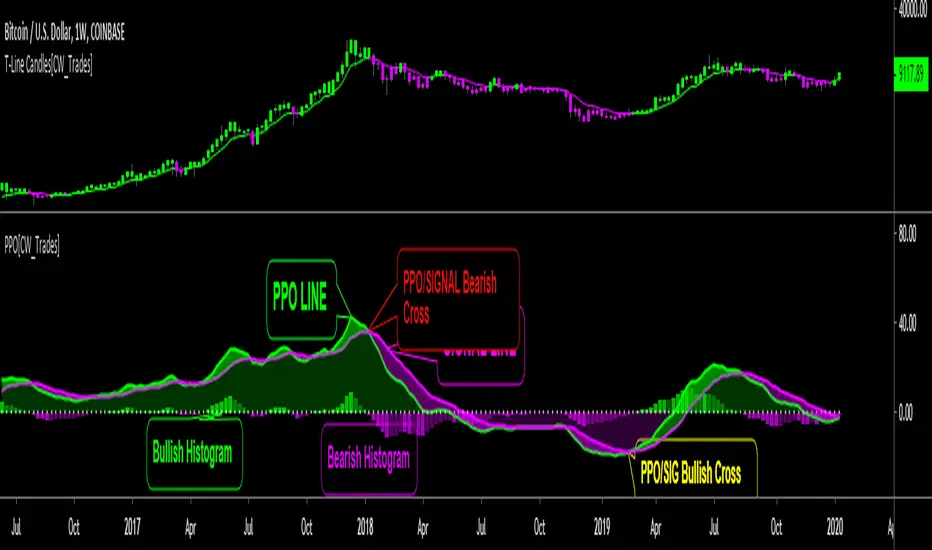
Price Percent OscillatorThe Percentage Price Oscillator(PPO) is a momentum oscillator that measures the difference between two moving averages as a percentage of the larger moving average. Similar to the Moving Average Convergence/Divergence(MACD), the PPO is comprised of a signal line, a histogram and a centerline. Signals are generated with signal line crossovers, centerline crossovers, and divergences. Because these signals are no different than those associated with MACD, this indicator can be read exactly as the MACD is read. The main differences between the PPO and MACD are: 1) PPO readings are not subject to the price level of the security. 2) PPO readings for different securities can be compared, even when there are large differences in the price. MACD readings for different securities cannot be compared when there are large differences in price.
Calculations:
Percentage Price Oscillator (PPO): {(12-day EMA - 26-day EMA)/26-day EMA} x 100
Signal Line: 9-day EMA of PPO
PPO Histogram: PPO - Signal Line
This PPO indicator retains standard PPO settings. Additions to this indicator are: 1) filling the space between the PPO LINE and SIGNAL LINE. Space is green when PPO is above SIGNAL, purple when PPO is below SIGNAL. The color of the space between PPO and SIGNAL is used to define short-term momentum for price(green is positive momentum, pink is negative momentum). 2) filling the space between the PPO LINE and CENTER LINE(0 LEVEL). This space is filled green when the PPO is above the CENTER LINE and pink when the PPO is below the CENTER LINE. Green in this area indicates positive momentum in the intermediate-term while pink indicates negative momentum in the intermediate-term.
TradeRaven — VWAP Auto Trend Signal Pro)TradeRaven — VWAP Auto Trend Signal Pro
A next-gen VWAP signal engine built for traders who want speed, accuracy, and true institutional clarity — without needing footprint charts or high-end orderflow tools.
This indicator reads what the market is actually doing and classifies every major behavioural shift into instantly recognisable signal states.
What Makes This Tool Different
Most indicators respond after the move.
This one responds to the behaviour that creates the move.
It interprets the real internal pressure behind each candle —
expansion, contraction, absorption, imbalance, continuation —
and instantly classifies the bar into:
CON — Trend Continuation
REV — Mean Reversion
IGN — Ignition
MON — Monster Displacement
EXH — Exhaustion / Absorption
These aren’t random technical alerts.
They are behavioural state transitions, the same shifts professional traders watch when evaluating momentum, failure, and opportunity.
This is why it feels unusually accurate:
it doesn’t chase price — it reads intention.
Universal Engine — Built for Every Market
Because the model is based on structural behaviour around VWAP, not fixed pattern recognition, it adapts seamlessly across a range of instruments
And it works on:
1–5m scalping
Intra-session day trading
Higher timeframe swing structure
If a market has candles, VWAP, and volume,
the engine knows how to classify the move.
Why VWAP Is the Perfect Anchor
VWAP (Volume-Weighted Average Price — average price weighted by traded volume) is the institutional benchmark for execution and session fairness.
VWAP gives you the map:
Near VWAP → equilibrium (fair value)
Far from VWAP → imbalance (opportunity or risk)
Return to VWAP → reversion / rebalance
Acceleration away → genuine trend commitment
This engine measures how price interacts with that fair-value line and translates the interaction into clear, tradable insights.
VWAP defines the environment.
The engine defines the behaviour.
How the Engine Interprets the Market
Every signal is the result of multi-layer behavioural reading.
The system evaluates:
Trend alignment & slope strength
Compression vs extension from fair value
Expansion velocity (how fast energy is released)
Volatility regime & session volume
Imbalance pressure
Wick rejection at extremes
Structural displacement patterns
This is what gives the signals depth.
They aren’t triggered by simple crossovers.
They only fire when the market shows a true change in internal state.
That’s why the signals feel “alive.”
Sensitivity Modes
Aggressive — fast profiling, more signals
Balanced — the clean default
Sniper — ultra-filtered, higher conviction
These modes shift behavioural thresholds depending on volatility and trend maturity, letting you tailor the tool to your execution style.
Session Filters
Choose the sessions you want the engine active in:
Asia
London
New York
This locks signals to genuine volatility windows instead of low-efficiency zones.
How Traders Use It
1. Start with VWAP Slope
The slope defines the environment:
Upward → pro-trend bias
Downward → sell-side bias
Flat → rotational or mean-reversion conditions
This alone filters most bad trades.
2. Read the Signals as Market Narrative
CON + IGN → Expansion
Ideal for continuation plays and momentum entries.
REV + EXH → Rotation
Perfect for spotting early reversions, failed highs/lows, and areas to reduce risk.
MON → Major Legs
These bars define the session and often mark liquidity breaks or displacement shifts.
You’re not trading signals —
you’re trading the story they reveal.
3. Combine It With Your Own Edge
The engine is designed to enhance:
Orderflow
CVD (Cumulative Volume Delta — measures net aggressive buyers/sellers)
Delta footprint
Market structure
Liquidity plays
Price action scalping
Think of it as orderflow-style clarity
without needing orderflow software.
Why This is a Game Changer
it turns chaos into structure.
it updates instantly.
it shows intention where most indicators show noise.
it helps you understand why the market moves — not just when.
This isn't a traditional “indicator.”
It’s a behavioural engine that maps strength, imbalance, exhaustion, and true momentum in a way that mirrors institutional reading.
In the right hands,
it becomes one of the cleanest, most accurate timing tools you’ll ever use.

RRG Style RS & Momentum (vs Benchmark) by AKM
## What this indicator does
This indicator is an **RRG‑style Relative Strength & Momentum tool**.
It compares the current symbol to a chosen benchmark (e.g. NIFTY / NIFTY 500) and plots:
- **RS‑Ratio**: Out/under‑performance of the symbol vs the benchmark, normalized around 100.
- **RS‑Momentum**: Momentum of that relative strength, also normalized around 100.
- **RS‑Signal**: A smoothed signal line of RS‑Ratio (EMA of RS‑Ratio).
Using these two axes (RS‑Ratio and RS‑Momentum), each bar is classified into one of four **RRG‑style quadrants**:
- **LEADING** – RS‑Ratio > 100 and RS‑Momentum > 100
- **WEAKENING** – RS‑Ratio > 100 and RS‑Momentum < 100
- **LAGGING** – RS‑Ratio < 100 and RS‑Momentum < 100
- **IMPROVING** – RS‑Ratio < 100 and RS‑Momentum > 100
The chart background is color‑coded by quadrant, and a label on the center (100) line shows the current zone name (LEADING / WEAKENING / LAGGING / IMPROVING) in real time.
> **Concept credit:**
> The conceptual framework of “Relative Strength vs Momentum” in four quadrants (Leading, Weakening, Lagging, Improving) is inspired by **Relative Rotation Graphs® (RRG®)**, created by **Julius de Kempenaer** and commercialized through RRG Research and platforms like Bloomberg, StockCharts, Optuma, etc.
> This script is only an RRG‑inspired *1‑symbol vs benchmark* implementation inside Pine, not an official RRG product.
***
## Inputs
- **Benchmark symbol**:
Default `NSE:NIFTY`. You can set `NSE:NIFTY500`, `NSE:BANKNIFTY`, sector indices, etc.
- **RS base length (`rsLen`)**:
EMA length for smoothing the raw price ratio (symbol / benchmark). Lower = more sensitive, higher = smoother.
- **Smoothing length (`smoothLen`)**:
Secondary smoothing for RS‑Ratio. Default 14.
- **Signal length (`signalLen`)**:
EMA length for the RS‑Signal line (EMA of RS‑Ratio).
- **Momentum length (`momLen`)**:
Lookback for optional ROC‑based momentum.
- **Use ROC‑based momentum**:
If `false` (default): RS‑Momentum is computed as RS‑Ratio / EMA(RS‑Ratio) × 100 (ratio‑style).
If `true`: RS‑Momentum uses ROC(RS‑Ratio, momLen) + 100 (ROC‑style).
- **Show quadrant background**:
Toggles colored background by quadrant.
- **Show zone name on background**:
Shows a label on the 100‑line with the current quadrant name.
***
## How to read it
There is a horizontal center line at **100**:
- **RS‑Ratio > 100** → symbol is outperforming the benchmark.
- **RS‑Ratio < 100** → symbol is underperforming the benchmark.
- **RS‑Momentum > 100** → relative strength is improving (momentum picking up).
- **RS‑Momentum < 100** → relative strength is fading.
The four zones behave similar to classic RRG quadrants:
- **LEADING (lime/green background)**
- RS‑Ratio > 100 and RS‑Momentum > 100.
- Symbol is **stronger than the benchmark and momentum is strong**.
- This is where leadership typically resides.
- **WEAKENING (orange background)**
- RS‑Ratio > 100 and RS‑Momentum < 100.
- Still outperforming, but momentum is rolling over.
- Late‑stage leadership / time to be more selective and manage exits.
- **LAGGING (red background)**
- RS‑Ratio < 100 and RS‑Momentum < 100.
- Underperforming with weak momentum.
- Worst zone for aggressive longs.
- **IMPROVING (green background)**
- RS‑Ratio < 100 and RS‑Momentum > 100.
- Still weaker than benchmark, but momentum is improving.
- Early turnaround zone where future leaders often start.
The **white RS‑Signal line** is just a smoother of RS‑Ratio, helpful to visually see RS trend and crossovers.
***
## Practical trading use (RRG‑style workflow)
This indicator is designed as a **selection and context filter**, not a stand‑alone entry/exit system.
### 1. Sector and stock selection
1. Apply it to **sector indices** vs a broad benchmark (e.g., Nifty IT vs NIFTY 500, Nifty Auto vs NIFTY 500).
2. Focus on sectors where:
- The zone label is **IMPROVING → LEADING** over recent bars.
- RS‑Ratio is rising and staying above 100 in LEADING.
3. Then, on individual stocks inside those strong sectors, use the same benchmark and indicator:
- Prefer stocks that are also in **LEADING** (or just moved from **IMPROVING** into **LEADING**).
This recreates the essence of using RRG to find sectors/stocks with strong relative strength and momentum.
### 2. Combining with your price setup
Once a stock/sector passes the RS filter:
- Use your own price‑action / indicator rules for entries (EMA trends, VWAP pullbacks, breakouts, etc.).
- Example for longs:
- Only take long setups when:
- Sector index AND stock are in **LEADING** or newly from **IMPROVING → LEADING**, and
- Price is in an uptrend on your main chart (e.g., above 20/50 EMA, higher highs and higher lows).
### 3. Managing exits and rotation
- When a held symbol shifts from **LEADING → WEAKENING → LAGGING** and RS‑Momentum stays < 100, consider:
- Tightening stops.
- Partially booking profits.
- Rotating into other names still in LEADING / IMPROVING.
This mirrors how many investors use “sector rotation” and RRG to stay in stronger groups and reduce exposure in weakening ones.
***
## Disclaimers
- This script is for **educational and analytical purposes only** and is **not financial advice or a recommendation** to buy/sell any security.
- **Relative Rotation Graphs® / RRG®** and the four‑quadrant concept belong to **Julius de Kempenaer and RRG Research**; this Pine implementation is an independent, simplified adaptation for one symbol vs a benchmark and is **not an official RRG product or library**.

ROC Bot AlertsA rules-based momentum scalping framework for short-term index futures
This indicator is designed for traders who focus on fast-moving, intraday momentum opportunities—particularly on lower timeframes such as the 1-minute chart. It uses a structured combination of trend filters and short-term momentum tools to help identify potential continuation entries during active market conditions.
Core Concept
The tool evaluates price behavior relative to a dynamic trend line while measuring short-term rate-of-change and directional strength. When all components align, the indicator highlights moments where the market may be transitioning into or sustaining momentum in one direction. Conversely, when conditions deteriorate or momentum weakens, the indicator suppresses signals to reduce noise and avoid choppy environments.
This approach aims to provide buy/sell signals for scalping in trending or expanding-volatility conditions.
What the Indicator Uses
The system assesses several factors before confirming a potential momentum signal:
A dynamic trend filter to determine directional bias
A rate-of-change threshold to confirm short-term acceleration
A trend-strength component to avoid signals during low-energy or ranging conditions
A cooldown mechanism to prevent rapid, back-to-back signals in unsettled areas
Only when all conditions align does the indicator paint a long or short trigger on the chart.
Intended Use
This tool is best suited for:
- Active scalpers
- Intraday index futures traders (NQ, ES, GC, etc.)
- Short-duration momentum traders
- Traders who prefer clean, rules-based decision making
It is not designed for swing trading, long-term trend following, or counter-trend strategies.
How to Read the Signals
- Buy markers appear when trend, momentum, and strength all support upward continuation.
- Sell markers appear when these same factors align in the opposite direction.
- The 90-period trend line can be shown or hidden based on user preference, but it remains part of the decision framework internally.
- The user may optionally adjust the momentum threshold (ROC%) to suit different volatility environments.
Important Notes
Signals are generated only on completed bars.
As with all technical tools, this should be used alongside proper risk and trade management practices.

Confluence Engine [BullByte]CONFLUENCE ENGINE
Multi-Factor Technical Analysis Framework
OVERVIEW
Confluence Engine is a multi-dimensional technical analysis framework that evaluates market conditions across five distinct analytical pillars simultaneously. Rather than relying on a single indicator or signal source, this tool synthesizes Structure, Momentum, Volume, Volatility, and Pattern analysis into a unified scoring system that identifies high-probability trading opportunities when multiple technical factors align.
The core philosophy behind this indicator stems from a fundamental observation: isolated signals frequently fail, but when multiple independent analytical methods agree, the probability of a successful trade increases substantially. This indicator was developed after extensive research into why traders often receive conflicting signals from different indicators on their charts, leading to analysis paralysis and poor decision-making.
THE PROBLEM AND SOLUTION
The Problem:
Most traders use multiple indicators independently, often receiving contradictory signals. One indicator says "buy" while another says "wait." This creates confusion and leads to missed opportunities, premature entries based on incomplete analysis, difficulty quantifying how strong a setup actually is, and inconsistent decision-making across different market conditions.
The Solution:
Confluence Engine addresses this by providing a single, unified score (0-100) that represents the aggregate strength of a trading setup. Instead of mentally weighing five different indicators, traders receive a clear numerical score indicating setup quality, visual tier classification (ULTRA, HIGH, STANDARD), specific identification of which factors are strong or weak, and actionable guidance on what to watch for next.
THE FIVE ANALYTICAL DIMENSIONS
Each dimension was selected because it measures a fundamentally different aspect of market behavior:
STRUCTURE ANALYSIS
Evaluates price position relative to key levels and recent swing points. Markets respect structure - previous highs, lows, and areas where price reversed. This dimension identifies when price interacts with these critical levels and measures the quality of that interaction.
What it detects: Price approaching or sweeping swing highs/lows, reclaim patterns after false breakouts, EMA alignment and trend structure, exhaustion after extended moves.
MOMENTUM ANALYSIS
Measures the underlying strength and direction of price movement. Strong moves are characterized by momentum preceding price. This dimension evaluates whether momentum supports the current price direction.
What it detects: Oversold/overbought conditions with reversal potential, momentum divergence states, directional movement strength (ADX-based), momentum shifts before price confirmation.
VOLUME ANALYSIS
Volume validates price movement. Significant moves require participation. This dimension measures current volume relative to recent averages to determine if market participants are genuinely committing to the move.
What it detects: Volume spikes confirming price action, below-average volume warning of weak moves, climactic volume at potential reversals, volume confirmation of rejection patterns.
VOLATILITY ANALYSIS
Markets alternate between compression (low volatility) and expansion (high volatility). This dimension identifies these phases and recognizes when compression is likely to resolve into directional movement.
What it detects: Volatility squeeze conditions (Bollinger inside Keltner), squeeze release direction, ATR expansion indicating breakout potential, compression duration for timing breakouts.
PATTERN ANALYSIS
Candlestick patterns reflect the battle between buyers and sellers within each bar. This dimension evaluates the quality and context of reversal and continuation patterns.
What it detects: Engulfing patterns with quality scoring, hammer and shooting star formations, rejection wicks indicating trapped traders, pattern confluence with other factors.
WHAT MAKES THIS INDICATOR ORIGINAL Not a mashup
This is NOT a mashup of indicators displayed together. The Confluence Engine represents an integrated analytical framework with the following unique characteristics:
Unified Scoring System: All five dimensions feed into a proprietary scoring algorithm that weights and combines their signals. The output is a single 0-100 score, not five separate readings.
Multi-Factor Gate: Beyond just scoring, the system requires a minimum number of factors to be "active" (meeting their individual thresholds) before allowing signals. This prevents signals based on one extremely strong factor masking four weak ones.
Regime-Aware Adjustments: The engine detects the current market regime (trending, ranging, volatile, weak) and automatically adjusts factor weights and score multipliers. A structure signal means something different in a trending market versus a ranging market.
Adaptive Risk Management: Take-profit and stop-loss levels are not static. They adapt based on current volatility, market regime, and signal quality - providing tighter targets in low-volatility environments and wider targets when volatility expands.
Liquidity Sweep Detection: A distinctive feature that identifies when price has swept beyond a swing high/low and then reclaimed back inside. This pattern often indicates stop hunts followed by reversals.
Signal Quality Tiers: Rather than just "signal" or "no signal," the engine classifies setups into tiers. ULTRA (80+) represents highest probability setups with all factors aligned. HIGH (70-79) represents strong setups with multiple factors confirming. STANDARD meets minimum threshold for acceptable setups.
HOW THE SCORING WORKS
Each of the five factors generates a raw score from 0-100 based on current market conditions. These raw scores are then weighted according to the selected trading style (Balanced, Scalper, Swing, Range, Trend), adjusted based on current market regime detection, modified by higher timeframe alignment (if enabled), bonused when multiple factors exceed their activation thresholds simultaneously, and multiplied by session factors (if session filter is enabled).
The result is a final Bull Score and Bear Score, each ranging from 0-100, representing the current strength of long and short setups respectively.
Signal Generation Requirements:
- Score meets minimum threshold (configurable: 60-95)
- Required number of factors are "active" (default: 3 of 5)
- Market regime is not blocked (if blocking enabled)
- Higher timeframe alignment passes (if required)
- Cooldown period from last signal has elapsed
UNDERSTANDING THE DASHBOARDS
Main Dashboard (Top Right)
The main dashboard displays real-time scores and market context:
LONG Score - Current bullish setup strength (0-100) with quality tier displayed
SHORT Score - Current bearish setup strength (0-100) with quality tier displayed
Regime - Current market state showing TREND UP, TREND DN, VOLATILE, RANGE, or WEAK
HTF - Higher timeframe alignment showing BULL, BEAR, NEUT, or OFF
Squeeze - Volatility state showing SQZ (in squeeze), REL+ (bullish release), REL- (bearish release), or NORM
Gate - Factor count versus requirement, for example 4/3 means 4 factors active with 3 required
Sweep L/S - Liquidity sweep status for long and short setups
ATR% - Current ATR as percentile of recent range indicating relative volatility
Vol - Current volume relative to 20-period average
R:R - Current risk-reward ratio based on adaptive TP/SL calculations
Trade - Active trade status and unrealized profit/loss percentage
Analysis Dashboard (Bottom Left)
The analysis dashboard provides actionable guidance:
Signal Readiness - Visual progress bars showing how close each direction is to generating a signal
Blocking Factors - Identifies which specific factor is weakest and preventing signals
Recommended Action - Context-aware guidance such as WATCH, WAIT, MANAGE, or SCAN
Watch For - Specific events to monitor for setup completion
Opportunity Level - Overall market opportunity rating from EXCELLENT to VERY POOR
Timing - Contextual timing guidance based on current conditions
Status Bar (Bottom Center)
Compact view displaying Long Score, Gate Status, Current State, Gate Status, and Short Score in a single row for quick reference.
Dashboard Size - Auto Mode Explained
When Dashboard Size is set to "Auto", the indicator intelligently adjusts text size based on your current chart timeframe to optimize readability:
Auto-Sizing Logic:
1-Minute to 5-Minute Charts → Tiny
- Lower timeframes show more bars on screen
- Tiny text prevents dashboard from obscuring price action
- Recommended for scalping and high-frequency monitoring
15-Minute Charts → Small
- Balanced size for intraday trading
- Readable without being intrusive
1-Hour to Daily Charts → Normal
- Standard size for most trading styles
- Optimal readability for swing trading
Weekly and Monthly Charts → Large
- Larger text for position trading
- Fewer bars visible so space is available
Manual Override:
You can override auto-sizing for any dashboard individually:
- Dashboard Size (All): Sets master size applied to all dashboards
- Main Dashboard Size: Override for top-right dashboard specifically
- Analysis Panel Size: Override for bottom-left panel specifically
- Status Bar Size: Override for bottom-center bar specifically
Example Use Case:
Trading on 5m chart (default = Tiny) but you have good eyesight and large monitor:
- Set "Dashboard Size (All)" to "Small" or "Normal" for better readability
- Individual dashboards will use your override instead of auto-sizing
Recommendation:
Start with Auto mode and only adjust if dashboards are too large or too small for your monitor/eyesight.
UNDERSTANDING SIGNAL LABELS
When a signal generates, a label appears with trade information:
Minimal Style Example:
LONG 85
Shows tier icon, direction, and score only.
Detailed Style Example:
ULTRA LONG
Score: 85
Entry: 50250.50
TP1: 50650.25
TP2: 51500.75
SL: 49850.25
R:R 1:2.5
Regime: TREND UP
HTF: BULL
Tier Icons Explained:
indicates ULTRA quality with score 80 or higher
indicates HIGH quality with score between 70 and 79
indicates STANDARD quality with score meeting minimum threshold
UNDERSTANDING TRADE ZONES
When a signal generates, visual elements appear on the chart:
Entry Line (Purple) marks the entry price level
TP1 Line (Blue Dashed) marks the first take-profit target
TP2 Line (Cyan Dashed) marks the final take-profit target
SL Line (Orange Dotted) marks the stop-loss level
Trade Zone Box shows shaded area from SL to TP2
These elements extend forward as price progresses. When TP1 is hit, its line becomes solid to indicate achievement. When the trade completes at either TP2 or SL, all elements are cleaned up and the entry label converts to a compact ghost label for historical reference.
Exit Labels Explained:
+X.XX% indicates first target reached with partial profit secured
+X.XX% indicates full target reached with maximum profit achieved
-X.XX% indicates stop-loss triggered
TP1 Hit, SL... indicates stopped out after TP1 was already hit (optional display)
OPPOSITE SIGNAL HANDLING
When market conditions shift dramatically, the engine may generate a signal in the opposite direction while an existing trade is active. This represents a significant change in confluence and is handled automatically:
Automatic Trade Reversal Process:
1. Detection: New signal triggers opposite to current trade direction (e.g., SHORT signal while LONG trade is active)
2. Current Trade Closure:
- All visual elements (entry line, TP/SL lines, trade zone) are deleted
- Current trade is marked as closed
3. Entry Label Conversion:
- The detailed entry label is converted to a compact ghost label
- Ghost label shows direction + score (e.g., "LONG 75")
- Marked with "OPP" outcome to indicate opposite signal closure
- Moved to a non-interfering position below/above price
4. New Trade Initialization:
- Fresh entry label created for new direction
- New TP1, TP2, SL levels calculated based on new signal quality
- Trade zone and price lines drawn for new trade
Example Scenario:
You enter a LONG trade at score 72. Price moves sideways for 8 bars, then market structure breaks down. Confluence shifts heavily bearish with a sweep reclaim bear + momentum + volume spike, generating a SHORT signal at score 81. The engine automatically:
- Closes the LONG trade
- Converts "LONG 72" entry label to a small ghost label
- Opens new SHORT trade at current price
- Displays new SHORT entry label with full trade details
Trading Implication:
This behavior ensures the engine is always aligned with the highest-probability direction based on current confluence. It prevents you from holding a position when all five factors have flipped against you.
Note: This does NOT happen for every small score change. The opposite signal must meet all signal generation requirements (minimum score, gate pass, regime check, HTF alignment) before triggering. Typically occurs during strong trend reversals or major support/resistance breaks.
EXAMPLE TRADE : LONG
Instrument and Exchange: Bitcoin / TetherUS (BTC/USDT) on Binance
Timeframe: 5-minute
Timestamp: Nov 27, 2025 12:39 UTC
Indicator Script: Confluence Engine v1.0
Trade Type: Long (Example Trade)
Setting Used: Default
Signal Details:
- Tier: HIGH
- Score: 70
- Entry Price: 90040.70
- TP1 Target: 90868.63
- TP2 Target: 92110.52
- Stop Loss: 89325.94
- Risk Reward: 1:2.9
Trade Outcome:
- TP1 hit after 12 bars (+0.95%)
- TP2 hit after 28 bars (+2.85%)
- Total gain: +2.85% on full position
EXAMPLE TRADE : SHORT with Dashboard Explanation and interpretation
Instrument and Exchange: Ethereum / U.S. Dollar (ETH/USD) — Coinbase
Timeframe: 1-hour
Timestamp (screenshot): Nov 28, 2025 16:41 UTC
Indicator Script: Confluence Engine v1.0
Trade Type: Short (Example Trade)
Setting Used: Default
Signal Details
-Tier: STANDARD (STD)
-Score: 64
-Entry Price: 3037.26
-TP1 Target: 2981.61 (-55.65 pts)
-TP2 Target: 2898.12 (-139.14 pts)
-Stop Loss: 3099.79 (+62.53 pts)
-Risk:Reward: ≈ 1 : 2.2 (TP2/SL)
-Market Context at Signal
-Regime: TREND UP (contextual regime at time of signal) — mixed environment for shorts
-HTF Alignment: OFF (no higher-timeframe confirmation)
-Gate Status: 3 / 3 (minimum factor groups active — gate passed)
-Squeeze Status: NORM (no active compression breakout)
-Volume: ~1.8× average (elevated participation)
-ATR%: 57% (elevated volatility)
Analysis Dashboard Reading (what the user sees)
-Long Readiness: Needs +36 points to qualify.
-Short Readiness: Needs +11 points to qualify (closer but not auto-entering).
-Blocking Factors: Structure = 0 — the single decisive blocker preventing fresh signals.
-Opportunity Level: VERY POOR (roughly 20 / 100) — low quality environment for adding positions.
-Timing: Wait for better setup (do not add new positions).
-Trade Outcome (screenshot moment)
-Trade state: Active SHORT (opened earlier).
-Live P&L (snapshot): +0.14% (managing trade).
-TP1/TP2: Targets shown on chart (TP1 2981.61, TP2 2898.12). Not closed yet at screenshot.
-Visuals: Entry label, TP/SL lines and trade zone are displayed and being extended while trade is active.
Interpretation
The engine produced a standard short (Score 64) while the market showed elevated volume and volatility but no HTF confirmation. Although the Gate passed (3/3), Structure = 0 blocks the indicator from issuing fresh entries — this is intentional and by design: one missing factor (structure) is enough to prevent new signals even when other factors look supportive. The currently open short is being managed (partial targets and SL visible), but the system's recommendation is to manage the existing trade only and not open new shorts until structure or HTF alignment improves.
Why this example matters (teaching point)
-Gate ≠ Go: Gate pass (factor count) alone does not force fresh trades — the system enforces additional checks (structure, regime, HTF) to avoid lower-quality setups.
-Volume & Volatility are necessary but not sufficient: High volume and wide ATR create movement but do not replace structural validation.
-Active trade vs new entries: The script will continue to manage an already open trade but will not create a new signal while a blocking factor remains. This prevents overtrading and reduces false positives.
-Practical trader actions shown by the example
-Manage existing SHORT only: Trail to breakeven if TP1 is taken; scale out at TP1; hold remaining if price respects trend and structure reclaims.
-Do not add fresh positions: Wait for Structure > 0 or a HTF alignment that lifts the block.
-Watch for signals that matter: Sweep reclaim, HTF alignment turning bullish for shorts (i.e., HTF changes to BEAR), or a squeeze release with volume spike — these can clear the blocker and validate new entries.
RECOMMENDED TIMEFRAMES
For Scalping on 1m, 5m, or 15m charts: Use higher factor thresholds and shorter cooldowns. The faster pace requires stricter filtering.
For Day Trading on 15m, 30m, or 1H charts: This provides a balance of signal frequency and reliability suitable for most active traders.
For Swing Trading on 1H, 4H, or Daily charts: Expect higher quality signals with longer hold periods and fewer false signals.
For Position Trading on Daily or Weekly charts: Focus on ULTRA signals only for maximum conviction on longer-term positions.
Higher Timeframe Alignment Recommendations:
When trading 5m, use 1H as your HTF
When trading 15m, use 1H or 4H as your HTF
When trading 1H, use 4H or Daily as your HTF
When trading 4H, use Daily as your HTF
The general rule is to select an HTF that is 4 to 12 times your trading timeframe.
TRADING STYLE PRESETS
Balanced (Default)
Equal weighting across all five factors at 20% each. Suitable for most market conditions and recommended as starting point.
Scalper
Emphasizes Volume at 30% and Volatility at 30%. Designed for quick in-and-out trades on lower timeframes where immediate momentum and volatility expansion matter most.
Swing Trader
Emphasizes Structure at 30% and Momentum at 30%. Focuses on catching larger moves where trend direction and key levels are paramount.
Range Trader
Emphasizes Structure at 35% and Pattern at 25%. Optimized for sideways markets where support/resistance levels and reversal patterns dominate.
Trend Follower
Emphasizes Momentum at 40%. Designed for trending markets where staying with the dominant direction is the priority.
QUALITY MODE SETTINGS
Custom Mode
Set your own minimum score threshold. Lower thresholds between 60 and 65 generate more signals but with lower average quality. Higher thresholds of 75 or above generate fewer but higher-quality signals.
High Quality Mode
Uses minimum score of 70. Recommended for most users as it filters out marginal setups while still providing reasonable signal frequency.
Ultra Only Mode
Uses minimum score of 80 for maximum selectivity. Only the highest-conviction setups generate signals. Recommended for swing and position traders or during uncertain market conditions.
REGIME DETECTION
The engine continuously evaluates market conditions and classifies them into five states:
TREND UP
Characteristics: Strong ADX reading with EMAs aligned in bullish order
Trading Implications: Long signals receive score boost while short signals are suppressed. Momentum factor gains additional weight.
TREND DN
Characteristics: Strong ADX reading with EMAs aligned in bearish order
Trading Implications: Short signals receive score boost while long signals are suppressed. Momentum factor gains additional weight.
VOLATILE
Characteristics: High ATR percentile, wide Bollinger Bands, elevated volume
Trading Implications: Both directions remain viable but wider stops are recommended. Volume factor gains additional weight.
RANGE
Characteristics: Low ADX reading, narrow Bollinger Bands, low ATR percentile
Trading Implications: Structure signals are emphasized while momentum signals are suppressed. Pattern recognition becomes more important.
WEAK
Characteristics: Unclear or mixed conditions that do not fit other categories
Trading Implications: Reduced confidence in all signals. Consider waiting for clearer market conditions.
Filter Mode Options:
Off - Regime is detected and displayed but no score adjustments are applied
Adjust Scores - Automatically modifies factor weights based on current regime
Block Weak Regimes - Prevents signals from generating when regime is RANGE or WEAK
VOLATILITY SQUEEZE DETECTION
A volatility squeeze occurs when Bollinger Bands contract inside the Keltner Channel, indicating reduced volatility and potential energy building for a breakout.
Squeeze States Explained:
SQZ with bar count (example: SQZ 15)
Indicates currently in squeeze for the displayed number of bars. A score penalty is applied during this phase because compression represents uncertainty about direction.
REL+ (Release Bullish)
Indicates squeeze has released with price above the basis line. Score bonus is applied for long setups as this often precedes strong upward moves.
REL- (Release Bearish)
Indicates squeeze has released with price below the basis line. Score bonus is applied for short setups as this often precedes strong downward moves.
NORM (Normal)
No active squeeze detected. Standard scoring applies.
Trading Implication:
Squeeze releases often produce strong directional moves. The engine detects both the squeeze duration and the release direction, awarding bonus points to signals that align with the release. Longer squeeze duration often corresponds to more powerful breakouts.
LIQUIDITY SWEEP DETECTION
Markets often sweep beyond obvious support and resistance levels to trigger stops before reversing. The engine detects these patterns:
Bullish Sweep Reclaim
Price sweeps below recent swing low, triggering stop losses, then reclaims back above the swing low. This often indicates smart money accumulation after retail stops are collected.
Bearish Sweep Reclaim
Price sweeps above recent swing high, triggering stop losses, then reclaims back below the swing high. This often indicates smart money distribution after retail stops are collected.
Sweep Status in Dashboard:
RCL (Reclaim) - Reclaim has been confirmed. This receives highest structure score as the pattern is complete.
PND (Pending) - Sweep has occurred and price is near the level but full reclaim not yet confirmed. Watching for completion.
ACT (Active) - Sweep is currently in progress with price beyond the swing level.
Dash (-) - No sweep activity detected.
MULTI-FACTOR GATE SYSTEM
Beyond overall score, the engine counts how many individual factors meet their activation threshold.
Example Calculation:
Structure score 45 with threshold 35 equals ACTIVE
Momentum score 25 with threshold 30 equals INACTIVE
Volume score 50 with threshold 35 equals ACTIVE
Volatility score 40 with threshold 30 equals ACTIVE
Pattern score 35 with threshold 30 equals ACTIVE
Result: 4 of 5 factors are active
If minimum required factors is set to 3, this example passes the gate and receives a 4-factor bonus.
Gate Bonuses:
4 factors active adds 8 points to final score (default setting)
5 factors active adds 15 points to final score (perfect confluence)
Purpose:
This mechanism prevents scenarios where one extremely high factor score masks four weak factors. A score of 75 with only 2 active factors is less reliable than a score of 70 with 4 active factors.
ADAPTIVE RISK MANAGEMENT
Take-profit and stop-loss distances adjust dynamically based on three inputs:
Volatility Influence (default 40% weight)
Low ATR percentile produces tighter targets
High ATR percentile produces wider targets
This ensures stops are not too tight in volatile conditions or too wide in calm conditions.
Regime Influence (default 30% weight)
Trending market with aligned signal produces extended targets
Ranging market produces contracted targets
Volatile regime produces wider stops for protection
Score Influence (default 30% weight)
ULTRA signals (high conviction) receive extended targets
STANDARD signals receive standard targets
Higher conviction justifies larger profit expectations.
You can configure the weight of each influence in settings to match your trading style.
SESSION FILTER (Optional Feature)
When enabled, the engine applies score multipliers based on the trading session:
Asian Session (default 0.9x multiplier)
Characterized by lower volatility and ranging tendency. Score reduction reflects reduced opportunity.
London Session (default 1.1x multiplier)
Characterized by high volatility and trend initiation. Score boost reflects increased opportunity.
London/NY Overlap (default 1.2x multiplier)
Characterized by highest liquidity and strongest moves. Maximum score boost reflects peak trading conditions.
New York Session (default 1.05x multiplier)
Characterized by volatility but typically after initial moves have occurred.
Configure your UTC offset in settings to align session detection with your chart timezone.
ALERT SYSTEM
The indicator provides comprehensive alerts with dynamic data:
Signal Alerts:
- ULTRA Long Signal with full trade details
- ULTRA Short Signal with full trade details
- HIGH Long Signal with key levels
- HIGH Short Signal with key levels
- Any Long Signal with basic info
- Any Short Signal with basic info
Trade Management Alerts:
- TP1 Reached with profit percentage
- TP2 Full Target with total profit
- Stop Loss Hit with loss percentage and status
Technical Event Alerts:
- Squeeze Release
- Liquidity Sweep
- Perfect Confluence
- Regime Change
All alerts include actual calculated values such as score, entry price, target levels, stop level, and risk-reward ratio at the time of trigger.
AUTOMATIC SETTINGS VALIDATION
The indicator performs comprehensive validation when first loaded on a chart. If configuration errors are detected, a warning label appears on the chart with specific guidance.
Critical Errors (Prevent Signal Generation):
ULTRA threshold must exceed HIGH threshold
- Example error: HIGH = 75, ULTRA = 70
- Fix: Ensure ULTRA threshold is higher than HIGH threshold
- Default safe values: HIGH = 70, ULTRA = 80
Minimum factors cannot exceed 5
- The gate requires 3 to 5 factors (you cannot require 6 of 5 factors)
- Fix: Set minimum active factors to 3, 4, or 5
TP2 multiplier must exceed TP1 multiplier
- Example error: TP1 = 3.0 ATR, TP2 = 2.0 ATR
- Fix: Ensure TP2 (final target) is farther than TP1 (partial target)
- Default safe values: TP1 = 2.0, TP2 = 5.0
Swing lookback minimum is 3 bars
- Liquidity sweep detection requires at least 3 bars to identify swing highs/lows
- Fix: Increase swing lookback period to 3 or higher
ATR period minimum is 5 bars
- ATR calculation requires sufficient data for accuracy
- Fix: Increase ATR period to 5 or higher (14 recommended)
Higher timeframe must be larger than chart timeframe
- Example error: Trading on 1H chart with MTF set to 15m
- Fix: Select HTF that is 4-12x your chart timeframe
- Example: If trading 15m, use 1H or 4H as HTF
Warnings (Signal Generation Continues):
Score threshold below 50 generates many signals
- Lower thresholds increase signal frequency but reduce quality
- Recommendation: Use minimum 60 for active trading, 70+ for swing trading
Cooldown below 3 bars may cause signal clustering
- Very short cooldowns can produce multiple signals in quick succession
- Recommendation: Use 5+ bars for lower timeframes, 3+ for higher timeframes
Validation Label Display:
When errors are detected, a label appears at the top of the chart showing:
SETTINGS QUICK REFERENCE
Signal Quality Section:
Quality Mode: High Quality recommended for most users
Custom Minimum Score: Used when Quality Mode is set to Custom (range 30-95)
HIGH Threshold: Score required for HIGH tier classification (default 70)
ULTRA Threshold: Score required for ULTRA tier classification (default 80)
Regime Engine Section:
Enable Regime Detection: Activates automatic market state classification
Filter Mode: Off, Adjust Scores, or Block Weak Regimes
ADX Strong Threshold: ADX level indicating strong trend (default 25)
ADX Weak Threshold: ADX level indicating ranging conditions (default 15)
Show Regime Background: Displays subtle background color for current regime
Liquidity and Squeeze Section:
Enable Liquidity Sweep Detection: Activates sweep and reclaim pattern detection
Swing Lookback Period: Bars used to identify swing highs and lows (default 8)
Reclaim Threshold: Percentage of range price must reclaim after sweep (default 15%)
Enable Volatility Squeeze Detection: Activates Bollinger/Keltner squeeze detection
Keltner Channel Multiplier: Width multiplier for Keltner Channel (default 1.5)
Squeeze Penalty: Points subtracted during active squeeze (default 25)
Squeeze Release Bonus: Points added on squeeze release (default 20)
Enable Multi-Factor Gate: Requires minimum factors active before signaling
Minimum Active Factors: How many factors must meet threshold (default 3)
Individual Factor Thresholds: Customize activation threshold for each factor
4-Factor Bonus: Points added when 4 of 5 factors active (default 8)
5-Factor Bonus: Points added when all 5 factors active (default 15)
MTF Confluence Section:
Enable MTF Confluence: Activates higher timeframe trend analysis
Higher Timeframe: Select timeframe for trend alignment (recommend 4-12x chart TF)
Require HTF Alignment: Block signals opposing higher timeframe trend
Show HTF EMAs: Display higher timeframe EMA 21 and EMA 50 on chart
Trading Style Section:
Enable Style Weighting: Activates factor weight adjustments based on style
Trading Style: Balanced, Scalper, Swing Trader, Range Trader, or Trend Follower
Custom Weights: Individual weight sliders when fine-tuning is needed
Session Filter Section:
Enable Session Filter: Activates session-based score multipliers
Your UTC Offset: Your timezone offset for accurate session detection
Session Multipliers: Individual multipliers for Asian, London, New York, and Overlap sessions
Risk Parameters Section:
ATR Period: Period for Average True Range calculation (default 14)
TP1 ATR Multiple: First target distance as ATR multiple (default 2.0)
TP2 ATR Multiple: Final target distance as ATR multiple (default 5.0)
SL ATR Multiple: Stop loss distance as ATR multiple (default 2.0)
Enable Adaptive TP/SL: Activates dynamic adjustment based on conditions
Volatility Weight: Influence of ATR percentile on adaptive calculation (default 40%)
Regime Weight: Influence of market regime on adaptive calculation (default 30%)
Score Weight: Influence of signal score on adaptive calculation (default 30%)
Appearance Section:
Color Theme: Matrix (green/red), Dark (modern dark), or Light (clean light)
Label Detail: Minimal (score only), Standard (key info), or Detailed (full breakdown)
Dashboard Size Controls: Master size and individual overrides for each dashboard
Show Trade Zones: Display shaded box from SL to TP2 for active trades
Show TP/SL Labels: Display price labels on target and stop lines
Show Trailing Exit Labels: Display exit label when stopped after TP1 hit
Show Main Dashboard: Toggle main dashboard visibility (top right)
Show Analysis Dashboard: Toggle analysis panel visibility (bottom left)
Show Status Bar: Toggle compact status bar visibility (bottom center)
Performance Section:
Performance Mode: Reduces visual elements on lower timeframes automatically
Max Ghost Labels: Maximum historical signal labels to retain (default 50)
Signal Cooldown: Minimum bars between signals in same direction (default 5)
Enable Script Alerts: Controls whether alert() calls fire automatically (default ON)
- ON: Dynamic alerts with calculated values fire automatically
- OFF: alert() suppressed, alertcondition() still available for manual creation
- Use OFF when testing settings or monitoring multiple instruments visually
- Toggle per-chart for selective alert coverage across watchlist
Show Factor Markers: Display shapes on chart when 3, 4, or 5 factors align
Show Score Breakdown: Display detailed factor scores table in debug panel
Show Regime Debug: Display regime state and ADX value in debug panel
Show MTF Debug: Display higher timeframe status in debug panel
DEBUG MODE AND FACTOR MARKERS
The indicator includes optional debug tools for traders who want deeper insight into the scoring mechanics and factor analysis. These features are disabled by default to keep the chart clean but can be enabled in the Debug Mode settings group.
FACTOR MARKERS
When "Show Factor Markers" is enabled, visual shapes appear on the chart indicating confluence states:
Perfect Confluence (5/5 Factors Active)
A circle appears below the bar for bullish or above the bar for bearish setups. This represents maximum confluence where all five analytical dimensions meet their activation thresholds simultaneously. A small label showing "5/5" also appears. This is a rare occurrence and typically precedes the highest quality signals. Background color shifts to highlight this exceptional alignment.
Strong Confluence (4/5 Factors Active)
A diamond shape appears below the bar for bullish or above the bar for bearish setups. This represents strong confluence with four of five factors active. A label showing "4/5" appears when this state is first achieved. This level of confluence is associated with high-quality setups.
Ready Confluence (3/5 Factors Active)
A triangle appears below the bar (pointing up) for bullish or above the bar (pointing down) for bearish setups. This represents the minimum confluence level required when gate is set to 3 factors. No label appears for this level to reduce visual clutter.
Confluence Background
When factor markers are enabled, a subtle background color appears indicating the current confluence state. Stronger colors indicate higher confluence levels. Bullish confluence shows green tints while bearish confluence shows red tints.
Purpose of Factor Markers:
These markers help traders visualize when confluence is building before a signal triggers. You might see a 4/5 diamond appear one or two bars before the actual signal, giving you advance notice that conditions are aligning. This can help with preparation and timing.
DEBUG PANEL (Bottom Right)
When any debug option is enabled, a debug panel appears in the bottom right corner of the chart providing detailed scoring information.
Score Breakdown Table
When "Show Score Breakdown" is enabled, the panel displays:
Factor column showing Structure, Momentum, Volume, Volatility, and Pattern
Bull column showing raw score (0-100) for each bullish factor
Bear column showing raw score (0-100) for each bearish factor
Weight column showing current percentage weight for each factor
Below the factor rows :
FINAL row shows the calculated final Bull and Bear scores after all adjustments
Adj row shows total adjustments applied including gate bonus, squeeze adjustment, and exhaustion adjustment with positive or negative sign
This breakdown allows you to see exactly which factors are contributing to the score and which are lagging. If you notice Structure consistently low, you know to wait for better price positioning relative to swing levels.
Regime Debug
When "Show Regime Debug" is enabled, the panel displays:
Current regime state (TREND UP, TREND DN, VOLATILE, RANGE, WEAK)
Current ADX value driving the regime classification
This helps you understand why certain score adjustments are being applied and verify the regime detection is working as expected for current market conditions.
MTF Debug
When "Show MTF Debug" is enabled, the panel displays:
Current MTF alignment status (BULL, BEAR, NEUT)
The higher timeframe being analyzed
This confirms the higher timeframe data is being read correctly and shows you the trend bias from the larger timeframe perspective.
Using Debug Mode Effectively
For Learning: Enable all debug options when first using the indicator to understand how scores are calculated and what drives signal generation.
For Optimization: Use score breakdown to identify which factors are consistently weak in your chosen market and timeframe. This can inform whether to adjust factor thresholds or switch trading styles.
For Troubleshooting: If signals seem inconsistent, enable debug to see exactly what values the engine is working with. This helps identify if a specific factor is behaving unexpectedly.
For Live Trading: Disable debug features to keep chart clean and reduce visual distraction. The main dashboards provide sufficient information for trade execution.
Debug Settings Summary:
Show Factor Markers - Displays shapes on chart when 3, 4, or 5 factors align. Useful for seeing confluence build before signals trigger.
Show Score Breakdown - Displays detailed table with all raw factor scores, weights, and adjustments. Useful for understanding exactly how final score is calculated.
Show Regime Debug - Adds regime state and ADX value to debug panel. Useful for verifying regime detection accuracy.
Show MTF Debug - Adds higher timeframe status and timeframe to debug panel. Useful for confirming MTF data is loading correctly.
PERFORMANCE CONSIDERATIONS
On lower timeframes such as 1-minute and 5-minute charts, the indicator creates visual elements including labels, lines, and boxes that may impact performance on slower devices.
Performance Mode automatically reduces visual elements, optimizes calculation frequency, and limits historical ghost labels when enabled.
Configure Max Ghost Labels (default 50) to control how many historical signal labels are retained on the chart.
NON-REPAINTING DESIGN
Signal Integrity:
All entry and exit signals generate only on confirmed (closed) bars using barstate.isconfirmed checks. This ensures signals do not appear and disappear during bar formation.
Higher Timeframe Data:
MTF analysis uses request.security with lookahead disabled (barmerge.lookahead_off) to prevent future data from influencing current calculations.
Visual Elements:
Lines, boxes, and labels for active trades update in real-time for monitoring purposes but this visual updating does not affect signal generation logic. Entry decisions are made solely on confirmed bar data.
DISCLAIMER
Trading financial instruments involves substantial risk of loss and is not suitable for all investors. Past performance does not guarantee future results. This indicator is a technical analysis tool provided for educational purposes only. It does not constitute financial advice, trading recommendations, or solicitation to buy or sell any financial instrument.
The developer makes no representations regarding the accuracy of signals or the profitability of trading based on this indicator. Users assume full responsibility for their trading decisions and should conduct their own analysis before entering any trade.
Always use proper risk management. Never risk more than you can afford to lose. Consider consulting a qualified financial advisor before making trading decisions.
VERSION HISTORY
v1.0 - Initial Release
- Five-factor confluence scoring system
- Regime detection and automatic adaptation
- Liquidity sweep and reclaim detection
- Volatility squeeze state machine
- Multi-factor gate with bonus system
- Adaptive risk management
- Comprehensive alert system
- Three dashboard display panels
- Session filter with multipliers
- Multiple trading style presets
- Theme customization options
Developed by BullByte
Pine Script v6
2025

Dynamic Momentum OscillatorDescription:
The Dynamic Momentum Oscillator is a statistically-driven momentum tool that goes beyond traditional oscillators. Instead of using raw price, it analyzes the momentum of a DEMA (Double Exponential Moving Average) itself, creating a smoother, more refined signal. Its innovative approach incorporates volatility-weighted z-scoring, allowing the indicator to automatically adjust its sensitivity based on market conditions, helping to identify both the strength and sustainability of momentum shifts.
🔍 How It Works:
DEMA Momentum Core: The indicator first calculates a DEMA of the price. It then analyzes the momentum of this DEMA, effectively creating a "momentum of momentum" measure that filters out market noise.
Volatility-Adaptive Z-Score: The core signal is a statistical z-score, which measures how many standard deviations the DEMA is from its mean. This tells you not just the direction, but the statistical significance of the move.
Dynamic Volatility Weighting: The unique addition is a normalized standard deviation component that weights the z-score. In high volatility periods, this amplifies the signal, making strong trends more pronounced. In low volatility, it provides a more muted, conservative output.
🎯 Interpreting the Oscillator:
Zero Line: The baseline. Momentum is considered neutral here.
Orange Histogram (Above Zero): Indicates bullish momentum. The further the bar extends above zero, the stronger and more statistically significant the bullish momentum.
Purple Histogram (Below Zero): Indicates bearish momentum. The further the bar extends below zero, the stronger and more statistically significant the bearish momentum.
Signal Strength: The height of the histogram bars reflects the combined momentum and volatility, giving you a direct visual gauge of momentum strength.
⚙️ Input Parameters (Group: Core Settings):
DEMA Length: The period for the primary Double Exponential Moving Average.
Standard Deviation Length: The lookback period for calculating volatility and the z-score.
StDev Weight: Controls the influence of volatility on the final signal (0.1 = minimal, 1.0 = maximum). Adjust this to fine-tune the indicator's responsiveness.
By focusing on the statistical properties of price momentum, the Dynamic Momentum Oscillator offers a unique lens for pinpointing high-probability trend continuations and reversals. It's a powerful tool for traders who appreciate quantitative methods.

Multi Pivot Trend [BigBeluga]🔵 OVERVIEW
The Multi Pivot Trend is an advanced market-structure-driven trend engine that evaluates trend strength by scanning multiple pivot breakouts simultaneously.
Instead of relying on a single swing length, it tracks breakouts across ten increasing pivot lengths — then averages their behavior to produce a smooth, reliable trend reading.
Mitigation logic (close, wick, or HL2 touches) controls how breakouts are confirmed, giving traders institutional-style flexibility similar to BOS/CHoCH validation rules.
This indicator not only colors candles based on trend strength, but also extends trend strength and volatility-scaled projection candles to show where trend pressure may expand next.
Pivot breakout lines and labels mark key changes, making the trend transitions extremely clear.
🔵 CONCEPTS
Market trend strength is reflected by multiple pivot breakouts, not just one.
The indicator analyzes ten pivot structures from smaller to larger swings.
Each bullish or bearish pivot breakout contributes to trend score.
Mitigation options (close / wick / HL2) imitate smart-money breakout confirmation logic.
Trend score is averaged and translated into colors and extension bars.
Neutral regime ≈ weak trend or transition zone (trend compression).
🔵 FEATURES
Multi-Pivot Engine — tracks 10 pivot-based trend signals simultaneously.
Mitigation Modes :
• Close — breakout requires candle close beyond pivot
• Wicks — breakout requires wick violation
• HL2 — breakout confirmed when average (H+L)/2 crosses level
Dynamic Color System :
• Blue → confirmed bullish rotation
• Red → confirmed bearish rotation
• Orange → neutral / transition state
Breakout Visualization — draws pivot breakout lines in real-time.
Trend Labels — prints trend %.
Trend Volatility-Scaled Extension Candles — ATR/trend strength based candle projections show momentum continuation strength.
Gradient Pivot Encoding — higher pivot lengths = deeper structure considered.
🔵 HOW TO USE
Use strong blue/red periods to follow dominant structural trend.
Watch for color transition into orange — possible trend change or consolidation.
Pivot breakout lines help validate structure shifts without clutter.
Wick mitigation catches aggressive liquidity-sweep based breaks.
Close/HL2 mitigation catches cleaner market structure rotations.
Extension bars visualize trend pressure — large extensions = strong push.
Best paired with volume or volatility confirmation tools.
🔵 CONCLUSION
The Multi Pivot Trend is a structural trend recognition system that blends multiple pivot breakouts into one clean trend score — with institutional-style mitigation logic and volatility-projected trend extensions.
It gives traders a powerful, visually intuitive way to track momentum, spot trend rotations early, and understand true structural flow beyond simple MA-based approaches.
Use it to stay aligned with the dominant swing direction while avoiding noise and false flips.

Bollinger Band ToolkitBollinger Band Toolkit
An advanced, adaptive Bollinger Band system for traders who want more context, precision, and edge.
This indicator expands on the classic Bollinger Bands by combining statistical and volatility-based methods with modern divergence and squeeze detection tools. It helps identify volatility regimes, potential breakouts, and early momentum shifts — all within one clean overlay.
🔹 Core Features
1. Adaptive Bollinger Bands (σ + ATR)
Classic 20-period bands enhanced with an ATR-based volatility adjustment, making them more responsive to true market movement rather than just price variance.
Reduces “overreacting” during chop and avoids bands collapsing too tightly during trends.
2. %B & RSI Divergence Detection
🟢 Green dots: Positive %B divergence — price makes a lower low, but %B doesn’t confirm (bullish).
🔴 Red dots: Negative %B divergence — price makes a higher high, but %B doesn’t confirm (bearish).
✚ Red/green crosses: RSI divergence confirmation — momentum fails to confirm the price’s new extreme.
These signals highlight potential reversal or slowdown zones that are often invisible to the naked eye.
3. Bollinger Band Squeeze (with Volume Filter)
Yellow squares (■) show periods when Bollinger Bands are at their narrowest relative to recent history.
Volume confirmation ensures the squeeze only triggers when both volatility and participation contract.
Often marks the “calm before the storm” — breakout potential zones.
4. Multi-Timeframe Breakout Markers
Optionally displays breakouts from higher or lower timeframes using different colors/symbols.
Lets you see when a higher timeframe band break aligns with your current chart — a strong trend continuation signal.
5. Dual- and Triple-Band Visualization (±1σ, ±2σ, ±3σ)
Optional inner (±1σ) and outer (±3σ) bands provide a layered volatility map:
Price holding between ±1σ → stable range / mean-reverting behavior
Price riding near ±2σ → trending phase, sustained momentum
Price touching or exceeding ±3σ → volatility expansion or exhaustion zone
This triple-band layout visually distinguishes normal movement from statistical extremes, helping you read when the market is balanced, expanding, or approaching its limits.
⚙️ Inputs & Customization
Choose band type (SMA/EMA/SMMA/WMA/VWMA)
Adjust deviation multiplier (σ) and ATR multiplier
Toggle individual features (divergence dots, squeeze markers, inner bands, etc.)
Multi-timeframe and colour controls for advanced users
🧠 How to Use
Watch for squeeze markers followed by a breakout bar beyond ±2σ → volatility expansion signal.
Combine divergence dots with RSI or price structure to anticipate slowdowns or reversals.
Confirm direction using multi-timeframe breakouts and volume expansion.
💬 Why It Works
This toolkit transforms qualitative chart reading (tight bands, hidden divergence) into quantitative, testable conditions — giving you objective insights that can be backtested, coded, or simply trusted in live setups.

Consecutive Candles CounterThe Consecutive Candles Counter is a simple yet powerful indicator designed to help traders identify and analyze consecutive red or green candle patterns on any timeframe. This tool automatically counts unbroken streaks of bullish or bearish candles within your specified date range, making it easier to spot momentum trends and potential reversal points.
Key Features
Dual Mode Tracking: Toggle between counting consecutive red (bearish) or green (bullish) candles with a single click
Custom Date Range: Set specific start and end dates to analyze historical patterns or focus on recent price action
Visual Streak Display: Clean line graph showing the progression of consecutive candles over time
Real-Time Information Table: Displays current streak count, candle type, and date range status at a glance
Customizable Interface:
Show/hide the information table
Adjust table size from Tiny to Huge
Color-coded visuals (red for bearish, green for bullish)
Works on All Timeframes: Optimized for daily charts but functions on any timeframe
How It Works
The indicator monitors each candle's close price relative to its open price:
Red Candle: Close < Open (bearish)
Green Candle: Close > Open (bullish)
When consecutive candles of the selected type appear, the counter increases. The streak resets to zero when:
An opposite color candle appears
The price action moves outside your specified date range
Use Cases
Momentum Trading: Identify extended runs of bullish or bearish candles that may signal strong trends
Reversal Detection: Spot when consecutive streaks end, potentially indicating trend exhaustion
Pattern Analysis: Study historical consecutive candle patterns to understand market behavior
Risk Management: Recognize when a trend might be overextended
Backtesting: Test strategies based on consecutive candle counts within specific date ranges

Yelober - Market Internal direction+ Key levelsYelober – Market Internals + Key Levels is a focused intraday trading tool that helps you spot high-probability price direction by anchoring decisions to structure that matters: yesterday’s RTH High/Low, today’s pre-market High/Low, and a fast Value Area/POC from the prior session. Paired with a compact market internals dashboard (NYSE/NASDAQ UVOL vs. DVOL ratios, VOLD slopes, TICK/TICKQ momentum, and optional VIX trend), it gives you a real-time read on breadth so you can choose which direction to trade, when to enter (breaks, retests, or fades at PMH/PML/VAH/VAL/POC), and how to plan exits as internals confirm or deteriorate. On top of these intraday decision benefits, it also allows traders—in a very subtle but powerful way—to keep an eye on the VIX and immediately recognize significant spikes or sharp decreases that should be factored in before entering a trade, or used as a quick signal to modify an existing position. In short: clear levels for the chart, live internals for the context, and a smarter, rules-based path to execution.
# Yelober – Market Internals + Key Levels
*A TradingView indicator for session key levels + real‑time market internals (NYSE/NASDAQ TICK, UVOL/DVOL/VOLD, and VIX).*
**Script name in Pine:** `Yelober - Market Internal direction+ Key levels` (Pine v6)
---
## 1) What this indicator does
**Purpose:** Help intraday traders quickly find high‑probability reaction zones and read market internals momentum without switching charts. It overlays yesterday/today’s **automatic price levels** on your active chart and shows a **market breadth table** that summarizes NYSE/NASDAQ buying pressure and TICK direction, with an optional VIX trend read.
### Key features at a glance
* **Automatic Price Levels (overlay on chart)**
* Yesterday’s High/Low of Day (**yHoD**, **yLoD**)
* Extended Hours High/Low (**yEHH**, **yEHL**) across yesterday AH + today pre‑market
* Today’s Pre‑Market High/Low (**PMH**, **PML**)
* Yesterday’s **Value Area High/Low** (**VAH/VAL**) and **Point of Control (POC)** computed from a volume profile of yesterday’s **regular session**
* Smart de‑duplication:
* Shows **only the higher** of (yEHH vs PMH) and **only the lower** of (yEHL vs PML) to avoid redundant bands
* **Market Breadth Table (on‑chart table)**
* **NYSE ratio** = UVOL/DVOL (signed) with **VOLD slope** from session open
* **NASDAQ ratio** = UVOLQ/DVOLQ (signed) with **VOLDQ slope** from session open
* **TICK** and **TICKQ**: live cumulative ratio and short‑term slope
* **VIX** (optional): current value + slope over a configurable lookback/timeframe
* Color‑coded trends with sensible thresholds and optional normalization
---
## 2) How to use it (trader workflow)
1. **Mark your reaction zones**
* Watch **yHoD/yLoD**, **PMH/PML**, and **VAH/VAL/POC** for first touches, break/retest, and failure tests.
* Expect increased responsiveness when multiple levels cluster (e.g., PMH ≈ VAH ≈ daily pivot).
2. **Read the breadth panel for context**
* **NYSE/NASDAQ ratio** (>1 = more up‑volume than down‑volume; <−1 = down‑dominant). Strong green across both favors long setups; red favors short setups.
* **VOLD slopes** (NYSE & NASDAQ): positive and accelerating → broadening participation; negative → persistent pressure.
* **TICK/TICKQ**: cumulative ratio and **slope arrows** (↗ / ↘ / →). Use the slope to gauge **near‑term thrust or fade**.
* **VIX slope**: rising VIX (red) often coincides with risk‑off; falling VIX (green) with risk‑on.
3. **Confluence = higher confidence**
* Example: Price reclaims **PMH** while **NYSE/NASDAQ ratios** print green and **TICK slopes** point ↗ — consider break‑and‑go; if VIX slope is ↘, that adds risk‑on confidence.
* Example: Price rejects **VAH** while **VOLD slopes** roll negative and VIX ↗ — consider fade/reversal.
4. **Risk management**
* Place stops just beyond key levels tested; if breadth flips, tighten or exit.
> **Timeframes:** Works best on 1–15m charts for intraday. Value Area is computed from **yesterday’s RTH**; choose a smaller calculation timeframe (e.g., 5–15m) for stable profiles.
---
## 3) Inputs & settings (what each option controls)
### Global Style
* **Enable all automatic price levels**: master toggle for yHoD/yLoD, yEHH/yEHL, PMH/PML, VAH/VAL/POC.
* **Line style/width**: applies to all drawn levels.
* **Label size/style** and **label color linking**: use the same color as the line or override with a global label color.
* **Maximum bars lookback**: how far the script scans to build yesterday metrics (performance‑sensitive).
### Value Area / Volume Profile
* **Enable Value Area calculations** *(on by default)*: computes yesterday’s **POC**, **VAH**, **VAL** from a simplified intraday volume profile built from yesterday’s **regular session bars**.
* **Max Volume Profile Points** *(default 50)*: lower values = faster; higher = more precise.
* **Value Area Calculation Timeframe** *(default 15)*: the security timeframe used when collecting yesterday’s highs/lows/volumes.
### Individual Level Toggles & Colors
* **yHoD / yLoD** (yesterday high/low)
* **yEHH / yEHL** (yesterday AH + today pre‑market extremes)
* **PMH / PML** (today pre‑market extremes)
* **VAH / VAL / POC** (yesterday RTH value area + point of control)
### Market Breadth Panel
* **Show NYSE / NASDAQ / VIX**: choose which series to display in the table.
* **Table Position / Size / Background Color**: UI placement and legibility.
* **Slope Averaging Periods** *(default 5)*: number of recent TICK/TICKQ ratio points used in slope calculation.
* **Candles for Rate** *(default 10)* & **Normalize Rate**: VIX slope calculation as % change between `now` and `n` candles ago; normalize divides by `n`.
* **VIX Timeframe**: optionally compute VIX on a higher TF (e.g., 15, 30, 60) for a smoother regime read.
* **Volume Normalization** (NYSE & NASDAQ): display VOLD slopes scaled to `tens/thousands/millions/10th millions` for readable magnitudes; color thresholds adapt to your choice.
---
## 4) Data sources & definitions
* **UVOL/VOLD (NYSE)** and **UVOLQ/DVOLQ/VOLDQ (NASDAQ)** via `request.security()`
* **Ratio** = `UVOL/DVOL` (signed; negative when down‑volume dominates)
* **VOLD slope** ≈ `(VOLD_now − VOLD_open) / bars_since_open`, then normalized per your setting
* **TICK/TICKQ**: cumulative sum of prints this session with **positives vs negatives ratio**, plus a simple linear regression **slope** of the last `N` ratio values
* **VIX**: value and slope across a user‑selected timeframe and lookback
* **Sessions (EST/EDT)**
* **Regular:** 09:30–16:00
* **Pre‑Market:** 04:00–09:30
* **After Hours:** 16:00–20:00
* **Extended‑hours extremes** combine **yesterday AH** + **today PM**
> **Note:** All session checks are done with TradingView’s `time(…,"America/New_York")` context. If your broker’s RTH differs (e.g., futures), adjust expectations accordingly.
---
## 5) How the algorithms work (plain English)
### A) Key Levels
* **Yesterday’s RTH High/Low**: scans yesterday’s bars within 09:30–16:00 and records the extremes + bar indices.
* **Extended Hours**: scans yesterday AH and today PM to get **yEHH/yEHL**. Script shows **either yEHH or PMH** (whichever is **higher**) and **either yEHL or PML** (whichever is **lower**) to avoid duplicate bands stacked together.
* **Value Area & POC (RTH only)**
* Build a coarse volume profile with `Max Volume Profile Points` buckets across the price range formed by yesterday’s RTH bars.
* Distribute each bar’s volume uniformly across the buckets it spans (fast approximation to keep Pine within execution limits).
* **POC** = bucket with max volume. **VA** expands from POC outward until **70%** of cumulative volume is enclosed → yields **VAH/VAL**.
### B) Market Breadth Table
* **NYSE/NASDAQ Ratio**: signed UVOL/DVOL with basic coloring.
* **VOLD Slopes**: from session open to current, normalized to human‑readable units; colors flip green/red based on thresholds that map to your normalization setting (e.g., ±2M for NYSE, ±3.5×10M for NASDAQ).
* **TICK/TICKQ Slope**: linear regression over the last `N` ratio points → **↗ / → / ↘** with the rounded slope value.
* **VIX Slope**: % change between now and `n` candles ago (optionally divided by `n`). Red when rising beyond threshold; green when falling.
---
## 6) Recommended presets
* **Stocks (liquid, intraday)**
* Value Area **ON**, `Max Volume Points` = **40–60**, **Timeframe** = **5–15**
* Breadth: show **NYSE & NASDAQ & VIX**, `Slope periods` = **5–8**, `Candles for rate` = **10–20**, **Normalize VIX** = **ON**
* **Index futures / very high‑volume symbols**
* If you see Pine timeouts, set `Max Volume Points` = **20–40** or temporarily **disable Value Area**.
* Keep breadth panel **ON** (it’s light). Consider **VIX timeframe = 15/30** for regime clarity.
---
## 7) Tips, edge cases & performance
* **Performance:** The volume profile is capped (`maxBarsToProcess ≤ 500` and bucketed) to keep it responsive. If you experience slowdowns, reduce `Max Volume Points`, `Maximum bars lookback`, or disable Value Area.
* **Redundant lines:** The script **intentionally suppresses** PMH/PML when yEHH/yEHL are more extreme, and vice‑versa.
* **Label visibility:** Use `Label style = none` if you only want clean lines and read values from the right‑end labels.
* **Futures/RTH differences:** Value Area is from **yesterday’s RTH** only; for 24h instruments the RTH period may not reflect overnight structure.
* **Session transitions:** PMH/PML tracking stops as soon as RTH starts; values persist as static levels for the session.
---
## 8) Known limitations
* Uses public TradingView symbols: `UVOL`, `VOLD`, `UVOLQ`, `DVOLQ`, `VOLDQ`, `TICK`, `TICKQ`, `VIX`. If your data plan or region limits any symbol, the corresponding table rows may show `na`.
* The VA/POC approximation assumes uniform distribution of each bar’s volume across its high–low. That’s fast but not a tick‑level profile.
* Works best on US equities with standard NY session; alternative sessions may need code changes.
---
## 9) Troubleshooting
* **“Script is too slow / timed out”** → Lower `Max Volume Points`, lower `Maximum bars lookback`, or toggle **OFF** `Enable Value Area calculations` for that instrument.
* **Missing breadth values** → Ensure the symbols above load on your account; try reloading chart or switching timeframes once.
* **Overlapping labels** → Set `Label style = none` or reduce label size.
---
## 10) Version / license / contribution
* **Version:** Initial public release (Pine v6).
* **Author:** © yelober
* **License:** Free for community use and enhancement. Please keep author credit.
* **Contributing:** Open PRs/ideas: presets, alert conditions, multi‑day VA composites, optional mid‑value (`(VAH+VAL)/2`), session filter for futures, and alertable state machine for breadth regime transitions.
---
## 11) Quick start (TL;DR)
1. Add the indicator and **keep default settings**.
2. Trade **reactions** at yHoD/yLoD/PMH/PML/VAH/VAL/POC.
3. Use the **breadth table**: look for **green ratios + ↗ slopes** (risk‑on) or **red ratios + ↘ slopes** (risk‑off). Check **VIX** slope for confirmation.
4. Manage risk around levels; when breadth flips against you, tighten or exit.
---
### Changelog (public)
* **v1.0:** First community release with automatic RTH levels, VA/POC approximation, breadth dashboard (NYSE/NASDAQ/TICK/TICKQ/VIX) with normalization and adaptive color thresholds.

REMS First Strike OverlayThe REMS First Strike indicator is a multi-factor, confluence-based system that combines momentum (RSI, Stochastic RSI), trend (EMA, MACD), and optional filters (volume, MACD histogram, session time) to identify high-probability trade setups. Signals are only triggered when all enabled conditions align, giving the trader a filtered, visually clear entry signal.
This indicator uses an optional 'cool down' feature where in it will signal an entry only after any of the specified cross events occur.
To use the indicator, select which technical indicators you wish to filter, the session you wish to apply (default is 9:30am - 4pm EST, based on your chart time settings), and if which cross events you wish to trigger a reset on the cooldown.
The default settings filter the 4 major technical indicators (RSI, EMAs, MACD, Stochastic RSI) but optional filters exist to further fine tune Stochastic Range, MACD momentum and strength, and volume, with optional visual cues for MACD position, Stochastic RSI position, and volume.
EMAs can be drawn on the chart from this indicator with optional shaded background.
This indicator is an alternative to REMS Snap Shot, which uses a recency filter instead of a cool down.
Dynamic Value Zone Oscillator (DVZO) - @CRYPTIK1Dynamic Value Zone Oscillator (DVZO) @CRYPTIK1
Introduction: What is the DVZO?
The Dynamic Value Zone Oscillator (DVZO) is a powerful momentum indicator that reframes the classic "overbought" and "oversold" concept. Instead of relying on a fixed lookback period like a standard RSI or Stochastics, the DVZO measures the current price relative to a significant, higher-timeframe Value Zone (e.g., the previous week's entire price range).
This gives you a more contextual and structural understanding of price. The core question it answers is not just "Is the price moving up or down quickly?" but rather, "Where is the current price in relation to its recently established area of value?"
This allows traders to identify true "premium" (overbought) and "discount" (oversold) levels with greater accuracy, leading to higher-probability reversal and trend-following signals.
The Core Concept: Price vs. Value
The market is constantly trying to find equilibrium or "fair value." The DVZO is built on the principle that the high and low of a significant prior period (like the previous day, week, or month) create a powerful area of perceived value.
The Value Zone: The range between the high and low of the selected higher timeframe. The midpoint of this zone is the equilibrium (0 line on the oscillator).
Premium Territory (Distribution Zone): When price breaks above the Value Zone High (+100 line), it is trading at a premium. This is an area where sellers are more likely to become active and buyers may be over-extending.
Discount Territory (Accumulation Zone): When price breaks below the Value Zone Low (-100 line), it is trading at a discount. This is an area where buyers are more likely to see value and sellers may be exhausted.
By anchoring its analysis to these significant structural levels, the DVZO filters out much of the noise from lower-timeframe price fluctuations.
Key Features
The Oscillator:
The main blue line visualizes exactly where the current price is within the context of the Value Zone.
+100: The high of the Value Zone.
0: The midpoint/equilibrium of the Value Zone.
-100: The low of the Value Zone.
Automatic Divergence Detection:
The DVZO automatically identifies and plots bullish and bearish divergences on both the price chart and the oscillator itself.
Bullish Divergence: Price makes a new low, but the DVZO makes a higher low. This is a strong signal that downside momentum is fading and a reversal to the upside is likely.
Bearish Divergence: Price makes a new high, but the DVZO makes a lower high. This indicates that upside momentum is waning and a pullback is probable.
Value Migration Histogram:
The purple histogram in the background visualizes the width of the Value Zone.
Expanding Histogram: Volatility is increasing, and the accepted value range is getting wider.
Contracting Histogram: Volatility is decreasing, and the price is coiling in a tight range, often in anticipation of a major breakout.
How to Use the DVZO: Trading Strategies
1. Reversion Trading
This is the most direct way to use the indicator.
Look for Buys: When the DVZO line drops below -100, the price is in the "Accumulation Zone." Wait for the price to show signs of strength (e.g., a bullish candle pattern) and the DVZO line to start turning back up towards the -100 level. This is a high-probability mean reversion setup.
Look for Sells: When the DVZO line moves above +100, the price is in the "Distribution Zone." Look for signs of weakness (e.g., a bearish engulfing candle) and the DVZO line to start turning back down towards the +100 level.
2. Divergence Trading
Divergences are powerful confirmation signals.
Entry Signal: When a Bullish Divergence appears, it provides a strong entry signal for a long position, especially if it occurs within the Accumulation Zone (below -100).
Exit/Short Signal: When a Bearish Divergence appears, it can serve as a signal to take profit on long positions or to look for a short entry, especially if it occurs in the Distribution Zone (above +100).
3. Best Practices & Settings
Timeframe Synergy: The DVZO is most effective when your chart timeframe is lower than your selected Value Zone Source.
For Day Trading (e.g., 1H, 4H chart): Use the "Previous Day" Value Zone.
For Swing Trading (e.g., 1D, 12H chart): Use the "Previous Week" or "Previous Month" Value Zone.
Confirmation is Key: The DVZO is a powerful tool, but it should not be used in isolation. Always combine its signals with other forms of analysis, such as market structure, support/resistance levels, and candlestick patterns, for confirmation.
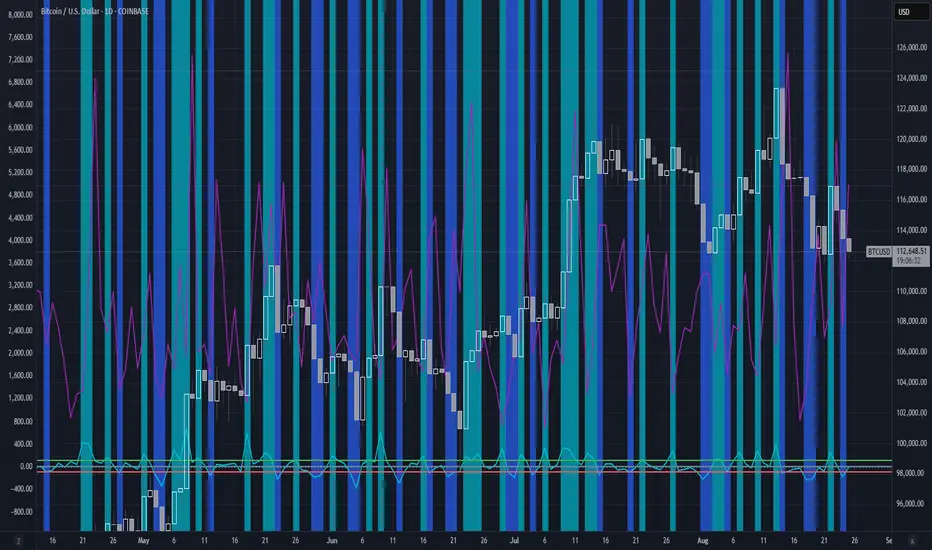
All Time High & All Time Low + 52-Week (ATH & ATL) | by Octopu$🚀 All Time High & All Time Low (ATH & ATL) + 52-Week with % and $ Info| by Octopu$
What is a 52-week, ATH or ATL?
52-Week High
The highest price a stock has traded at in the past 52 weeks (Approx. 1 year).
Acts like a “short-term ATH.” Many traders and investors use it as a momentum signal — breaking above it shows strength. Often used by screeners (“Stocks near 52-week high”).
IF a Ticker highest price in the last year is $500, and it’s currently trading at $555, it just made a new 52-week high (but not necessarily an all-time high).
52-Week Low
The lowest price a stock has traded at in the past 52 weeks (Approx. 1 year).
Acts like a “short-term ATL.” Traders watch it for breakdowns, and long-term investors watch it for potential bargains/buy the dip. Also important for risk management and Stop Losses.
IF a Ticker lowest price in the last year was $100, and it falls to $88, it just made a new 52-week low (but not necessarily an all-time low).
ATH (All-Time High)
The highest price a stock (or index, crypto, etc...) has EVER reached in its entire trading history.
Shows maximum bullish strength. When price breaks to a new ATH, there is no overhead resistance → often leads to strong momentum rallies. Also used as a psychological level in case of resistance/breakout.
ATL (All-Time Low)
The lowest price a stock (or asset) has EVER traded at since it began trading.
Reflects maximum bearish weakness. Breaking below the ATL is dangerous (no historical support below). Often associated with companies in crisis or risk of delisting. Or simply crashers or faders, whatever slang you may call it. Generally heavily shorted.
EXAMPLE:
AMEX:SPY
www.tradingview.com
This indicator however should not be used as a standalone tool.
(The combination of factors relies on your own knowledge about Confluence Factors along with your Due Diligence)
This indicator is not an advice to buy or sell securities in any form.
ANY Ticker. ANY Timeframe.
Features:
• 52-Week High
• 52-Week Low
• ALL Time High
• ALL Time Low
• $ Value Difference (of Current Price)
• % Percentage Difference (of Current Price)
Options:
• Customization
• Toggles
Notes:
v1.0
Indicator release.
Changes and updates can come in the future for additional functionalities or per requests. Follow and Stay Tuned!
Did you like it? Please Support and Shoot me a message! I'd appreciate if you dropped by to say thanks! Thank you.
- Octopu$
🐙

OctaScalp Precision Pro [By TraderMan]What is OctaScalp Precision Pro ? 🚀
OctaScalp Precision is a powerful scalping indicator designed for fast, short-term trades. It combines eight technical indicators to generate 💪 high-accuracy buy 📗 and sell 📕 signals. Optimized for scalpers, this tool targets small price movements in low timeframes (1M, 5M). With visual lines 📈, labels 🎯, and Telegram alerts 📬, it simplifies quick decision-making, enhances risk management, and tracks trade performance.
What Does It Do? 🎯
Fast Signals: Produces reliable buy/sell signals using a consensus of eight indicators.
Risk Management: Offers automated Take Profit (TP) 🟢 and Stop Loss (SL) 🔴 levels with a 2:1 reward/risk ratio.
Trend Confirmation: Validates short-term trends with a 30-period EMA zone.
Performance Tracking: Records trade success rates (%) and the last 5 trades 📊.
User-Friendly: Displays market strength, signal type, and trade details in a top-right table.
Alerts: Sends Telegram-compatible notifications for new positions and trade results 📲.
How Does It Work? 🛠️
OctaScalp Precision integrates eight technical indicators (RSI, MACD, Stochastic, Momentum, 200-period EMA, Supertrend, CCI, OBV) for robust analysis. Each indicator contributes 0 or 1 point to a bullish 📈 or bearish 📉 score (max 8 points). Signals are generated as follows:
Buy Signal 📗: Bullish score ≥6 and higher than bearish score.
Sell Signal 📕: Bearish score ≥6 and higher than bullish score.
EMA Zone 📏: A zone (default 0.1%) around a 30-period EMA confirms trends. Price staying above or below the zone for 4 bars validates the direction:
Up Direction: Price above zone, color green 🟢.
Down Direction: Price below zone, color red 🔴.
Neutral: Price within zone, color gray ⚪.
Entry/Exit: Entries are triggered on new signals, with TP (2% profit) and SL (1% risk) auto-calculated.
Table & Alerts: Displays market strength (% bull/bear), signal type, entry/TP/SL, and success rate in a table. Telegram alerts provide instant notifications.
How to Use It? 📚
Setup 🖥️:
Add the indicator to TradingView and use default settings or customize (EMA length, zone width, etc.).
Best for low timeframes (1M, 5M).
Signal Monitoring 🔍:
Check the table: Bull Strength 📗 and Bear Strength 📕 percentages indicate signal reliability.
Confirm Buy (📗 BUY) or Sell (📕 SELL) signals when trendSignal is 1 or -1.
Entering a Position 🎯:
Buy: trendSignal = 1, bullish score ≥6, and higher than bearish score, enter at the entry price.
Sell: trendSignal = -1, bearish score ≥6, and higher than bullish score, enter at the entry price.
TP and SL: Follow the green (TP) 🟢 and red (SL) 🔴 lines on the chart.
Exiting 🏁:
If price hits TP, trade is marked ✅ successful; if SL, marked ❌ failed.
Results are shown in the “Last 5 Trades” 📜 section of the table.
Setting Alerts 📬:
Enable alerts in TradingView. Receive Telegram notifications for new positions and trade outcomes.
Position Entry Strategy 💡
Entry Conditions:
For Buy: Bullish score ≥6, trendSignal = 1, price above EMA zone 🟢.
For Sell: Bearish score ≥6, trendSignal = -1, price below EMA zone 🔴.
Check bull/bear strength in the table (70%+ is ideal for strong signals).
Additional Confirmation:
Use on high-volume assets (e.g., BTC/USD, EUR/USD).
Validate signals with support/resistance levels.
Be cautious in ranging markets; false signals may increase.
Risk Management:
Stick to the 2:1 reward/risk ratio (TP 2%, SL 1%).
Limit position size to 1-2% of your account.
Tips and Recommendations 🌟
Best Markets: Ideal for volatile markets (crypto, forex) and low timeframes (1M, 5M).
Settings: Adjust EMA length (default 30) or zone width (0.1%) based on the market.
Backtesting: Test on historical data to evaluate success rate 📊.
Discipline: Follow signals strictly and avoid emotional decisions.
OctaScalp Precision makes scalping fast, precise, and reliable! 🚀

TMO of Relative StrengthThis indicator shows 3 TMOs, one for the charted symbol, one for a chosen index symbol, and one for the relative strength ratio of the 2 symbols.
While a normal TMO measures momentum of a stock, this indicator measures the subtle momentum shifts that happen in the relative strength ratio of the stock , which can sometimes happen before the momentum of the stock itself shifts. This provides the potential for an early warning that a move may be about to begin, even before the stock price starts heading in one direction.
Many traders watch relative strength ratio charts to see when a stock begins to outperform the index. This indicator doesn't measure the relative or comparative strength ratio itself, but instead measures the change in momentum of relative strength .
Signals and alerts are provided for when the Ratio's TMO line crosses above/below the Stock's TMO line, or the Market Index's TMO line, and also for when the Stock's TMO line crosses above/below the Market's TMO line even if the ratio isn't crossing currently. Also alerts when the Ratio or Stock TMO lines cross their prior values.
I created a version of this for Thinkorswim originally and it has been valuable to me and my clients, so I hope it provides value here as well.
-Josiah

Reversal Radar
**Reversal Radar - Multi-Indicator Confirmation System**
This script combines five proven technical analysis methods into a unified reversal signal, reducing false signals through multi-indicator confirmation.
**INDICATORS USED:**
1. ADX/Directional Movement System
Determines trend direction via +DI and -DI comparison. Signal only during downtrend condition (DI- > DI+). Filters out sideways markets.
2. Custom Linear Regression Momentum
Proprietary momentum calculation based on linear regression. Measures price deviation from Keltner Channel midline. Signal on negative but rising momentum (beginning trend reversal).
3. Williams VIX Fix (WVF)
Identifies panic-selling phases. Calculates relative distance to recent high. Signal when exceeding Bollinger Bands or historical percentiles.
4. RSI Oversold Filter
Default RSI < 35 (adjustable 30-40). Filters only oversold zones for reversal setups.
5. MACD Confirmation
Signal only when MACD below zero line and below signal line. Confirms ongoing weakness before potential reversal.
**FUNCTIONALITY:**
The system generates a BUY signal only when ALL activated filters are simultaneously met. Each indicator can be individually enabled/disabled. Flexible parameter adjustment for different markets/timeframes. Reduces false signals through multi-confirmation.
**APPLICATION:**
Suitable for swing trading on higher timeframes (4H, Daily), reversal strategies in oversold markets, and combination with additional confirmation indicators.
Setup: Activate desired filters, adjust parameters to market/timeframe, check BUY signal as entry opportunity. Additional confirmation through volume/support recommended.
**INNOVATION:**
The Custom Linear Regression Momentum is a proprietary development combining Keltner Channel logic with linear regression for more precise momentum detection than standard oscillators.
**DISCLAIMER:**
This tool serves as technical analysis support. No signal should be traded without additional confirmation and risk management.

VIX Filter/RSI/EMA Bias/Cum-TICK w/ Exhaustion Zone DashboardThis all-in-one dashboard gives intraday traders a real-time visual read of market conditions, combining volatility regime, trend bias, momentum exhaustion, and internal strength — all in a fully customizable overlay that won’t clutter your chart.
📉 VIX Market Regime Detector
Identifies "Weak", "Normal", "Volatile", or "Danger" market states based on customizable VIX ranges and symbol (e.g., VXN or VIX).
📊 RSI Momentum Readout
Displays real-time RSI from any selected timeframe or symbol, with adjustable length, OB/OS thresholds, and color-coded exhaustion alerts.
📈 EMA Trend Bias Scanner
Compares fast and slow EMAs to define bullish or bearish bias, using your preferred timeframe, symbol, and EMA lengths — ideal for multi-timeframe setups.
🧠 Cumulative TICK Pressure & Exhaustion Engine
Analyzes internal market strength using cumulative TICK data to classify conditions as:
-Strong / Mild Bullish or Bearish Pressure
-Choppy / No Edge
-⚠️ Exhaustion Zones — when raw TICK values hit extreme highs/lows, a separate highlight box appears in the dashboard, warning of potential turning points
All logic is customizable, including TICK symbol, timeframes, thresholds, and lookback periods.
Scalpers and day traders who want fast, visual insight into market internals, exhaustion, and trend bias.
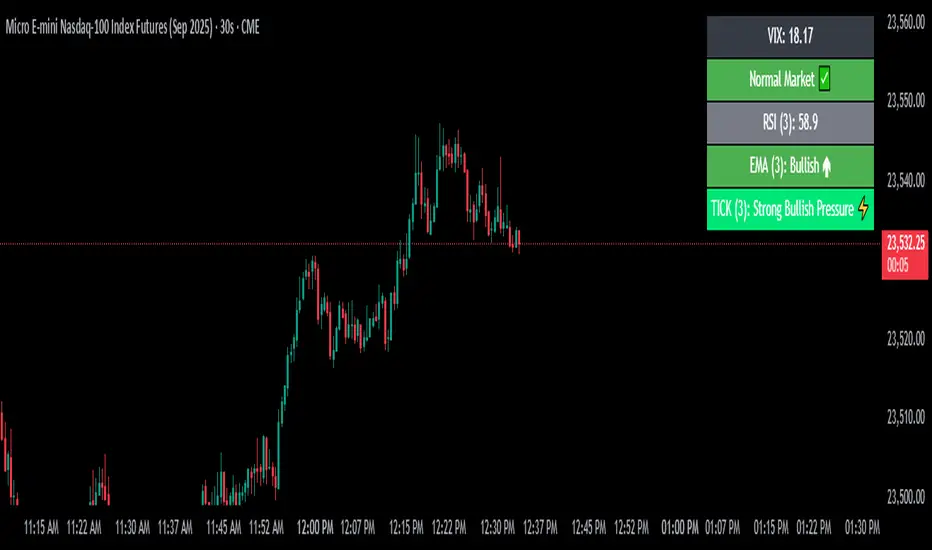
Future is hereOverview
"Future is Here" is an original, multi-faceted Pine Script indicator designed to provide traders with a comprehensive toolset for identifying high-probability trading opportunities. By integrating volatility-based entry zones, trend-based price targets, momentum confirmation, dynamic support/resistance levels, and risk-reward ratio (RRR) calculations, this indicator offers a cohesive and actionable trading framework. Each feature is carefully designed to complement the others, ensuring a synergistic approach that enhances decision-making across various market conditions. This script is unique in its ability to combine these elements into a single, streamlined interface with clear visual cues and customizable alerts, making it suitable for both novice and experienced traders.
Key Features and How They Work Together
Volatility-Based Entry Zones
Purpose: Identifies overbought and oversold conditions using a volatility-adjusted moving average, helping traders spot potential reversal zones.
Mechanism: Utilizes a user-defined volatility length and multiplier to calculate dynamic overbought/oversold thresholds based on the standard deviation of price. Crossovers and crossunders of these levels trigger "Buy Zone" or "Sell Zone" labels.
Synergy: These zones act as the foundation for entry signals, which are later confirmed by momentum and trend filters to reduce false signals.
Trend-Based Price Targets
Purpose: Projects potential price targets based on the prevailing trend, giving traders clear objectives for profit-taking.
Mechanism: Combines a fast and slow moving average to determine trend direction, then calculates target prices using a multiplier of the price deviation from the slow MA. Labels display bullish or bearish targets when the fast MA crosses the slow MA.
Synergy: Works in tandem with entry zones and momentum signals to align targets with market conditions, ensuring traders aim for realistic price levels supported by trend strength.
Momentum Confirmation
Purpose: Validates entry signals by assessing momentum strength, filtering out weak setups.
Mechanism: Uses the momentum indicator to detect bullish or bearish momentum crossovers, labeling them as "Strong" or "Weak" based on a comparison with a smoothed momentum average.
Synergy: Enhances the reliability of buy/sell signals by ensuring momentum aligns with volatility zones and trend direction, reducing the risk of premature entries.
Dynamic Support/Resistance Levels
Purpose: Highlights key price levels where the market is likely to react, aiding in trade planning and risk management.
Mechanism: Detects pivot highs and lows over a user-defined lookback period, drawing horizontal lines for the most recent support and resistance levels (limited to two each for clarity). Labels mark these levels with price values.
Synergy: Complements entry zones and price targets by providing context for potential reversal or continuation points, helping traders set logical stop-losses or take-profits.
Buy/Sell Signals with Risk-Reward Ratios
Purpose: Generates precise buy/sell signals with integrated take-profit (TP), stop-loss (SL), and RRR calculations for disciplined trading.
Mechanism: Combines volatility zone crossovers, trend confirmation, and positive momentum to trigger signals. ATR-based TP and SL levels are calculated, and the RRR is displayed in labels for quick assessment.
Synergy: This feature ties together all previous components, ensuring signals are only generated when volatility, trend, and momentum align, while providing clear risk-reward metrics for trade evaluation.
Customizable Alerts
Purpose: Enables traders to stay informed of trading opportunities without constant chart monitoring.
Mechanism: Alert conditions are set for buy and sell signals, delivering notifications with the entry price for seamless integration into trading workflows.
Synergy: Enhances usability by allowing traders to act on high-probability setups identified by the indicator’s combined logic.
Originality
"Future is Here" is an original creation that distinguishes itself through its holistic approach to technical analysis. Unlike single-purpose indicators, it integrates volatility, trend, momentum, and support/resistance into a unified system, reducing the need for multiple scripts. The inclusion of RRR calculations directly in signal labels is a unique feature that empowers traders to evaluate trade quality instantly. The script’s design emphasizes clarity and efficiency, with cooldowns to prevent label clutter and a limit on support/resistance lines to maintain chart readability. This combination of features, along with its customizable parameters, makes it a versatile and novel tool for traders seeking a robust, all-in-one solution.
How to Use
Setup: Add the indicator to your TradingView chart and adjust input parameters (e.g., Volatility Length, Trend Length, TP/SL Multipliers) to suit your trading style and timeframe.
Interpretation:
Look for "Buy Zone" or "Sell Zone" labels to identify potential entry points.
Confirm entries with "Bull Mom" or "Bear Mom" labels and trend direction (Bull/Bear Target labels).
Use Support/Resistance lines to set logical TP/SL levels or anticipate reversals.
Evaluate Buy/Sell signals with TP, SL, and RRR for high-probability trades.
Alerts: Set up alerts for Buy/Sell signals to receive real-time notifications.
Customization: Fine-tune multipliers and lengths to adapt the indicator to different markets (e.g., stocks, forex, crypto) or timeframes.
