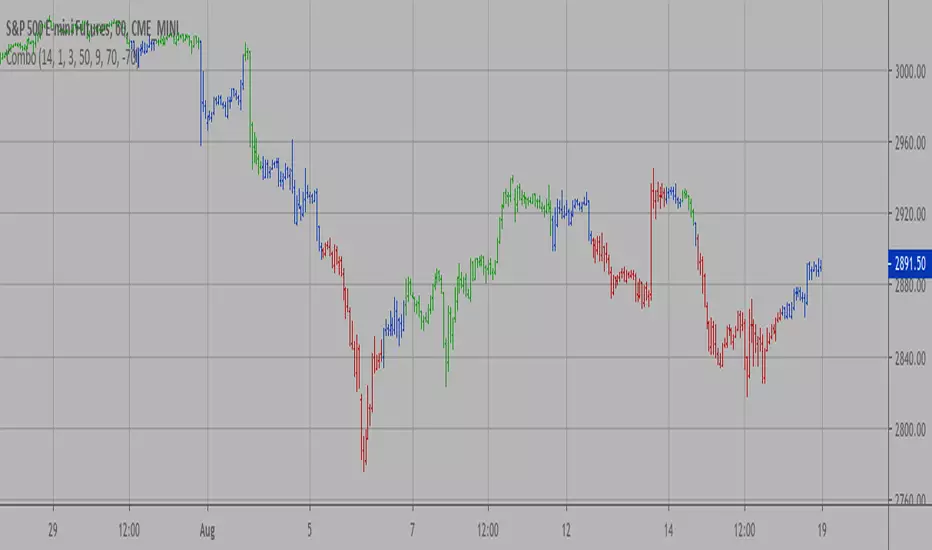
Combo Strategy 123 Reversal & Chande Momentum OscillatorThis is combo strategies for get a cumulative signal.
First strategy
This System was created from the Book "How I Tripled My Money In The
Futures Market" by Ulf Jensen, Page 183. This is reverse type of strategies.
The strategy buys at market, if close price is higher than the previous close
during 2 days and the meaning of 9-days Stochastic Slow Oscillator is lower than 50.
The strategy sells at market, if close price is lower than the previous close price
during 2 days and the meaning of 9-days Stochastic Fast Oscillator is higher than 50.
Second strategy
This indicator plots Chande Momentum Oscillator. This indicator was
developed by Tushar Chande. A scientist, an inventor, and a respected
trading system developer, Mr. Chande developed the CMO to capture what
he calls "pure momentum". For more definitive information on the CMO and
other indicators we recommend the book The New Technical Trader by Tushar
Chande and Stanley Kroll.
The CMO is closely related to, yet unique from, other momentum oriented
indicators such as Relative Strength Index, Stochastic, Rate-of-Change,
etc. It is most closely related to Welles Wilder`s RSI, yet it differs
in several ways:
- It uses data for both up days and down days in the numerator, thereby
directly measuring momentum;
- The calculations are applied on unsmoothed data. Therefore, short-term
extreme movements in price are not hidden. Once calculated, smoothing
can be applied to the CMO, if desired;
- The scale is bounded between +100 and -100, thereby allowing you to
clearly see changes in net momentum using the 0 level. The bounded scale
also allows you to conveniently compare values across different securities.
WARNING:
- For purpose educate only
- This script to change bars colors.
Cerca negli script per "momentum"
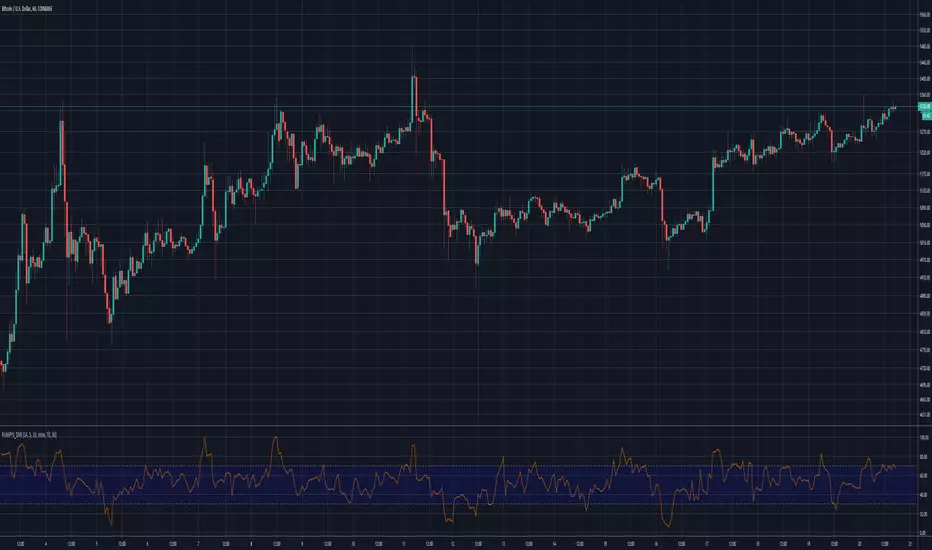
Rumpy's Dynamic Momentum IndexNote : I haven't been able to determine from the info I've found whether the variable length is used for the average gain/loss part of the calculation and/or for the relative strength portion of the calculation . If anyone knows for certain please let me know.
Type A only uses the variable length for the final relative strength calculation and the fixed RSI length for the average gain/loss.
Type B uses the variable length for both.
I do suspect that Type B is correct though as it is a lot more sensitive to momentum changes while Type A tends to just exaggerate normal RSI
-------------------------------------------------------------------------------------------------------------------------------------------
This indicator, developed by Tushar Chande and Stanley Kroll, is similar to the relative strength index (RSI). The main difference between the two is that the RSI uses a fixed number of time periods (usually 14) in its calculation, while the dynamic momentum index uses different time periods as volatility changes, typically between five and 30.
The dynamic momentum index uses fewer periods in its calculation when volatility is high, and more periods when volatility is low.
The number of time periods used in the dynamic momentum index decreases as volatility in the underlying security increases, making this indicator more responsive to changing prices than the RSI. This is particularly useful when an asset's price moves quickly as it approaches key support or resistance levels. Because the indicator is more sensitive, traders can potentially find earlier entry and exit points than with the RSI.
-------------------------------------------------------------------------------------------------------------------------------------------
If you find it useful please consider a tip/donation :
BTC - 3BMEXEDyWJ58eXUEALYPadbn1wwWKmf6sA
Linear Momentum and Performance IndicatorsThis a porting to Trading View of the 12 new indicators introduced in IFTA Journal (January Edition) by Akram El Sherbini, MFTA, CFTe, CETA.
Indicators are available in "Linear Momentum and Performance Indicators" at page four.
IFTA Journal is available below:
ifta.org
Indicators implemented herein:
Linear Force Index: The linear force index LFI measures the force of buyers and sellers during rallies and declines, respectively. It combines two important pieces of market information—the price acceleration
and volumes.
Pressure Index: The pressure index PRI measures the buying and selling pressure over a certain range within a time interval by moving around its zero line. The index indicates a rise in buying pressure when it crosses above the zero line and a rise in selling pressure
when it crosses below the zero line level. The buying and selling force moves the last price during the session to form a range with low and high boundaries.
Strength Index Index: The strength index SI is a leading indicator to the pressure index. It measures the ability of buyers to resist sellers and vice versa. SI of today is the ratio of the latest pressure index value to the strain of today.
Power Index: It measures the buying and selling power within a time interval by moving around its zero line.
Intensity Index: The intensity index II measures the buying and selling intensity within a time interval by moving around its zero line.
Dynamic Strength Index: The sole purpose of the dynamic strength index DSI and the integral dynamic strength index IDSI is to lead their intensity indicator peers.
Integral Force Index
Integral Pressure Index
Integral Strength Index
Integral Power Index
Integral Intensity Index
Integral Dynamic Strength Index
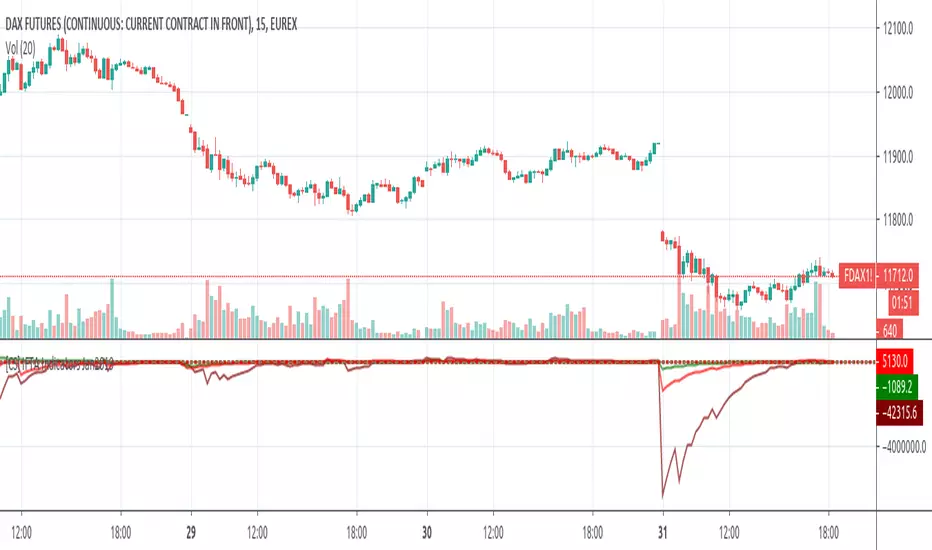
The following example shows a trade following the signal while several indicators are crossing the zero line:
Integral performance indicators have a fewer number of trades than the performance indicators. This result is normal, as the integral indicators are less sensitive than their peers. Moreover, the power, intensity, and dynamic strength are less sensitive than the force, pressure, and strength indicators. The same applies for their integrals. Therefore, the integrals of power, intensity, and dynamic strength indicators are more inclined to be medium-term indicators.
As the paper is suggesting "the linear momentum and the new performance indicators should make a significant change in categorizing several indicators in technical analysis."
Technical indicators are using biased mathematical implementations. For example Momentum Index is in reality a velocity indicator, Force index a Momentum indicator and so on. From a Physical perspective correct momentum, force, velocity etc. needs to be corrected and re-categorized.
The author also gives important insights in how these indicators can be used "simultaneously to identify price turning points and filter irrelevant divergences."
"This paper will attempt to adjust the price momentum and force concepts introduced by Welles Wilder and Alexander Elder, respectively. By introducing the concept of linear momentum, new indicators will emerge to dissect the market performance into six main elements: market’s force, pressure, strength, power, intensity, and dynamic strength. This will lead to a deeper insight about market action. The leading performance indicators can be used simultaneously to identify price turning points and filter irrelevant divergences. The linear momentum and the new performance indicators should make a significant change in categorizing several indicators in technical analysis."
Suggestions and feedbacks are welcome
Hope you enjoy this,
CryptoStatistical

Linear Momentum and Performance Indicators (IFTA Jan 2019)This a porting to Trading View of the 12 new indicators introduced in IFTA Journal (January Edition) by Akram El Sherbini, MFTA, CFTe, CETA.
Indicators are available in "Linear Momentum and Performance Indicators" at page four.
IFTA Journal is available below:
ifta.org
Indicators implemented herein:
Linear Force Index: The linear force index LFI measures the force of buyers and sellers during rallies and declines, respectively. It combines two important pieces of market information—the price acceleration
and volumes.
Pressure Index: The pressure index PRI measures the buying and selling pressure over a certain range within a time interval by moving around its zero line. The index indicates a rise in buying pressure when it crosses above the zero line and a rise in selling pressure
when it crosses below the zero line level. The buying and selling force moves the last price during the session to form a range with low and high boundaries.
Strength Index Index : The strength index SI is a leading indicator to the pressure index. It measures the ability of buyers to resist sellers and vice versa. SI of today is the ratio of the latest pressure index value to the strain of today.
Power Index : It measures the buying and selling power within a time interval by moving around its zero line.
Intensity Index : The intensity index II measures the buying and selling intensity within a time interval by moving around its zero line.
Dynamic Strength Index : The sole purpose of the dynamic strength index DSI and the integral dynamic strength index IDSI is to lead their intensity indicator peers.
Integral Force Index
Integral Pressure Index
Integral Strength Index
Integral Power Index
Integral Intensity Index
Integral Dynamic Strength Index
The following example shows a trade following the signal while several indicators are crossing the zero line:
Integral performance indicators have a fewer number of trades than the performance indicators. This result is normal, as the integral indicators are less sensitive than their peers. Moreover, the power, intensity, and dynamic strength are less sensitive than the force, pressure, and strength indicators. The same applies for their integrals. Therefore, the integrals of power, intensity, and dynamic strength indicators are more inclined to be medium-term indicators.
As the paper is suggesting "the linear momentum and the new performance indicators should make a significant change in categorizing several indicators in technical analysis."
Technical indicators are using biased mathematical implementations. For example Momentum Index is in reality a velocity indicator, Force index a Momentum indicator and so on. From a Physical perspective correct momentum, force, velocity etc. needs to be corrected and re-categorized.
The author also gives important insights in how these indicators can be used "simultaneously to identify price turning points and filter irrelevant divergences."
"This paper will attempt to adjust the price momentum and force concepts introduced by Welles Wilder and Alexander Elder, respectively. By introducing the concept of linear momentum, new indicators will emerge to dissect the market performance into six main elements: market’s force, pressure, strength, power, intensity, and dynamic strength. This will lead to a deeper insight about market action. The leading performance indicators can be used simultaneously to identify price turning points and filter irrelevant divergences. The linear momentum and the new performance indicators should make a significant change in categorizing several indicators in technical analysis."
Suggestions and feedback are welcome
Hope you enjoy this,
CryptoStatistical
Newton Force and MomentumThis indicator is meant to show the Force of price, based on Newton's Second Law of Motion; and the momentum of price. Force is the value on the left, and momentum on the right.
Originally this was supposed to only be an indicator looking at Force, but because the already popular indicator called "Momentum" does not calculate the momentum of price, but rather the change of price depending on how far back you want to look; I decided to add the Momentum aspect to the indicator.
*BTW if you find this script useful thank and follow @overttherainbow, because they are the one who gave me the idea for this script.*

Stochastic Momentum Index (Stoch MTM, SMI)Stochastic Momentum Index (Stoch MTM, SMI)
The Stochastic Momentum Index (Stoch MTM, SMI) is based on the Stochastic Oscillator. The difference is that the Stochastic Oscillator calculates where the close is relative to the high/low range, while the SMI calculates where the close is relative to the midpoint of the high/low range. The values of the SMI range from +100 to -100. When the close is greater than the midpoint, the SMI is above zero, when the close is less than than the midpoint, the SMI is below zero.
The SMI is interpreted the same way as the Stochastic Oscillator. Extreme high/low SMI values indicate overbought/oversold conditions. A buy signal is generated when the SMI rises above -50, or when it crosses above the signal line. A sell signal is generated when the SMI falls below +50, or when it crosses below the signal line. Also look for divergence with the price to signal the end of a trend or indicate a false trend.
The Stochastic Momentum Index was developed by William Blau and was introduced in his article in the January, 1993 issue of Technical Analysis of Stocks & Commodities magazine.

Stochastic MomentumStochastic Momentum adds shorter and longer term Stochastic movements on the same chart to indicate relative momentum for short and slightly longer term outlooks.
Can be used like a regular Stochastic indicator for overbought / oversold levels, divergence and additionally also the crossing of the shorter (blue) and longer (orange) levels.
It is a leading indicator and often signals early moves of momentum, which may or may not translate into the same price movements.

Seasonal Momentum Indicator This is basically a 5-period seasonal average with an applied momentum (10 ) applied. This is plotted and compared to the current momentum (10). The current momentum is in red while the seasonal momentum is in blue.
You can see that whenever the seasonal momentum and the current momentum are in the same direction, the probability of the trend continuing is higher. Also whenever there is a divergence in the two; the red line (current momentum) will often catch up to the blue (seasonal momentum).
Another use of this indicator is as a divergence detector. If you turn off the red line, you will have only the blue line plotted on the graph. Take this and apply lines to see if the momentum diverges from the price (see example).
I hope you enjoy this one. It only works for securities which have a five year record. You can use it on different time frames but the annual is probably the best and most useful.
Happy Trading
--SpreadEagle71

Noro's Squeeze Momentum Strategy v1.0This strategy uses 3 different indicators:
1) Squeeze Momentum Indicator (by LazyBear)
2) Color of a candle as filter of signals
3) Candle body size as filter of signals (EMA Body)
Strategy
If Squeeze Momentum Indicator is indicated uptrend both at the same time by a candle red and at the same time more than a third of a body of an average candle - to open long (and to close short)
If Squeeze Momentum Indicator is indicated downtrend both at the same time by a candle green and at the same time more than a third of a body of an average candle - to open short (and to close long)

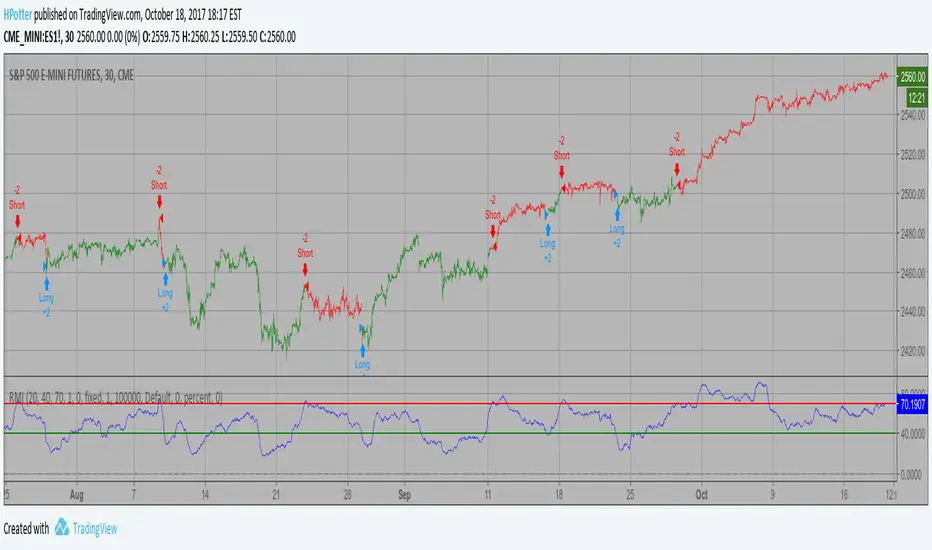
Relative Momentum Index Backtest The Relative Momentum Index (RMI) was developed by Roger Altman. Impressed
with the Relative Strength Index's sensitivity to the number of look-back
periods, yet frustrated with it's inconsistent oscillation between defined
overbought and oversold levels, Mr. Altman added a momentum component to the RSI.
As mentioned, the RMI is a variation of the RSI indicator. Instead of counting
up and down days from close to close as the RSI does, the RMI counts up and down
days from the close relative to the close x-days ago where x is not necessarily
1 as required by the RSI). So as the name of the indicator reflects, "momentum" is
substituted for "strength".
You can change long to short in the Input Settings
WARNING:
- For purpose educate only
- This script to change bars colors.
Relative Momentum Index Strategy The Relative Momentum Index (RMI) was developed by Roger Altman. Impressed
with the Relative Strength Index's sensitivity to the number of look-back
periods, yet frustrated with it's inconsistent oscillation between defined
overbought and oversold levels, Mr. Altman added a momentum component to the RSI.
As mentioned, the RMI is a variation of the RSI indicator. Instead of counting
up and down days from close to close as the RSI does, the RMI counts up and down
days from the close relative to the close x-days ago where x is not necessarily
1 as required by the RSI). So as the name of the indicator reflects, "momentum" is
substituted for "strength".
WARNING:
- This script to change bars colors.

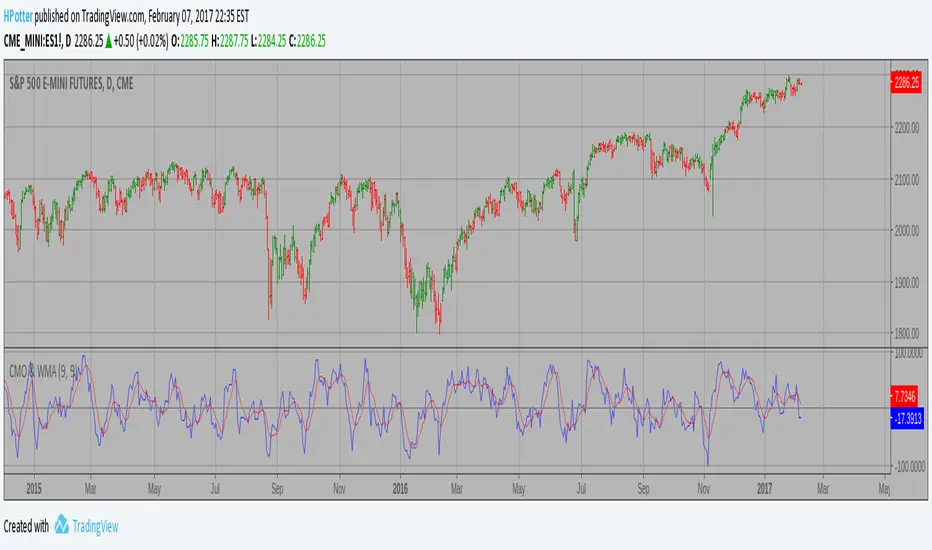
CMO & WMA Strategy This indicator plots Chande Momentum Oscillator and its WMA on the
same chart. This indicator plots the absolute value of CMO.
The CMO is closely related to, yet unique from, other momentum oriented
indicators such as Relative Strength Index, Stochastic, Rate-of-Change,
etc. It is most closely related to Welles Wilder?s RSI, yet it differs
in several ways:
- It uses data for both up days and down days in the numerator, thereby
directly measuring momentum;
- The calculations are applied on unsmoothed data. Therefore, short-term
extreme movements in price are not hidden. Once calculated, smoothing
can be applied to the CMO, if desired;
- The scale is bounded between +100 and -100, thereby allowing you to clearly
see changes in net momentum using the 0 level. The bounded scale also allows
you to conveniently compare values across different securities.
CMO (Chande Momentum Oscillator) Strategy Backtest This indicator plots Chande Momentum Oscillator. This indicator was
developed by Tushar Chande. A scientist, an inventor, and a respected
trading system developer, Mr. Chande developed the CMO to capture what
he calls "pure momentum". For more definitive information on the CMO and
other indicators we recommend the book The New Technical Trader by Tushar
Chande and Stanley Kroll.
The CMO is closely related to, yet unique from, other momentum oriented
indicators such as Relative Strength Index, Stochastic, Rate-of-Change,
etc. It is most closely related to Welles Wilder`s RSI, yet it differs
in several ways:
- It uses data for both up days and down days in the numerator, thereby
directly measuring momentum;
- The calculations are applied on unsmoothed data. Therefore, short-term
extreme movements in price are not hidden. Once calculated, smoothing
can be applied to the CMO, if desired;
- The scale is bounded between +100 and -100, thereby allowing you to
clearly see changes in net momentum using the 0 level. The bounded scale
also allows you to conveniently compare values across different securities.

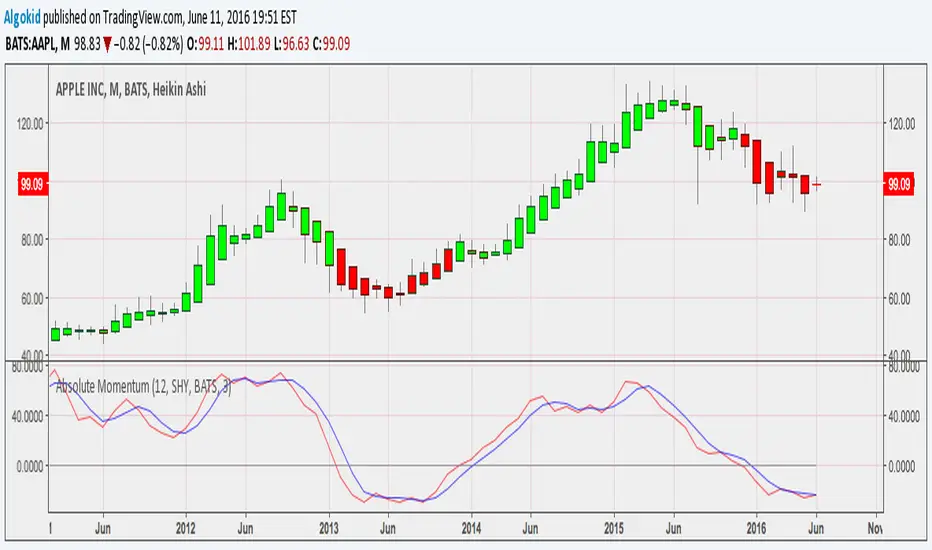
Absolute Momentum Indicator Covered intensevely by Gary Antonnacci in his paper " Absolute Momentum : A simple Rule Based Strategy and Universal Trend Following Overlay , Absolute momentum buys asset with excess return, which is calculated by taking the return of the asset for a giving period of time LESS the Treasury bill rate . The following indicator is based on the rules found in the paper. However you have the liberty to choose your time frame and symbol to calculate the excess return .
Read more about this indicator here
Cheers
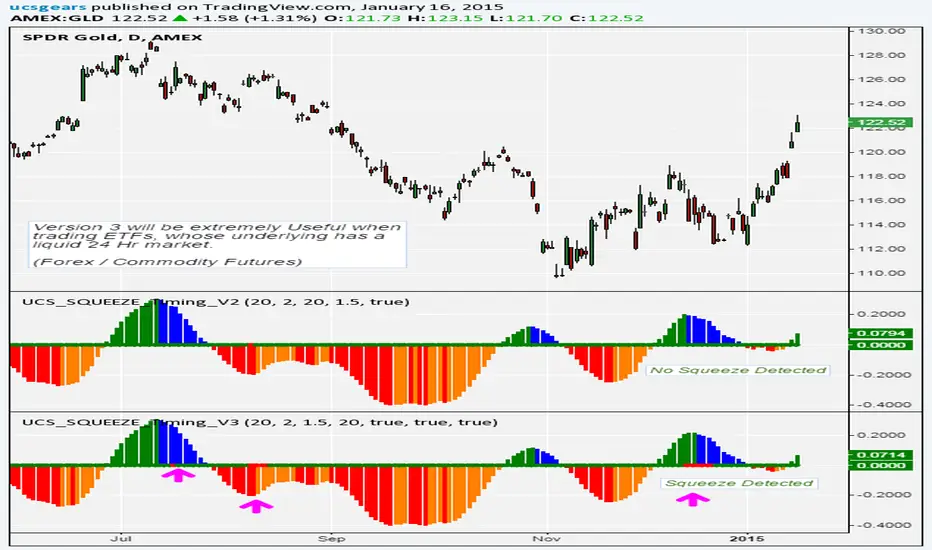
UCS_Squeeze_Timing-V3Another Version with More Features . I am confident enough this works fine now. I am Sure this will be a valuable tool for you guys who love squeezes.
///////////////// This can be further optimized, Let me know with a comment, if you still need this to be optimized. ////////////////////
This update includes
- Added Options to detect squeeze using Heikin Ashi Candle
- Added Options to use BBR or Momentum (ROC) for the Momentum Histogram
- Custom Momentum Smoothing time period
- Removed the Separate Look back periods for BB/KC - Since it doesn't really make sense using different lengths for KC and BB.
HA Closes can be really helpful in trading ETFs like FXE, GLD, FXY, SLV etc, which constantly gaps on daily basis. This helps in smoothing out. And most Importantly it Lines up with the Underlying's Squeeze.
[The Next Major Version is currently being Back tested with better timing triggers etc...... That will replace all other Squeeze indicators in the market - Some Major upgrades have been done to the squeezes to read the consolidation is with support or resistance. Also plan on adding best bet entries and pre-breakout signals. So far so good, this recent contradicting trends in daily / weekly in the market is making the indicator hard to work per theory]
The delay is because, I do not like to post any script (with signals) without sufficient back testing . I will not post these indicator with signals, unless I am sure it works per my theoretical derivations.
-
Thanks for Being Patient and all your support.
Until then - Good Luck Trading.
Squeeze Momentum Indicator [LazyBear]
Fixed a typo in the code where BB multiplier was stuck at 1.5. Thanks @ucsgears for bringing it to my notice.
Updated source: pastebin.com
Use the updated source instead of the what TV shows below.
This is a derivative of John Carter's "TTM Squeeze" volatility indicator, as discussed in his book "Mastering the Trade" (chapter 11).
Black crosses on the midline show that the market just entered a squeeze (Bollinger Bands are with in Keltner Channel). This signifies low volatility, market preparing itself for an explosive move (up or down). Gray crosses signify "Squeeze release".
Mr.Carter suggests waiting till the first gray after a black cross, and taking a position in the direction of the momentum (for ex., if momentum value is above zero, go long). Exit the position when the momentum changes (increase or decrease --- signified by a color change). My (limited) experience with this shows, an additional indicator like ADX / WaveTrend, is needed to not miss good entry points. Also, Mr.Carter uses simple momentum indicator, while I have used a different method (linreg based) to plot the histogram.
More info:
- Book: Mastering The Trade by John F Carter
List of all my indicators:

CMO (Chande Momentum Oscillator)Hi
Let me introduce my CMO (Chande Momentum Oscillator) script.
This indicator plots Chandre Momentum Oscillator. This indicator was
developed by Tushar Chande. A scientist, an inventor, and a respected
trading system developer, Mr. Chande developed the CMO to capture what
he calls "pure momentum". For more definitive information on the CMO and
other indicators we recommend the book The New Technical Trader by Tushar
Chande and Stanley Kroll.
The CMO is closely related to, yet unique from, other momentum oriented
indicators such as Relative Strength Index, Stochastic, Rate-of-Change,
etc. It is most closely related to Welles Wilder`s RSI, yet it differs
in several ways:
- It uses data for both up days and down days in the numerator, thereby
directly measuring momentum;
- The calculations are applied on unsmoothed data. Therefore, short-term
extreme movements in price are not hidden. Once calculated, smoothing
can be applied to the CMO, if desired;
- The scale is bounded between +100 and -100, thereby allowing you to
clearly see changes in net momentum using the 0 level. The bounded scale
also allows you to conveniently compare values across different securities.

AKP Momentum TableThe table give at one glance the RSI,ADX and Relative Strength values on the 15 min,125 min, Daily,Weekly and Monthly timeframes to help identify the stocks with strong momentum securities. The Table is movable at various parts of the screen from a drop down menu and the values of RSI,ADX and RS period can also be changes.Enjoy!

AQR Momentum AQR Momentum – Short Description
Uses the slopes of 20/55/200-day moving averages to measure short-, mid-, and long-term trend direction.
Green = rising trend; Red = falling trend.
55-day slope is the primary momentum signal; 200-day shows the market regime.

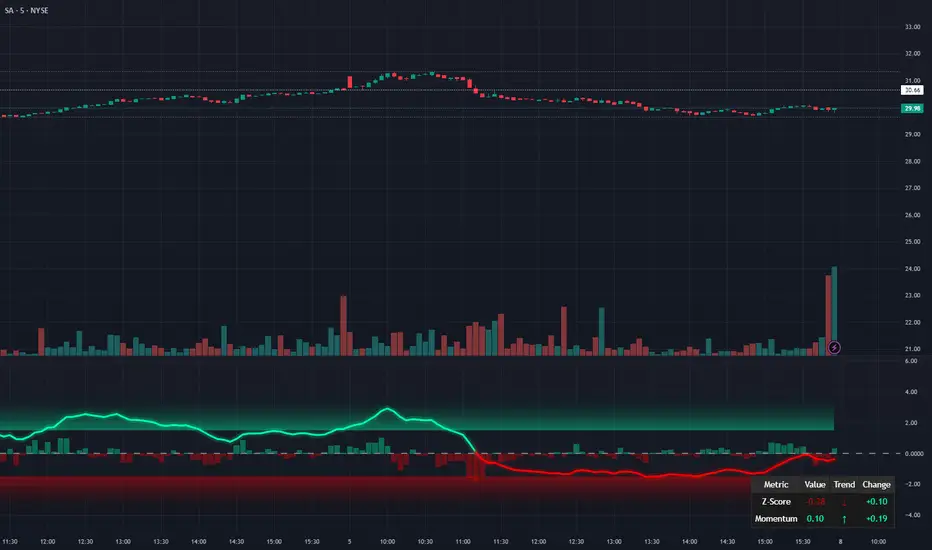
Stop Hunt / Liquidity Sweep Detector with Momentum Ratingdetects liquidity sweeps as they happen then gives you a rating on how much momentum the reversal has.

Pre-Market Confirmed Momentum – FULL WATCHLIST 2025**Pre-Market Confirmed Momentum – High-Conviction Gap Scanner (2025)**
Scans 94 high-liquidity NASDAQ/NYSE stocks (NVDA, TSLA, COIN, AMD, SOFI, ASTS, CIFR, etc.) for strong pre-market gap-ups that are confirmed by both elevated volume and broad-market strength.
**Entry triggers only when ALL are true at 09:29 ET:**
- ≥ +1.5% gap from previous regular close
- Pre-market volume ≥ 2.5× the 20-day average
- QQQ pre-market ≥ +0.5% (market filter)
Back-tested June 2024 – Dec 2025:
68 signals → **+1.96% average intraday return** → **75% win rate** after 1.5% hard stop.
Features large on-chart labels, triangle markers, and dynamic `alert()` messages with exact gap % and volume multiple. Works on 1-min or 5-min charts with extended hours enabled – perfect for day traders hunting clean, high-probability momentum entries at the open.
Ready for watchlist scanning and real-time alerts. Enjoy the edge! 🚀

Session Opening Range Breakout (ORBO)This strategy automates a classic Opening Range Breakout (ORBO) approach: it builds a price range for the first minutes after the market opens, then looks for strong breakouts above or below that range to catch early directional moves.
Concept
The idea behind ORBO is simple:
The first minutes after the session open are often highly informative.
Price forms an “opening range” that acts as a mini support/resistance zone.
A clean breakout beyond this zone can lead to high-momentum moves.
This script turns that logic into a fully backtestable strategy in TradingView.
How the strategy works
Opening Range Session
Default session: 09:30–09:50 (exchange time)
During this window, the script tracks:
orHigh → highest high within the session
orLow → lowest low within the session
This forms your Opening Range for the day.
Breakout Logic (after the window ends)
Once the defined session ends:
Long Entry:
If the close crosses above the Opening Range High (orHigh),
→ strategy.entry("OR Long", strategy.long) is triggered.
Short Entry:
If the close crosses below the Opening Range Low (orLow),
→ strategy.entry("OR Short", strategy.short) is triggered.
Only one opening range per day is considered, which keeps the logic clean and easy to interpret.
Daily Reset
At the start of a new trading day, the script resets:
orHigh := na
orLow := na
A fresh Opening Range is then built using the next session’s 09:30–09:50 candles.
This ensures entries are always based on today’s structure, not yesterday’s.
Visuals & Inputs
Inputs:
Opening range session → default: "0930-0950"
Show OR levels → toggle visibility of OR High / Low lines
Fill range body → optional shaded zone between OR High and OR Low
Chart visuals:
A green line marks the Opening Range High.
A red line marks the Opening Range Low.
Optional yellow fill highlights the entire OR zone.
Background shading during the session shows when the range is currently being built.
These visuals make it easy to see:
Where the OR sits relative to current price
How clean / noisy the breakout was
How often price respects or rejects the opening zone
Backtesting & Optimization
Because this is written as a strategy():
You can use TradingView’s Strategy Tester to view:
Win rate
Net profit
Drawdown
Profit factor
Equity curve
Ideas to experiment with:
Change the session window (e.g., 09:15–09:45, 10:00–10:30)
Apply to different:
Markets: indices, FX, crypto, stocks
Timeframes: 1m / 5m / 15m
Add your own:
Stop Loss & Take Profit levels
Time filters (only trade certain days / times)
Volatility filters (e.g., ATR, range size thresholds)
Higher-timeframe trend filter (e.g., only take longs above 200 EMA)
