Momentum Variance OscillatorWhat MVO measures:
-PV (Price-Volume) Oscillator – how far price is from a volatility-scaled basis, then weighted by relative volume.
- > 0 = bullish pressure; < 0 = bearish pressure.
-|PV| larger ⇒ stronger momentum.
-Signal line (EMA of PV) – a smoother track of PV; crossings flag momentum shifts.
-Zero line gradient – instantly shows direction (greenish bull / reddish bear) and strength (paler → stronger).
-Extreme bands (±obLevel) – “hot zone” thresholds; being beyond them = exceptional push.
-Variance histogram – MACD-like view (PV minus slower PV-EMA) to see thrust building vs. fading.
-(Optional) Bar coloring & background tint – paints price bars and/or the panel on key events so you can read the regime at a glance.
-Auto-Tune – searches a grid of (obLevel, weakLvl) pairs and (optionally) auto-applies the best, ranked by CAGR vs. drawdown.
Core signals & how to trade them:
1) Define the regime:
-Bullish regime: PV above 0 and/or PV above Signal; zero line is in bull gradient.
-Bearish regime: PV below 0 and/or PV below Signal; zero line is in bear gradient.
-Action: Prefer trades with the regime (avoid fading strong color/strength unless you have a clear reversal setup).
2) Entries:
Momentum entry:
-Long: PV crosses above Signal while PV > 0.
-Short: PV crosses below Signal while PV < 0.
Breakout/acceleration:
-Long add-on: PV crosses above +obLevel (extreme top) and holds.
-Short add-on: PV crosses below −obLevel (extreme bottom) and holds.
-Histogram confirm: Growing bars in your direction = thrust improving; shrinking/flip = thrust stalling.
3) Exits / risk:
-Soft exit / tighten stops: PV loses the extreme and re-enters inside, or histogram fades/turns against you.
-Hard exit / reverse: Opposite PV↔Signal crossover and PV crosses the zero line.
-Weak zone filter: If |PV| < weakLvl, treat signals as lower quality (smaller size or skip).
4) Practical setup - Suggested defaults (good starting point):
-Signal length: 26
-Volume power: 0.50
-obLevel (extreme): 2.00
-weakLvl: 0.75
-Show histogram & dots: On
-Auto-Tune (recommended)
-Turn Auto-Select Best ON. MVO will scan obLevel 1.50→3.00 (step 0.05) and weakLvl 0.50→1.00 (step 0.05), then use the top-ranked pair (CAGR/(1+MDD)).
-If you want to see the top combos, enable the Optimizer Table (Top-3).
5) Visual options
-Bar Colors: Regime+Strength – bars follow the zero-line gradient (great for quick read).
-Extremes – paint only when beyond ±obLevel.
-Cross Signals – paint only on the bar that crosses an extreme.
-Background on breach: A one-bar tint when PV crosses an extreme.
6) Example playbook:
Long setup:
-Zero line shows bull gradient and PV > 0.
-PV crosses above Signal (entry).
-If PV drives above +obLevel, consider add-on; trail under the last minor swing or use ATR.
-Exit/trim on PV crossing below Signal or histogram turning negative; flatten on a drop through 0.
Short setup mirrors the above on the bear side.
7) Tips to avoid common traps:
-Don’t fade strong extremes without clear confirmation (e.g., PV re-entering inside + histogram flip).
-Respect the weak zone: if |PV| < weakLvl, signals are fragile—size down or wait.
-Align with structure: higher-timeframe trend and SR improve expectancy.
-Instrument personality matters: use Auto-Tune or re-calibrate obLevel/weakLvl across assets/timeframes.
8) Alerts you can set:
-Bull Signal X – PV crossed above Signal
-Bear Signal X – PV crossed below Signal
-Bull Baseline X – PV crossed above 0
-Bear Baseline X – PV crossed below 0
Cerca negli script per "momentum"

Momentum Index [BigBeluga]The Momentum Index is an innovative indicator designed to measure the momentum of price action by analyzing the distribution of positive and negative momentum values over a defined period. By incorporating delta-based calculations and smoothing techniques, it provides traders with a clear and actionable representation of market momentum dynamics.
🔵 Key Features:
Delta-Based Momentum Analysis:
Calculates the momentum of price by comparing its current state to its value from a defined number of bars back.
Inside a loop, it evaluates whether momentum values are above or below zero, producing a delta value that reflects the net momentum direction and intensity.
Double EMA Smoothing:
Smooths the raw delta-based momentum values with a double EMA filter, reducing noise and providing a clearer trend signal.
tmi(len) =>
sum = 0.0
sum1 = 0.0
above = 0.0
below = 0.0
src_ = src - src
for i = 0 to len
sum := sum + (src_ > nz(src_ ) ? 1 : -1)
sum1 := sum1 + (sum > 0 ? 1 : -1)
sum1 := emaEma(sum1, 10)
for i = 1 to len
above := above + (sum1 > 0 ? 1 : 0)
below := below + (sum1 > 0 ? 0 : 1)
Directional Momentum Signals:
Generates momentum shift signals and displays them on both the oscillator and the main chart:
- △ Aqua Triangles: Represent upward momentum shifts.
- ▽ Red Triangles: Represent downward momentum shifts.
Dynamic Gradient Display:
Highlights momentum zones with gradient fills:
- Aqua shades for positive momentum (above zero).
- Red shades for negative momentum (below zero).
Dashboard Display:
A dashboard summarizing the count of momentum values above and below zero for the defined period (Sentiment Length e.g. 100), helping traders assess market sentiment at a glance.
🔵 How It Works:
The indicator takes price momentum as its source and evaluates the number of momentum values above and below zero within a defined period.
The delta calculation aggregates this information, providing a net representation of the prevailing market momentum.
A double EMA filter is applied to the delta values, smoothing the momentum line and enhancing signal clarity.
Momentum shifts are highlighted with visual signals on the oscillator and price chart, while the gradient display provides a visual representation of intensity.
🔵 Use Cases:
Momentum Tracking: Identify whether market momentum is predominantly bullish or bearish.
Signal Confirmation: Use chart-based signals to confirm potential trend reversals or continuation.
Analyze Market Strength: Leverage the dashboard to quickly assess the distribution of momentum over the chosen period.
Overbought/Oversold Conditions: Utilize gradient zones to detect areas of momentum extremes and possible price exhaustion.
Momentum Index offers a refined approach to analyzing momentum dynamics, combining delta-based calculations with smoothing techniques and intuitive visuals, making it an essential tool for traders looking to anticipate market movements effectively.

Momentum Shift [Bigbeluga]
This indicator identifies momentum shifts using a smoothed momentum calculation. It plots dynamic shift zones consisting of five levels that expand or contract based on price action. When momentum rises, the indicator creates an upward shift zone, and when momentum falls, it generates a downward shift zone. The shift zones dynamically react to price, stopping extension when a level is crossed.
🔵Key Features:
Smoothed Momentum Calculation:
➣ Utilizes a Hull Moving Average (HMA) to smooth momentum and reduce noise.
➣ Identifies momentum shifts with crossovers between the current momentum value and its previous state.
➣ Uses a gradient color scheme to highlight momentum strength.
Dynamic Shift Zones:
➣ When momentum rises, the indicator plots an upper shift zone with five incremental levels.
➣ When momentum falls, a lower shift zone is formed with five descending levels.
➣ Each level within the shift zone represents a progressively stronger momentum shift.
Level Extension Control:
➣ Shift zones stop extending once a level is crossed by price.
➣ Levels closer to price act as key momentum resistance or support zones.
➣ If price retraces after a shift, the remaining levels stay intact for further reference.
Momentum Direction Indications:
➣ Labels (▲ and ▼) appear at momentum shift points to indicate rising or falling momentum.
🔵Usage:
Momentum-Based Entries: Identify momentum shifts early by using shift zones as confirmation for trade entries.
Trend Continuation & Exhaustion: Observe which shift levels price respects—if momentum shift zones hold, the trend may continue; if they break, momentum may reverse.
Dynamic Support & Resistance: Use the five-level shift zones as temporary support and resistance areas that adapt to momentum shifts.
Momentum Strength Analysis: If price moves through multiple shift levels in one direction, it signals strong momentum in that direction.
Momentum Shift is a powerful tool for traders looking to analyze momentum shifts with structured visual zones. By combining smoothed momentum calculations with dynamic shift zones, this indicator provides a clear view of market momentum and helps traders navigate price action effectively.

Momentum Percentage %A Percentage Momentum Indicator (oscillator) is a technical indicator which shows the trend direction and measures the pace of the price fluctuation by comparing current and past values. Normalized to be bounded to oscillate between 0 and 100 percent of recent price variation. As is, it average true range of an instrument can be easily compared to any other because of absolute percentage variation and not prices itselves.
The benefits of Percentage Momentum
It indicates volatility
It ideal to compare fluctuation and volatility between other assets
In assets that changes btw a large range of prices like crypto it's the best way to work with momentum.
It's the right way to work with algotrading.

Multi-timeframe MomentumThe Multi-timeframe momentum indicator is similar in concept to a velocity indicator like rate-of-change, but visualizes smoothed price changes by applying an EMA and linear regression to price difference at every bar. Momentums from 1 minute to 1 quarter are plotted on a single chart using the request.security function. Standard and Fibonacci timeframes are available as well as the ability to hide high-timeframes to keep the chart clean. Like any oscillator, divergence in the momentums can be used to identify price reversals in conjunction with support and resistance. When linear regression is applied, high and low inflection points are used to identify reversals in a manner similar to MACD.
Much love to DumpCap! The script is presented sans secret sauce.

Institutional Quantum Momentum Impulse [BullByte]## Overview
The Institutional Quantum Momentum Impulse (IQMI) is a sophisticated momentum oscillator designed to detect institutional-level trend strength, volatility conditions, and market regime shifts. It combines multiple advanced technical concepts, including:
- Quantum Momentum Engine (Hilbert Transform + MACD Divergence + Stochastic Energy)
- Fractal Volatility Scoring (GARCH + Keltner-based volatility)
- Dynamic Adaptive Bands (Self-adjusting thresholds based on efficiency)
- Market Phase Detection (Volume + Momentum alignment)
- Liquidity & Cumulative Delta Analysis
The indicator provides a Z-score normalized momentum reading, making it ideal for mean-reversion and trend-following strategies.
---
## Key Features
### 1. Quantum Momentum Core
- Combines Hilbert Transform, MACD divergence, and Stochastic Energy into a single composite momentum score.
- Normalized using a Z-score for statistical significance.
- Smoothed with EMA/WMA/HMA for cleaner signals.
### 2. Dynamic Adaptive Bands
- Upper/Lower bands adjust based on volatility and efficiency ratio .
- Acts as overbought/oversold zones when momentum reaches extremes.
### 3. Market Phase Detection
- Identifies bullish , bearish , or neutral phases using:
- Volume-Weighted MA alignment
- Fractal momentum extremes
### 4. Volatility & Liquidity Filters
- Fractal Volatility Score (0-100 scale) shows market instability.
- Liquidity Check ensures trades are taken in favorable spread conditions.
### 5. Dashboard & Visuals
- Real-time dashboard with key metrics:
- Momentum strength, volatility, efficiency, cumulative delta, and market regime.
- Gradient coloring for intuitive momentum visualization .
---
## Best Trade Setups
### 1. Trend-Following Entries
- Signal :
- QM crosses above zero + Market Phase = Bullish + ADX > 25
- Cumulative Delta rising (buying pressure)
- Confirmation :
- Efficiency > 0.5 (strong momentum quality)
- Liquidity = High (tight spreads)
### 2. Mean-Reversion Entries
- Signal :
- QM touches upper band + Volatility expanding
- Market Regime = Ranging (ADX < 25)
- Confirmation :
- Efficiency < 0.3 (weak momentum follow-through)
- Cumulative Delta divergence (price high but delta declining)
### 3. Breakout Confirmation
- Signal :
- QM holds above zero after a pullback
- Market Phase shifts to Bullish/Bearish
- Confirmation :
- Volatility rising (expansion phase)
- Liquidity remains high
---
## Recommended Timeframes
- Intraday (5M - 1H): Works well for scalping & swing trades.
- Swing Trading (4H - Daily): Best for trend-following setups.
- Position Trading (Weekly+): Useful for macro trend confirmation.
---
## Input Customization
- Resonance Factor (1.0 - 3.618 ): Adjusts MACD divergence sensitivity.
- Entropy Filter (0.382/0.50/0.618) : Controls stochastic damping.
- Smoothing Type (EMA/WMA/HMA) : Changes momentum responsiveness.
- Normalization Period : Adjusts Z-score lookback.
---
The IQMI is a professional-grade momentum indicator that combines institutional-level concepts into a single, easy-to-read oscillator. It works across all markets (stocks, forex, crypto) and is ideal for traders who want:
✅ Early trend detection
✅ Volatility-adjusted signals
✅ Institutional liquidity insights
✅ Clear dashboard for quick analysis
Try it on TradingView and enhance your trading edge! 🚀
Happy Trading!
- BullByte

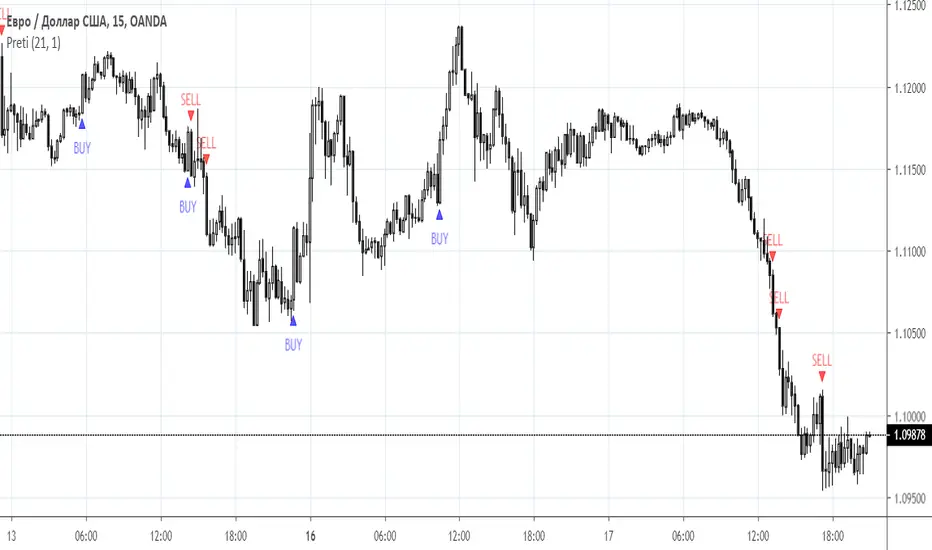
Momentum indicator PretiPreti Momentum Indicator
Class : volatility
Trading type : intraday trading
Time frame : 5 min -1 day
Purpose : momentum trading
Level of aggressiveness : standard
“Preti Momentum Indicator” is based on price patterns detection after abnormal price changes. One of the patterns based on abnormal returns is as follows: after an abnormally strong rise / fall in price short-term momentum movement appears.
This indicator, using a specialized statistical technics, identifies moments of abnormal returns and generates trading signals based on momentum effect.
“Preti Momentum Indicator” displays buy / sell signals directly on the chart, which makes it very easy to understand and used even for beginners in trading and technical analysis.
Parameters of the indicator
To configure the indicator, the following parameters are provided:
- Period (default value is 21) - period of indicator. It is used to define normal returns.
- Dev (default value - 1) – Is used to detect abnormal returns. It defines levels of aggressiveness in trading signals. The bigger the value is the more conservative signals are generated
Rules of trading
The rules of trading are extremely easy. The appearance of a “sell” (sell signal) and “buy” (buy signal) on the chart is a signal to open appropriate position.
Accelerating Dual Momentum ScoreThis is a score metric used by the Accelerating Dual Momentum strategy.
According to the website you referenced when you created, the strategy is as follows:
Strategy Rules
This strategy allocates 100% of of the portfolio to one asset each month.
1. On the last trading day of each month, calculate the “momentum score” for the S&P 500 ( SPY ) and the international small cap equities (SCZ). The momentum score is the average of the 1, 3, and 6-month total return for each asset.
2. If the momentum score of SCZ > SPY and is greater than 0, invest in SCZ.
3. If the momentum score of SPY > SCZ and is greater than 0, invest in SPY .
4. If neither momentum score is greater than 0, calculate the 1-month total return for long-term US Treasuries ( TLT ) and US TIPS (TIP). Invest in whichever has the higher return.
Source: portfoliodb.co

Jerry Romine Momentum Dream With Risk ManagementThe Momentum Dream Indicator with Risk Management is really two powerful indicators combined in one.
The Momentum Dream Indicator is a volatility and momentum indicator that measures the relationship between the Bollinger Bands and Keltner Channels to help identify consolidations and signal potential breakouts.
MOMENTUM DREAM INDICATOR:
SIGNALS AND ZONES:
Green Arrow = Post Squeeze Buy Triggered = GREEN ⇧ shows squeeze out on upward momentum (often a good time to buy)
Orange Arrow = Post Squeeze Sell Alert = ORANGE ⇩ shows squeeze out on downward momentum (often a good time to sell or NOT buy)
Green Dot on Chart - Day one of the buy zone
Green Shading - Buy Zone
Pink Dot on Chart - Day one of warning zone
Red Shading - Warning zone. Often a good time not to buy or to consider selling.
LABELS (Color Indicates Direction):
Momo Up / Down = Current momentum direction.
Squeeze = Squeeze is on and squeeze line dots are red.
Dots = number of day or bars the squeeze has been in red(on)
Squeeze Fired = Green or Orange arrow shows squeeze fired direction.
Stacked = Fibonacci 8, 21, 34, 55, 89 EMA are stacked up or down
SQUEEZE LINE COLOR DEFINITIONS:
Dark Red = Extra Squeeze (In & Out)
Red = Original Squeeze (In & Out)
Pink = Pre-Squeeze (In)
Yellow = Pre-Squeeze (Out)
Green = Bollinger Bands are officially outside of Keltner Channels
STRATEGY
There are multiple ways the Momentum Dream Indicator can be used.
1. Buy/Sell during the squeeze (generally lower volatility and lower option premiums)
2. Buy/Sell when the squeeze fires to catch the breakout (volume/volatility often increase)
3. Use Buy/Sell Zones with other signals for entering positions
4. Use Momentum to assist with position direction
5. Use fading momentum to tighten stops or close positions.
* The labels only show when certain criteria are met. For example if a squeeze fired the label only shows on that day but the indicator arrow will always show. For this reason the labels on the chart above will vary from day to day and only alert you when needed. :)
RISK MANAGEMENT INDICATOR
Risk management is a vital part of investing and this indicator provides 2 recommended positions sizes. One based on the classic 1-2% risk rule where you never risk more than X% of your account. A second based on position size not exceeding X% of your account.
The Risk Management Indicator does all of the hard math and provides you with a realistic trading plan, position size, and trail stop based on your customizable criteria. If you’ve ever wondered how much of a stock to buy, when to sell and when to take profits this indicator is for you!
Please Use the link below for more information or to purchase.

Momentum Structural AnalysisMomentum Structural Analysis (MSA‑style Oscillator)
This indicator implements a simple, MSA‑style momentum oscillator that measures how far price has moved above or below its own long‑term trend on the active timeframe, expressed in percentage terms. Instead of looking at raw price, it "oscillates" price around a timeframe‑appropriate simple moving average (SMA) and plots the percentage distance from that SMA as an orange line around a zero baseline. Zero means price is exactly at its structural trend; positive values mean price is extended above trend; negative values mean it is trading below trend.
The script automatically selects the SMA length based on the chart timeframe:
On daily charts it uses the configurable Daily SMA Length (default 252 trading days, roughly 1 year).
On weekly charts it uses Weekly SMA Length (default 208 weeks).
On monthly charts it uses Monthly SMA Length (default 120 months).
This approach is inspired by the ideas behind Momentum Structural Analysis (MSA), which studies where a market trades relative to long‑term moving averages and then treats the momentum line (the oscillator) as the primary object of analysis. The goal is to highlight structural overbought/oversold conditions and regime changes that are often clearer on momentum than on the raw price chart.
--------------------------------------------------
What the script computes and how it works
For each bar, the indicator:
Chooses an SMA length based on the current timeframe (daily/weekly/monthly).
Calculates the SMA of the close.
Computes the percentage distance:
\text{Diff %} = \frac{\text{Close} - \text{SMA}}{\text{SMA}} \times 100
Plots this Diff % as an orange line, with a dashed horizontal zero line as the base.
This produces a momentum oscillator that oscillates around zero and reflects the "structural" position of price versus its own long‑term mean.
--------------------------------------------------
How to use it on index charts (e.g., NIFTY50)
On indices like NIFTY50, use the indicator to see how stretched the index is versus its structural trend.
Typical uses:
Identify extremes: a). Historically high positive readings can signal euphoric, late‑stage conditions where risk is elevated. b). Deep negative readings can highlight panic/capitulation zones where downside may be exhausted.
Draw structural levels: a). Mark horizontal bands on the oscillator where past turns have occurred (e.g., +15%, −10%, etc. specific to NIFTY50). b). Watch how price behaves when the oscillator revisits these zones: repeated rejections can validate them as structural bounds; clean breaks can indicate a change of regime.
This is not a buy/sell signal generator by itself; it is a framework to understand where the index sits within its long‑term momentum structure and to support risk‑management decisions.
--------------------------------------------------
How to use it on ratio charts
Apply the same indicator to ratio symbols such as NIFTY50/GOLD, BANKNIFTY/NIFTY50, sector vs index, or any spread you plot as a ratio.
On a ratio chart:
The oscillator now measures relative momentum: how far that ratio is above or below its own long‑term mean.
High positive readings = strong outperformance of the numerator vs the denominator (e.g., equities strongly outperforming gold).
Deep negative readings = strong underperformance (e.g., equities structurally lagging gold).
This is very much in the spirit of MSA’s work on spreads between asset classes: it helps visualize major rotations (equities → gold, financials → commodities, etc.) and whether a relative‑performance trend is stretched, reverting, or breaking into a new phase.
--------------------------------------------------
Using multiple timeframes for better decisions
You can stack information across timeframes to get a more robust view:
Monthly : a). Use monthly charts to see secular/structural phases. b). Long multi‑year stretches above or below zero, and large bases or trendline breaks on the monthly oscillator, can mark major bull or bear cycles and big rotations between asset classes.
Weekly : a). Use weekly charts for the primary trend. b). Weekly structures (multi‑month highs/lows, channels, or trendlines on the oscillator) are useful for medium‑term positioning and for confirming or rejecting signals seen on the monthly view.
Daily : a). Use daily charts mainly for timing entries/exits once the higher‑timeframe direction is clear. b). Short‑term extremes on the daily oscillator that align with the larger weekly/monthly structure can offer better‑timed opportunities, while signals that contradict higher‑timeframe momentum are more likely to be noise.
--------------------------------------------------

Momentum Concepts [AlgoAlpha]🚀 Introducing the Momentum Concepts™ , a robust multi-layered momentum analysis tool developed by AlgoAlpha . This All-in-One indicator offers a comprehensive approach to understanding market momentum, empowering traders with hyper customizable features to tailor their analysis to their specific trading strategies.
Designed with efficiency and compactness in mind, the script shows momentum regimes on three time horizons: The short-term ( Fast Oscillator ), medium-term ( Scalper's Momentum ) and long-term ( Momentum Impulse Oscillator and Hidden Liquidity Flow ). Additionally, the script also includes reversal signals for traders who prefer to trade contrarian/mean-reversion strategies. By utilizing a blend of advanced algorithms and customizable parameters, Momentum Concepts™ provides traders with a vast array of trading strategies ranging from high frequency scalping to timing better entries on long-term swing and investing positions.
Let's delve into the key features and functionalities of this versatile indicator:
🎯Key Features (summary):
Customizable Fast Oscillator: Tailor the fast oscillator to your preferences with adjustable settings for type, source, trend identification(signal processing) method, length, and more.
Divergence Detection: Identify potential trend reversals with ease using built-in divergence detection for both bullish and bearish signals.
Momentum Impulse Oscillator: Gain deeper insights into trending/ranging markets and underlying market bias with a dedicated oscillator, featuring adjustable trend impulse thresholds.
Scalper's Momentum: Utilize a specialized momentum indicator designed for scalping strategies, featuring agility in signal detection with noise reduction and customizable smoothing parameters.
Hidden Liquidity Flow Analysis: Assess hidden liquidity flows within the market, highlighting excess liquidity and potential squeeze situations.
Trend Confluence Indicator: Evaluate the overall momentum direction with dynamically colored zones, aggregating signals from Momentum Concepts™ components for a holistic view.
User-Friendly Interface: The indicator is presented in a clear and intuitive manner, making it accessible for traders of all experience levels.
All-Rounded Alerts: The indicator comes with a comprehensive alerts extension in a separate script, allowing you to stay informed of important market movements even when away from your trading platform.
🎯Key Features (in-depth):
The Fast Oscillator within Momentum Concepts™ comprises four components designed to provide insights into short-term momentum dynamics:
🔱Price Volume Swings :
This confirmation component uses our proprietary Price Volume Algorithm to analyze price action and volume to identify buying and selling pressure, aiding traders in spotting short-term swings for potential trading opportunities.
⚜️Price Volume Waves :
This leading component also uses our proprietary Price Volume Algorithm but differs from the Price Volume Swings by capturing dominant wave patterns instead. This indicator breaks down price and volume data into a wave-like plot which enables leading insights into market momentum due to the relatively predicable nature of sine-like waves. Leading components such as this and the Alpha Wave are best used with other confirmation components within the Momentum Concepts™ .
🌊Alpha Wave :
The Alpha Wave is a leading non-volume alternative to the Price Volume Waves . It reflects market momentum by analyzing price action only instead of using volume data, resulting in a normalized wave-like plot similar to that of the Price Volume Waves , offering a leading perspective on potential market momentum shifts. Leading components such as this and the Price Volume Waves are best used with other confirmation components within the Momentum Concepts™ .
🐲Dragon RSI :
The Dragon RSI is a confirmation component that determines market momentum by analyzing the directional movement of the Relative Strength Index (RSI). By doing so, users are able to visually identify the current short term trend of the market as well as identify overbought and oversold conditions.
Reversal Signals :
All the Fast Oscillator components come with reversal signals that are based on the respective components being either oversold or overbought.
Divergences :
All the Fast Oscillator components come with bullish and bearish divergences. Divergences within the Fast Oscillator components of Momentum Concepts ™ offer crucial signals for trend shifts. 🔱 Price Volume Swings and ⚜️ Price Volume Waves detect weakening buying or selling pressure, signalling potential reversals or continuations. 🌊 Alpha Wave and 🐲 Dragon RSI identify divergences between momentum and price, aiding traders in anticipating market movements. Leveraging these divergences enhances analysis, aiding traders in formulating meaningful analysis.
Customizable Signal Processing Methods :
All the Fast Oscillator components come with customizable signal processing methods to identify trends on the Fast Oscillator , they include (but not limited to) methods such as Heiken Ashi, and a vast selection of Moving Averages.
Diminishing Momentum Warning :
All the Fast Oscillator components come with a diminishing momentum warning that represents a reducing momentum on the Fast Oscillator . This can act as a take profit signal or as a precautionary warning that the price is about to change direction soon even though the Fast Oscillator has not detected it yet.
Dynamically Colored Reversal Zones :
Last but not least, the dynamic coloring of the reversal zones for Fast Oscillator can be customised based on either the reversal probability of the Fast Oscillator or based on the overall trend confluence of all the components within the Momentum Concepts™ indicator.
The Momentum Impulse Oscillator in Momentum Concepts™ offers crucial insights into long-term momentum trends, aiding traders in identifying the underlying momentum regime and differentiating between trending and consolidating markets.
Underlying Momentum Bias
By default, the Momentum Impulse Oscillator is set to show the longer term trend of price action, this can be used to set the directional bias for the markets and prevent users from trading against the trend.
Trending/Ranging Detection
The Momentum Impulse Oscillator comes with the option to enable trending thresholds, when the Momentum Impulse Oscillator is beyond these thresholds, it indicates a trending market, when Momentum Impulse Oscillator is within the thresholds, it indicates a consolidating/ranging market.
The Scalper's Momentum within Momentum Concepts™ furnishes traders with nuanced signals ideal for short to medium-term trading strategies. It efficiently displays both the medium-term momentum and any emerging divergences towards the opposing direction.
Medium-Term Momentum
The Scalper's Momentum is designed to fill the analysis gap between the Fast Oscillator and the Momentum Impulse Oscillator . Showing momentum insights over the medium-term.
Momentum Convergence-Divergence
The Scalper's Momentum is also capable of showing momentum convergences and divergences, which can be used as take-profit and/or confirmation signals to other components within Momentum Concepts™ .
The Hidden Liquidity Flow component of Momentum Concepts™ is designed to uncover underlying liquidity dynamics. This feature enables traders to anticipate potential price movements based on changes in liquidity flow, enhancing their ability to make informed trading decisions.
Underlying Liquidity Dynamics
The Hidden Liquidity Flow shows the underlying liquidity flow of the market, a positive liquidity flow indicates that liquidity is entering the market and increasing the probability of bullish price action, the opposite is true for negative liquidity flows.
Excess Liquidity Flow
The Hidden Liquidity Flow also indicates when there is an abnormal amount of liquidity flowing through the market, this can indicate the potential for volatility and explosive price action.
🎯Usage Examples:
Now that we have gone through the components and features of Momentum Concepts™ in detail, we'll walk you through the usage examples and strategies that you can utilise to navigate the markets.
Scalping
Using the Scalper's Momentum and the Fast Oscillator as an example, users can first use the Scalper's Momentum as a directional bias and the Fast Oscillator as a means of timing a more precise entry. Take profits can be based on either the Diminishing Momentum Warnings or the Fast Oscillator flipping signals or the Scalper's Momentum flipping signals.
Buying the Dip/Shorting the Pump
Using the Momentum Impulse Oscillator and the Fast Oscillator as an example, users will need to first determine the underlying trend with the Momentum Impulse Oscillator , after which they can use the Fast Oscillator for entry signals into the trend. Take profits can be based on either the Diminishing Momentum Warnings or the Fast Oscillator flipping signals
Reversal Trading
Using the Momentum Impulse Oscillator on a timeframe roughly 3-4 times greater than the chart's timeframe and the Fast Oscillator as an example, users will need to first ensure that the Momentum Impulse Oscillator signals a ranging market on a higher timeframe, divergence signals from the Fast Oscillator can then be used as entries. Take profits can be based on either the Diminishing Momentum Warnings or the Fast Oscillator flipping signals or the Fast Oscillator reaching the zero line.
(These are just examples for reference, the Momentum Concepts™ offers significantly more possibilities for customisation and fine tuning of your trading strategy.)
🎯Conclusion:
In conclusion, Momentum Concepts™ stands as a versatile and powerful tool for traders seeking to decode the intricacies of market momentum across multiple time horizons. With its comprehensive suite of customizable features, including the Fast Oscillator , Scalper's Momentum , Momentum Impulse Oscillator , and Hidden Liquidity Flow , traders can gain deep insights into market dynamics and make well-informed trading decisions. Whether executing high-frequency scalping strategies or timing entries for longer-term positions, Momentum Concepts™ equips traders with the tools they need to navigate diverse market conditions with confidence. By harnessing the power of momentum analysis, this indicator empowers traders to stay ahead of the curve and capitalize on emerging opportunities in the ever-evolving financial markets.
Script a pagamento

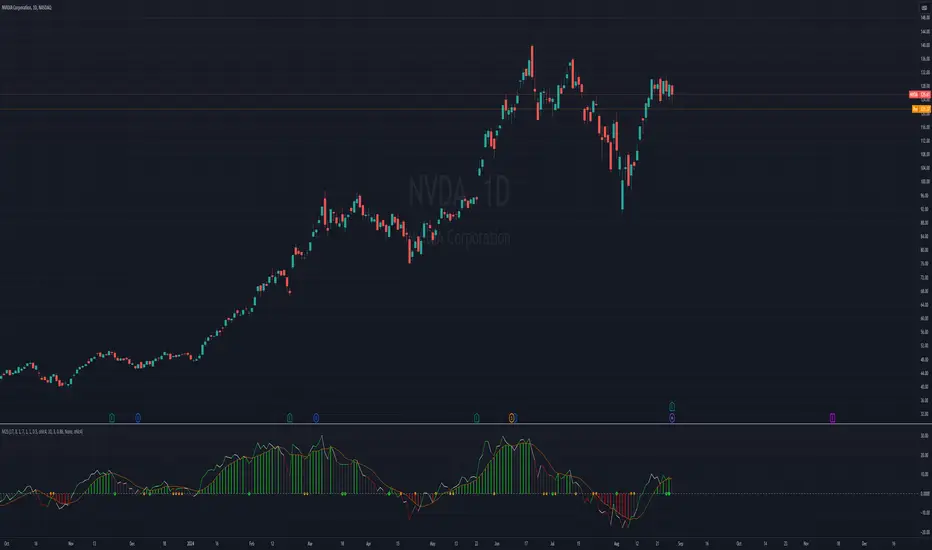
ML - Momentum Index (Pivots)Building upon the innovative foundations laid by Zeiierman's Machine Learning Momentum Index (MLMI), this variation introduces a series of refinements and new features aimed at bolstering the model's predictive accuracy and responsiveness. Licensed under the Creative Commons Attribution-NonCommercial-ShareAlike 4.0 International License (CC BY-NC-SA 4.0), my adaptation seeks to enhance the original by offering a more nuanced approach to momentum-based trading.
Key Features :
Pivot-Based Analysis: Shifting focus from trend crosses to pivot points, this version employs pivot bars to offer a distinct perspective on market momentum, aiding in the identification of critical reversal points.
Extended Parameter Set: By integrating additional parameters for making predictions, the model gains improved adaptability, allowing for finer tuning to match market conditions.
Dataset Size Limitation: To ensure efficiency and mitigate the risk of calculation timeouts, a cap on the dataset size has been implemented, balancing between comprehensive historical analysis and computational agility.
Enhanced Price Source Flexibility: Users can select between closing prices or (suggested) OHLC4 as the basis for calculations, tailoring the indicator to different analysis preferences and strategies.
This adaptation not only inherits the robust framework of the original MLMI but also introduces innovations to enhance its utility in diverse trading scenarios. Whether you're looking to refine your short-term trading tactics or seeking stable indicators for long-term strategies, the ML - Momentum Index (Pivots) offers a versatile tool to navigate the complexities of the market.
For a deeper understanding of the modifications and to leverage the full potential of this indicator, users are encouraged to explore the tooltips and documentation provided within the script.
The Momentum Indicator calculations have been transitioned to the MLMomentumIndex library, simplifying the process of integration. Users can now seamlessly incorporate the momentumIndexPivots function into their scripts to conduct detailed momentum analysis with ease.

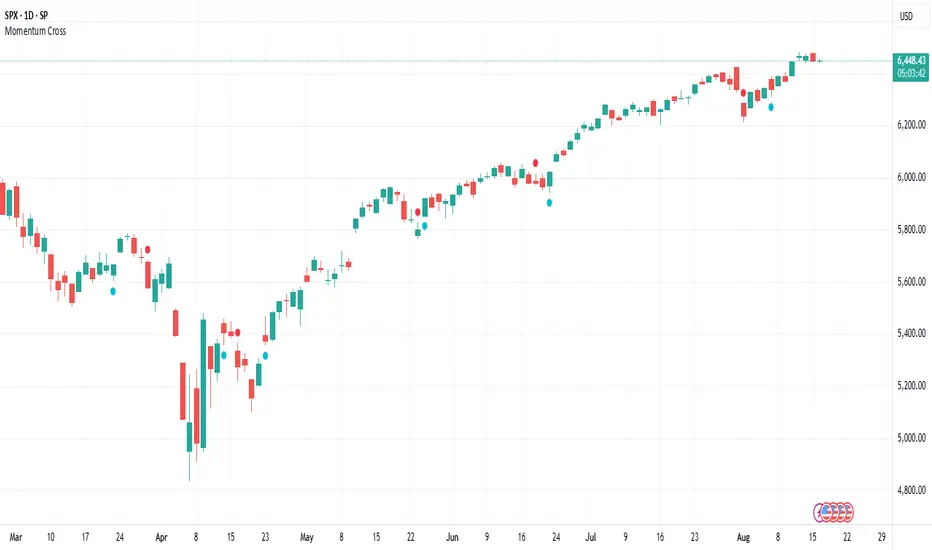
Momentum CrossThis indicator tracks momentum shifts using a 3-period EMA crossing above or below an 8-period EMA. It's simple, and quite effective as a momentum confirmation signal.
Signals:
Cyan circles below bars - Bullish momentum (3 EMA crosses above 8 EMA)
Red circles above bars - Bearish momentum (3 EMA crosses below 8 EMA)
Setups to Use:
V-Shaped Reversals: When price hits major support/resistance and shows rejection, the momentum cross confirms whether the reversal has legs or not. Helps separate real bounces from dead cat bounces.
One-Two Punch Pattern: My favorite high-probability setup: Initial cross shows momentum shifting, counter-move gets rejected quickly, second cross in original direction with follow-through.
Opening Range Breakout Confirmation: Use momentum crosses to confirm pullbacks or retests to key levels after opening range breakouts. The cross timing shows when the retest is holding and momentum is resuming in the breakout direction.
Fibonacci Support/Resistance: Momentum crosses at key Fibonacci levels (38.2%, 50%, 61.8%, 1.272%, and 1.618%) help confirm whether the level will hold or break. Particularly useful for timing entries at these widely-watched levels.
Settings:
Default 3/8 EMAs work well for most situations. Faster settings (2/5) for active markets, slower (5/13) for cleaner signals in strong trends.
Notes:
This works best when combined with key levels, volume, and market context. The cross timing is what matters - it shows when momentum is actually shifting, not just when price bounces.
Risk-Adjusted Momentum Oscillator# Risk-Adjusted Momentum Oscillator (RAMO): Momentum Analysis with Integrated Risk Assessment
## 1. Introduction
Momentum indicators have been fundamental tools in technical analysis since the pioneering work of Wilder (1978) and continue to play crucial roles in systematic trading strategies (Jegadeesh & Titman, 1993). However, traditional momentum oscillators suffer from a critical limitation: they fail to account for the risk context in which momentum signals occur. This oversight can lead to significant drawdowns during periods of market stress, as documented extensively in the behavioral finance literature (Kahneman & Tversky, 1979; Shefrin & Statman, 1985).
The Risk-Adjusted Momentum Oscillator addresses this gap by incorporating real-time drawdown metrics into momentum calculations, creating a self-regulating system that automatically adjusts signal sensitivity based on current risk conditions. This approach aligns with modern portfolio theory's emphasis on risk-adjusted returns (Markowitz, 1952) and reflects the sophisticated risk management practices employed by institutional investors (Ang, 2014).
## 2. Theoretical Foundation
### 2.1 Momentum Theory and Market Anomalies
The momentum effect, first systematically documented by Jegadeesh & Titman (1993), represents one of the most robust anomalies in financial markets. Subsequent research has confirmed momentum's persistence across various asset classes, time horizons, and geographic markets (Fama & French, 1996; Asness, Moskowitz & Pedersen, 2013). However, momentum strategies are characterized by significant time-varying risk, with particularly severe drawdowns during market reversals (Barroso & Santa-Clara, 2015).
### 2.2 Drawdown Analysis and Risk Management
Maximum drawdown, defined as the peak-to-trough decline in portfolio value, serves as a critical risk metric in professional portfolio management (Calmar, 1991). Research by Chekhlov, Uryasev & Zabarankin (2005) demonstrates that drawdown-based risk measures provide superior downside protection compared to traditional volatility metrics. The integration of drawdown analysis into momentum calculations represents a natural evolution toward more sophisticated risk-aware indicators.
### 2.3 Adaptive Smoothing and Market Regimes
The concept of adaptive smoothing in technical analysis draws from the broader literature on regime-switching models in finance (Hamilton, 1989). Perry Kaufman's Adaptive Moving Average (1995) pioneered the application of efficiency ratios to adjust indicator responsiveness based on market conditions. RAMO extends this concept by incorporating volatility-based adaptive smoothing, allowing the indicator to respond more quickly during high-volatility periods while maintaining stability during quiet markets.
## 3. Methodology
### 3.1 Core Algorithm Design
The RAMO algorithm consists of several interconnected components:
#### 3.1.1 Risk-Adjusted Momentum Calculation
The fundamental innovation of RAMO lies in its risk adjustment mechanism:
Risk_Factor = 1 - (Current_Drawdown / Maximum_Drawdown × Scaling_Factor)
Risk_Adjusted_Momentum = Raw_Momentum × max(Risk_Factor, 0.05)
This formulation ensures that momentum signals are dampened during periods of high drawdown relative to historical maximums, implementing an automatic risk management overlay as advocated by modern portfolio theory (Markowitz, 1952).
#### 3.1.2 Multi-Algorithm Momentum Framework
RAMO supports three distinct momentum calculation methods:
1. Rate of Change: Traditional percentage-based momentum (Pring, 2002)
2. Price Momentum: Absolute price differences
3. Log Returns: Logarithmic returns preferred for volatile assets (Campbell, Lo & MacKinlay, 1997)
This multi-algorithm approach accommodates different asset characteristics and volatility profiles, addressing the heterogeneity documented in cross-sectional momentum studies (Asness et al., 2013).
### 3.2 Leading Indicator Components
#### 3.2.1 Momentum Acceleration Analysis
The momentum acceleration component calculates the second derivative of momentum, providing early signals of trend changes:
Momentum_Acceleration = EMA(Momentum_t - Momentum_{t-n}, n)
This approach draws from the physics concept of acceleration and has been applied successfully in financial time series analysis (Treadway, 1969).
#### 3.2.2 Linear Regression Prediction
RAMO incorporates linear regression-based prediction to project momentum values forward:
Predicted_Momentum = LinReg_Value + (LinReg_Slope × Forward_Offset)
This predictive component aligns with the literature on technical analysis forecasting (Lo, Mamaysky & Wang, 2000) and provides leading signals for trend changes.
#### 3.2.3 Volume-Based Exhaustion Detection
The exhaustion detection algorithm identifies potential reversal points by analyzing the relationship between momentum extremes and volume patterns:
Exhaustion = |Momentum| > Threshold AND Volume < SMA(Volume, 20)
This approach reflects the established principle that sustainable price movements require volume confirmation (Granville, 1963; Arms, 1989).
### 3.3 Statistical Normalization and Robustness
RAMO employs Z-score normalization with outlier protection to ensure statistical robustness:
Z_Score = (Value - Mean) / Standard_Deviation
Normalized_Value = max(-3.5, min(3.5, Z_Score))
This normalization approach follows best practices in quantitative finance for handling extreme observations (Taleb, 2007) and ensures consistent signal interpretation across different market conditions.
### 3.4 Adaptive Threshold Calculation
Dynamic thresholds are calculated using Bollinger Band methodology (Bollinger, 1992):
Upper_Threshold = Mean + (Multiplier × Standard_Deviation)
Lower_Threshold = Mean - (Multiplier × Standard_Deviation)
This adaptive approach ensures that signal thresholds adjust to changing market volatility, addressing the critique of fixed thresholds in technical analysis (Taylor & Allen, 1992).
## 4. Implementation Details
### 4.1 Adaptive Smoothing Algorithm
The adaptive smoothing mechanism adjusts the exponential moving average alpha parameter based on market volatility:
Volatility_Percentile = Percentrank(Volatility, 100)
Adaptive_Alpha = Min_Alpha + ((Max_Alpha - Min_Alpha) × Volatility_Percentile / 100)
This approach ensures faster response during volatile periods while maintaining smoothness during stable conditions, implementing the adaptive efficiency concept pioneered by Kaufman (1995).
### 4.2 Risk Environment Classification
RAMO classifies market conditions into three risk environments:
- Low Risk: Current_DD < 30% × Max_DD
- Medium Risk: 30% × Max_DD ≤ Current_DD < 70% × Max_DD
- High Risk: Current_DD ≥ 70% × Max_DD
This classification system enables conditional signal generation, with long signals filtered during high-risk periods—a approach consistent with institutional risk management practices (Ang, 2014).
## 5. Signal Generation and Interpretation
### 5.1 Entry Signal Logic
RAMO generates enhanced entry signals through multiple confirmation layers:
1. Primary Signal: Crossover between indicator and signal line
2. Risk Filter: Confirmation of favorable risk environment for long positions
3. Leading Component: Early warning signals via acceleration analysis
4. Exhaustion Filter: Volume-based reversal detection
This multi-layered approach addresses the false signal problem common in traditional technical indicators (Brock, Lakonishok & LeBaron, 1992).
### 5.2 Divergence Analysis
RAMO incorporates both traditional and leading divergence detection:
- Traditional Divergence: Price and indicator divergence over 3-5 periods
- Slope Divergence: Momentum slope versus price direction
- Acceleration Divergence: Changes in momentum acceleration
This comprehensive divergence analysis framework draws from Elliott Wave theory (Prechter & Frost, 1978) and momentum divergence literature (Murphy, 1999).
## 6. Empirical Advantages and Applications
### 6.1 Risk-Adjusted Performance
The risk adjustment mechanism addresses the fundamental criticism of momentum strategies: their tendency to experience severe drawdowns during market reversals (Daniel & Moskowitz, 2016). By automatically reducing position sizing during high-drawdown periods, RAMO implements a form of dynamic hedging consistent with portfolio insurance concepts (Leland, 1980).
### 6.2 Regime Awareness
RAMO's adaptive components enable regime-aware signal generation, addressing the regime-switching behavior documented in financial markets (Hamilton, 1989; Guidolin, 2011). The indicator automatically adjusts its parameters based on market volatility and risk conditions, providing more reliable signals across different market environments.
### 6.3 Institutional Applications
The sophisticated risk management overlay makes RAMO particularly suitable for institutional applications where drawdown control is paramount. The indicator's design philosophy aligns with the risk budgeting approaches used by hedge funds and institutional investors (Roncalli, 2013).
## 7. Limitations and Future Research
### 7.1 Parameter Sensitivity
Like all technical indicators, RAMO's performance depends on parameter selection. While default parameters are optimized for broad market applications, asset-specific calibration may enhance performance. Future research should examine optimal parameter selection across different asset classes and market conditions.
### 7.2 Market Microstructure Considerations
RAMO's effectiveness may vary across different market microstructure environments. High-frequency trading and algorithmic market making have fundamentally altered market dynamics (Aldridge, 2013), potentially affecting momentum indicator performance.
### 7.3 Transaction Cost Integration
Future enhancements could incorporate transaction cost analysis to provide net-return-based signals, addressing the implementation shortfall documented in practical momentum strategy applications (Korajczyk & Sadka, 2004).
## References
Aldridge, I. (2013). *High-Frequency Trading: A Practical Guide to Algorithmic Strategies and Trading Systems*. 2nd ed. Hoboken, NJ: John Wiley & Sons.
Ang, A. (2014). *Asset Management: A Systematic Approach to Factor Investing*. New York: Oxford University Press.
Arms, R. W. (1989). *The Arms Index (TRIN): An Introduction to the Volume Analysis of Stock and Bond Markets*. Homewood, IL: Dow Jones-Irwin.
Asness, C. S., Moskowitz, T. J., & Pedersen, L. H. (2013). Value and momentum everywhere. *Journal of Finance*, 68(3), 929-985.
Barroso, P., & Santa-Clara, P. (2015). Momentum has its moments. *Journal of Financial Economics*, 116(1), 111-120.
Bollinger, J. (1992). *Bollinger on Bollinger Bands*. New York: McGraw-Hill.
Brock, W., Lakonishok, J., & LeBaron, B. (1992). Simple technical trading rules and the stochastic properties of stock returns. *Journal of Finance*, 47(5), 1731-1764.
Calmar, T. (1991). The Calmar ratio: A smoother tool. *Futures*, 20(1), 40.
Campbell, J. Y., Lo, A. W., & MacKinlay, A. C. (1997). *The Econometrics of Financial Markets*. Princeton, NJ: Princeton University Press.
Chekhlov, A., Uryasev, S., & Zabarankin, M. (2005). Drawdown measure in portfolio optimization. *International Journal of Theoretical and Applied Finance*, 8(1), 13-58.
Daniel, K., & Moskowitz, T. J. (2016). Momentum crashes. *Journal of Financial Economics*, 122(2), 221-247.
Fama, E. F., & French, K. R. (1996). Multifactor explanations of asset pricing anomalies. *Journal of Finance*, 51(1), 55-84.
Granville, J. E. (1963). *Granville's New Key to Stock Market Profits*. Englewood Cliffs, NJ: Prentice-Hall.
Guidolin, M. (2011). Markov switching models in empirical finance. In D. N. Drukker (Ed.), *Missing Data Methods: Time-Series Methods and Applications* (pp. 1-86). Bingley: Emerald Group Publishing.
Hamilton, J. D. (1989). A new approach to the economic analysis of nonstationary time series and the business cycle. *Econometrica*, 57(2), 357-384.
Jegadeesh, N., & Titman, S. (1993). Returns to buying winners and selling losers: Implications for stock market efficiency. *Journal of Finance*, 48(1), 65-91.
Kahneman, D., & Tversky, A. (1979). Prospect theory: An analysis of decision under risk. *Econometrica*, 47(2), 263-291.
Kaufman, P. J. (1995). *Smarter Trading: Improving Performance in Changing Markets*. New York: McGraw-Hill.
Korajczyk, R. A., & Sadka, R. (2004). Are momentum profits robust to trading costs? *Journal of Finance*, 59(3), 1039-1082.
Leland, H. E. (1980). Who should buy portfolio insurance? *Journal of Finance*, 35(2), 581-594.
Lo, A. W., Mamaysky, H., & Wang, J. (2000). Foundations of technical analysis: Computational algorithms, statistical inference, and empirical implementation. *Journal of Finance*, 55(4), 1705-1765.
Markowitz, H. (1952). Portfolio selection. *Journal of Finance*, 7(1), 77-91.
Murphy, J. J. (1999). *Technical Analysis of the Financial Markets: A Comprehensive Guide to Trading Methods and Applications*. New York: New York Institute of Finance.
Prechter, R. R., & Frost, A. J. (1978). *Elliott Wave Principle: Key to Market Behavior*. Gainesville, GA: New Classics Library.
Pring, M. J. (2002). *Technical Analysis Explained: The Successful Investor's Guide to Spotting Investment Trends and Turning Points*. 4th ed. New York: McGraw-Hill.
Roncalli, T. (2013). *Introduction to Risk Parity and Budgeting*. Boca Raton, FL: CRC Press.
Shefrin, H., & Statman, M. (1985). The disposition to sell winners too early and ride losers too long: Theory and evidence. *Journal of Finance*, 40(3), 777-790.
Taleb, N. N. (2007). *The Black Swan: The Impact of the Highly Improbable*. New York: Random House.
Taylor, M. P., & Allen, H. (1992). The use of technical analysis in the foreign exchange market. *Journal of International Money and Finance*, 11(3), 304-314.
Treadway, A. B. (1969). On rational entrepreneurial behavior and the demand for investment. *Review of Economic Studies*, 36(2), 227-239.
Wilder, J. W. (1978). *New Concepts in Technical Trading Systems*. Greensboro, NC: Trend Research.

Momentum Squeeze Scalper [M2S} [ITZS]Overview
The Momentum Squeeze Scalper is a technical analysis tool designed to identify potential breakout opportunities in the market. It combines elements of momentum analysis with a "squeeze" concept based on Bollinger Bands and Keltner Channels.
Key Components
1. Squeeze Detection
The indicator uses two types of squeezes:
a) Loose TTM Fire (Loose Squeeze): Represented by orange dots. This occurs when one side of the Bollinger Bands is inside the Keltner Channel.
b) Strict TTM Fire (Strict/Tight Squeeze): Represented by green dots. This happens when both sides of the Bollinger Bands are inside the Keltner Channel.
These squeezes can indicate potential breakouts in either direction (long or short).
Long Squeeze: Occurs when prices are compressed at a low level, potentially leading to an upward breakout.
Short Squeeze: Happens when prices are compressed at a high level, possibly leading to a downward breakout.
2. Momentum Line
The Momentum Line is a key feature of this indicator. Its color changes based on specific conditions:
Color 0 (White): Default color, indicating neutral momentum.
Color 1 (Green): Indicates positive momentum. This color appears when:
1. The histogram is positive and increasing, or
2. The momentum is increasing during a squeeze (loose or strict), or
3. There's a strict squeeze in place.
Color 2 (Red): Indicates negative momentum. This color appears when:
1. The histogram is negative and decreasing, or
2. The momentum is decreasing during a squeeze (loose or strict), or
3. There's a strict squeeze in place.
The changing colors of the Momentum Line help traders quickly identify shifts in market momentum and potential trading opportunities.
3. Signal Line
The orange line is the signal line, which is a smoothed version of the momentum line. It can help confirm trend changes when it crosses the momentum line.
Inputs and Their Effects
1. Momentum Period (default: 17):
Purpose: Determines the lookback period for momentum calculation.
Effect: A longer period makes the indicator less sensitive to short-term price changes, resulting in smoother momentum lines but potentially slower signals. A shorter period will make the indicator more responsive to recent price action but may increase noise.
2. Signal Period (default: 8):
Purpose: Sets the smoothing period for the signal line.
Effect: A shorter period makes it more responsive to recent price action, potentially providing earlier signals but with a higher chance of false alerts. A longer period creates a smoother signal line, reducing false signals but potentially delaying entry/exit points.
3. Smooth Momentum (default: false):
Purpose: Determines whether to use EMA smoothing on the source price before momentum calculation.
Effect: When true, it can reduce noise in the momentum calculation, potentially providing clearer signals in choppy markets. When false, it responds more quickly to price changes.
Smoothing Period (default: 1):
Purpose: Sets the period for EMA smoothing when Smooth Momentum is true.
Effect: A higher value creates a smoother momentum line, potentially reducing false signals but also increasing lag.
BB Length (default: 7):
Purpose: Defines the period for Bollinger Bands calculation.
Effect: A shorter length makes the bands more sensitive to price changes, potentially identifying squeezes more quickly but also increasing the chance of false signals. A longer length creates more stable bands but may delay squeeze identification.
StDev (default: 1.0):
Purpose: Standard deviation multiplier for Bollinger Bands.
Effect: Higher values create wider bands, making squeezes less frequent but potentially more significant. Lower values create tighter bands, increasing the frequency of squeezes but potentially reducing their reliability.
Keltner Length (default: 1):
Purpose: Sets the period for Keltner Channel calculation.
Effect: A longer length creates a wider, more stable channel, reducing the frequency of squeezes but potentially making them more reliable. A shorter length creates a tighter channel, increasing squeeze frequency but potentially reducing significance.
Multiplier (default: 0.5):
Purpose: Multiplier for Keltner Channel width.
Effect: Higher values create a wider channel, making squeezes less frequent but potentially more significant. Lower values create a tighter channel, increasing squeeze frequency but potentially reducing their reliability.
KC Smoothing Period (default: 10):
Purpose: Determines the smoothing period for the momentum histogram.
Effect: A longer period creates a smoother histogram, potentially reducing false signals but increasing lag. A shorter period makes the histogram more responsive but potentially noisier.
Smoothing Type (default: None):
Purpose: Allows selection of different smoothing algorithms for the momentum histogram.
Effect: Different smoothing types (e.g., ALMA, DEMA, EMA) can affect how quickly the histogram responds to price changes and how smooth the resulting line is. This can impact the timing and frequency of momentum color changes.
How to Use the Indicator
Look for squeeze dots (orange or green) to identify periods of low volatility.
Pay attention to the color of the Momentum Line:
1. Green suggests potential bullish momentum
2. Red suggests potential bearish momentum
Use the histogram for additional confirmation of momentum strength and direction.
Consider entering trades when the squeeze dots disappear and the Momentum Line shows a strong color signal (green for long, red for short).
How to Adjust the Indicator
1. For More Frequent Signals: Decrease the Momentum Period, Signal Period, BB Length, and Keltner Length. Increase the StDev and decrease the Multiplier. This will make the indicator more sensitive but may increase false signals.
2. For Fewer, More Reliable Signals: Increase the Momentum Period, Signal Period, BB Length, and
Keltner Length. Decrease the StDev and increase the Multiplier. This will reduce sensitivity but may miss some opportunities.
3. To Detect Stronger Squeezes: Increase the StDev for Bollinger Bands and decrease the Multiplier for Keltner Channels. This will make it harder for squeezes to occur, potentially identifying stronger setups.
4. To Reduce Noise: Enable Smooth Momentum and increase the Smoothing Period. Choose a smoothing type like EMA or DEMA for the histogram. This can help in choppy or ranging markets.
5. For Faster Response: Decrease the Momentum Period and Signal Period, and choose a responsive smoothing type like EMA for the histogram. This can be useful in fast-moving markets but may increase false signals.
Interpretation and Trading
1. Squeeze Formation: When you see orange (loose) or green (strict) dots, it indicates a potential buildup of energy in the market. This compression often precedes a significant move.
2. Momentum Direction: Watch the Momentum Line color changes:
Transition to Green: Suggests increasing bullish momentum, especially during a squeeze.
Transition to Red: Suggests increasing bearish momentum, especially during a squeeze.
White: Indicates neutral momentum or no clear direction.
3. Confirmation: Look for the Momentum Line (colored) to cross above the Signal Line (orange) for bullish confirmation, or below for bearish confirmation.
4. Exit Signals: When the squeeze dots disappear and the Momentum Line color changes, it often indicates that the compressed energy has been released, and the strong move may be ending.
5. Trend Strength: The distance between the Momentum Line and the Signal Line can indicate trend strength. A wider gap suggests a stronger trend.
Remember, no indicator is perfect. Always use this tool in conjunction with other forms of analysis and proper risk management. It's recommended to backtest and practice with this indicator on historical data before using it in live trading. Adjust the inputs based on your trading style, timeframe, and the specific characteristics of the asset you're trading.
WaveTrend Momentum (Zeiierman)█ Overview
WaveTrend Momentum (Zeiierman) reveals the underlying rhythm of market movement through positive and negative momentum waves that visualize both sides of trend behavior. This dual-wave structure makes it easy to see how impulses and retracements interact in real time, helping you distinguish between a normal pullback within strength and the early signs of a trend losing momentum.
The indicator layers its waves with higher-timeframe trend alignment and adaptive context filters, mapping when momentum expands, when it fades, and where a pullback is approaching exhaustion or renewed trend strength is likely to emerge.
⚪ Why This One Is Unique
Unlike conventional wave oscillators, this design uses dual, phase-managed wave construction with adaptive scaling across symbols and timeframes. At its core is a three-mode Trend Strength engine (Adaptive, Stability, Structure) that dynamically adjusts to market conditions, supported by higher-timeframe regime sourcing and a dedicated impulse-and-divergence framework.
█ Main features
⚪ WaveTrend Momentum Waves
The foundation of the indicator lies in its ability to build positive and negative momentum waves that visualize both sides of market movement. This dual-wave structure makes it easy to identify trend direction, impulses, retracements, and exhaustion in real time, showing how momentum evolves within broader market phases. The waves can be used directly to gauge trend strength and direction, helping traders stay aligned with prevailing momentum or recognize when a shift is forming.
⚪ Extreme Moves
Extreme Zones highlight points where momentum reaches statistically stretched conditions, areas where price action often pauses, rebalances, or reverses. These zones help traders anticipate potential exhaustion before it becomes visible on price, improving timing for entries, exits, and scaling decisions.
⚪ Impulse Moves
Impulse Markers identify bursts of directional momentum, moments when trend energy expands sharply. These points often align with breakouts, accelerations, or continuation signals, helping traders focus on active opportunities rather than noise or consolidation.
⚪ Trend Strength
The Trend Strength Line adapts dynamically to shifting market regimes. It can operate in three modes: Adaptive, Stability, and Structure, each offering a different sensitivity level to trend changes. This feature helps confirm whether the trend is building, stabilizing, or losing strength, and serves as a foundation for bias filtering or trade direction confirmation.
⚪ Higher-Timeframe Trend Alignment
Integrates a higher-timeframe trend reference directly into the analysis, giving each wave context. This alignment clarifies when local pullbacks occur in harmony or conflict with the broader trend, making it easier to distinguish temporary corrections from true reversals.
⚪ Divergence Engine
A fully integrated divergence detection system that automatically spots both regular and hidden divergences between price and momentum. By surfacing early signs of trend weakening or continuation potential, it gives traders a structured way to detect subtle momentum shifts before they manifest in price.
█ How to Use
⚪ Trend Trading
WaveTrend Momentum excels as a trend-following framework by combining wave direction, Trend Strength, and higher-timeframe alignment to reveal when momentum is expanding or contracting within the broader market phase.
Note: To get trend waves, consider increasing the Wave Transition value to above 40.
Bullish WaveTrend Trend: When the positive momentum waves are above the neutral midpoint, the market is trending upward. Minor downward retracements within this structure often resolve back into trend continuation once buying pressure reasserts itself, particularly when the higher-timeframe context confirms a bullish regime.
Bearish WaveTrend Trend: When the negative wave dominates and remains below the midpoint, downside momentum controls the market. Minor upward retracements within this structure often resolve back into trend continuation once selling pressure reasserts itself, particularly when the higher-timeframe context confirms a bearish regime.
Bullish Trend Strength Line: A Trend Strength Line positioned above the midline indicates a bullish trend. A rising line reflects growing momentum and persistent buying pressure. The steeper the slope, the stronger the current regime. As long as the line continues to rise alongside positive waves, the trend remains structurally intact.
Bearish Trend Strength Line: A Trend Strength Line positioned below the midline indicates a bearish trend. A declining line reflects increasing selling pressure and persistent downside momentum. The steeper the slope, the stronger the current bearish regime. As long as the line continues to fall alongside negative waves, the trend remains structurally intact.
⚪ Momentum Trading
Momentum trading focuses on capturing the energy and force behind price movement, identifying whether the market is accelerating, losing steam, or preparing for a reversal. Momentum shifts can reveal temporary exhaustion, trend-strength continuation, or breakout acceleration before price action fully confirms it.
The indicator includes several features designed to detect and visualize momentum:
Waves: The core element of the indicator. The size and slope of the waves reflect the strength of momentum. Expanding waves indicate strong directional pressure, while contracting waves suggest cooling or consolidation.
Extreme Zones: When waves reach or exceed the extreme levels, the market enters statistically stretched conditions, signaling potential exhaustion or reversal zones. However, these events can also occur during strong trends, indicating continued strength in that direction. Market context is essential to determine whether an extreme should be interpreted as a reversal signal or as confirmation of trend momentum.
Impulse Markers: Highlight sudden bursts of momentum, often associated with breakouts or continuation events. Like Extreme Zones, Impulse Markers can appear within both reversals and strong trending phases. Context from price structure and higher timeframes helps identify whether the impulse reflects a trend-strength expansion or the final surge before exhaustion.
You can use any of these features to identify:
Breakouts: When Impulse or Extreme Markers align with expanding waves.
Reversals: When momentum reaches extreme levels followed by a fade in strength, it signals potential exhaustion before a structural shift. However, strong trends can also produce temporary fades that quickly recover, so context is key to distinguishing between true reversals and brief pauses within the trend.
⚪ Pullback Trading
Pullbacks represent short pauses or retracements within a prevailing trend. The combination of the Wave, Impulse Markers, and the Trend Strength Line helps identify when a pullback is maturing and when continuation is likely to resume.
Bullish WaveTrend and Trend Strength Pullback
In an uptrend, a brief dip in the negative wave, paired with a bullish Trend Strength, typically signals a healthy pullback rather than a reversal. When the negative wave begins to turn upward again, it confirms momentum recovery and potential for continuation.
Bearish WaveTrend and Trend Strength Pullback
In a downtrend, a short-lived rise in the positive wave while Trend Strength remains negative usually signals a counter-trend rally within weakness. As the positive wave fades and the negative wave expands again, downside continuation becomes more probable.
⚪ Divergence Trading
Divergence trading focuses on identifying moments when price and momentum move out of sync, signaling a potential shift in market direction or a slowdown in trend strength. These divergences often appear before reversals, consolidations, or major transitions in structure, making them a valuable early warning tool for traders.
The integrated Divergence Engine automatically detects these imbalances between price action and momentum. When price continues to move in one direction but momentum begins to fade, it suggests that the underlying strength driving the move is weakening.
█ How It Works
⚪ Wave Construction
The momentum wave is derived from phase-managed price smoothers, then normalized and bounded to express both positive and negative momentum within a single coherent structure.
Calculation: Composite moving frameworks with phase management, nonlinear rescaling, and amplitude companding to stabilize wave height and maintain consistent sensitivity.
⚪ Extremes
An auxiliary equilibrium tracker measures deviations from a dynamic mean to identify statistically stretched conditions in which momentum may begin to rebalance.
Calculation: Robust deviation mapping of a smoothed equilibrium series with adaptive thresholds for regime-consistent extremes.
⚪ Trend Strength Core
A tri-mode core measures directional persistence and adapts dynamically to changing market regimes, with optional higher-timeframe sourcing for context.
Calculation: Return-aggregated momentum with envelope gating (Adaptive), stability-biased curvature tracking (Stability), and structure-driven range midpoint logic (Structure).
⚪ Range & Regime Filter
A volatility-adjusted filter produces a smoothed state line and internal bias zones, allowing the indicator to contextualize momentum behavior within current volatility conditions.
Calculation: Volatility-normalized range synthesis with slow/fast quantization modes and optional smoothing to mitigate market chop.
⚪ Impulse Detection
Detects short-term bursts of directional energy and marks them as impulse events. These impulses highlight when momentum rapidly expands, often signaling breakouts, accelerations, or the end of low-volatility phases.
Calculation: Nonlinear impulse-response mapping that emphasizes higher-order rate changes while filtering out micro-noise.
⚪ Divergence Engine (Regular & Hidden)
Compares price swings against the wave’s momentum structure to identify early disagreement between price and internal strength.
Calculation: Swing-logic comparators analyze price relative to normalized wave amplitude to detect momentum shifts and potential divergence setups.
-----------------
Disclaimer
The content provided in my scripts, indicators, ideas, algorithms, and systems is for educational and informational purposes only. It does not constitute financial advice, investment recommendations, or a solicitation to buy or sell any financial instruments. I will not accept liability for any loss or damage, including without limitation any loss of profit, which may arise directly or indirectly from the use of or reliance on such information.
All investments involve risk, and the past performance of a security, industry, sector, market, financial product, trading strategy, backtest, or individual's trading does not guarantee future results or returns. Investors are fully responsible for any investment decisions they make. Such decisions should be based solely on an evaluation of their financial circumstances, investment objectives, risk tolerance, and liquidity needs.
Script a pagamento

Momentum Trend [MT]The Momentum Trend indicator is an innovative technical analysis tool designed to capture and visualize momentum trends in financial markets. This advanced indicator goes beyond traditional momentum measures, offering a unique perspective on price action and trend strength.
Core Functionality:
Trend Momentum Index (TMI) Calculation:
At the heart of this indicator is the Trend Momentum Index (TMI), a proprietary algorithm that combines moving averages with price action analysis to gauge momentum. The TMI is calculated using a user-defined source, length, and moving average type.
Dynamic Trend Visualization:
The indicator uses a color-coded column plot to represent the TMI values, providing an intuitive visual representation of trend strength and direction. The colors change based on specific conditions, offering instant insights into the current market state.
Adaptive Momentum Analysis:
The TMI adapts to changing market conditions by comparing current values to historical ones, allowing for a more nuanced understanding of momentum shifts.
Key Inputs and Their Significance:
TMI Source:
Allows users to select the price data for TMI calculations. The default is the closing price, but users can choose alternative sources for different analytical perspectives.
TMI Length:
Defines the lookback period for the TMI calculation. The default of 8 provides a balance between responsiveness and stability, but users can adjust this to suit their trading style.
Moving Average Type:
Users can select from various moving average types (SMA, EMA, SMMA, WMA, VWMA) for the base calculation, allowing for customization based on trading preferences.
What Makes It Unique:
Comprehensive Momentum Analysis:
The TMI combines elements of trend following and momentum, providing a more holistic view of market dynamics than traditional momentum indicators.
Multi-Faceted Trend Identification:
The color-coding system doesn't just show bullish or bearish trends, but also identifies accelerating and decelerating momentum in both directions.
Flexible Moving Average Integration:
The ability to choose different moving average types allows traders to fine-tune the indicator's responsiveness and smoothness.
Visual Clarity:
The column-style plot with color changes offers clear, at-a-glance insights into trend strength and direction.
Momentum Comparison Logic:
The indicator incorporates logic to compare current momentum changes with recent historical changes, providing context for the current market state.
The Momentum Trend indicator represents a sophisticated approach to momentum and trend analysis. By combining moving averages, price action, and comparative momentum logic, it offers traders a powerful tool for identifying potential trend continuations, reversals, and momentum shifts.
This indicator is particularly valuable for traders looking to:
- Identify the start of new trends
- Spot potential trend reversals
- Gauge the strength of ongoing trends
- Time entries and exits based on momentum shifts

Momentum ChannelbandsThe "Momentum Channelbands" is indicator that measures and displays an asset's momentum. It includes options to calculate Bollinger Bands and Donchian Channels around the momentum. Users can customize settings for a comprehensive view of momentum-related insights. This tool helps assess trend strength, identify overbought/oversold conditions, and pinpoint highs/lows. It should be used alongside other indicators due to potential lag and false signals.

GKD-C Polychromatic Momentum [Loxx]Giga Kaleidoscope GKD-C Polychromatic Momentum is a Confirmation module included in Loxx's "Giga Kaleidoscope Modularized Trading System".
█ GKD-C Polychromatic Momentum
Polychromatic Momentum: A Refined Approach to Momentum Calculation in Technical Analysis
In the world of finance and trading, technical analysis plays a crucial role in understanding price movements and making informed decisions. One popular method in technical analysis is calculating momentum, which indicates the strength of a trend by analyzing the rate of change in prices. The following explains a specific implementation of momentum calculation known as Polychromatic Momentum, highlighting its features and potential advantages over traditional momentum calculations.
Polychromatic Momentum Calculation
Polychromatic Momentum enhances the traditional momentum calculation by employing a weighted approach to momentum values. This method begins by initializing two variables to store the cumulative momentum values and their respective weights throughout the calculation process.
The calculation iterates through the range of the price data. For each iteration, a weight is calculated as the square root of the index plus one. The weight serves as a scaling factor, emphasizing more recent price changes over older ones. This allows the Polychromatic Momentum to account for the significance of recent trends in the market.
Next, the momentum value for the current index is calculated by finding the difference between the current source price and the source price at the previous index. This difference is then divided by the calculated weight. The momentum value is added to the cumulative sum, and the weight is added to the sum of weights.
Once the iteration is complete, the Polychromatic Momentum is obtained by dividing the cumulative sum of momentum values by the sum of weights. This calculation method provides a more nuanced understanding of the momentum by taking into account the varying importance of price changes over time.
Polychromatic Momentum offers a different approach to momentum calculation compared to regular momentum. While both methods aim to measure the strength of a trend by analyzing the rate of change in prices, their calculations differ in certain aspects, which may result in advantages for Polychromatic Momentum.
Regular momentum is calculated by subtracting the price value at a specific period in the past from the current price value. This method provides a simple and straightforward way to determine the price change over a fixed period.
Polychromatic Momentum, on the other hand, employs a weighted approach to momentum values. It calculates the momentum by considering a range of price changes over time and assigning weights to each change based on their recency. This approach aims to capture the varying importance of price changes over time, which can be beneficial in certain market conditions.
Some potential advantages of Polychromatic Momentum over regular momentum include:
1. Responsiveness: Polychromatic Momentum places greater emphasis on recent price changes, making it more responsive to new trends in the market. This responsiveness could provide timely signals for traders to capitalize on emerging trends.
2. Enhanced Trend Analysis: By considering a range of price changes over time and assigning weights to each change, Polychromatic Momentum can provide a more comprehensive analysis of the market trends. This can help traders better understand the overall momentum and make more informed decisions.
3. Flexibility: Polychromatic Momentum's weighted approach allows for greater flexibility in adapting to different market conditions and timeframes. Traders can experiment with different weighting schemes to optimize the momentum calculation for their specific trading strategies and goals.
In conclusion, Polychromatic Momentum offers a more refined approach to momentum calculation in technical analysis compared to traditional methods. By using a weighted approach, it effectively takes into account the varying importance of price changes over time, providing traders with a more insightful and responsive measure of market trends.
What is Double Smoothed Exponential Moving Average?
In financial markets and trading, technical analysis serves as a critical tool for evaluating price trends and making strategic decisions. A key component of technical analysis is the moving average, which averages price data over a specified period to smooth out fluctuations and identify market trends. While the Exponential Moving Average (EMA) is a popular moving average variant that emphasizes recent data points, the Double Smoothed Exponential Moving Average (DSEMA) takes it a step further by incorporating two layers of EMA calculations for more advanced smoothing. The following delve into the DSEMA methodology, explaining its working mechanism and the logic behind the technique without referring to specific code variables.
Double Smoothed Exponential Moving Average Explanation
DSEMA is a function that processes source price data and the length of the smoothing period as its inputs. Its primary objective is to minimize noise in the price data and generate a smoother output, which can be advantageous for detecting trends and making informed trading decisions.
The DSEMA calculation begins by determining the alpha value, which is the smoothing factor for the EMA. The alpha value is derived from the square root of the length of the smoothing period, ensuring that it falls between 0 and 1. A higher alpha value leads to a more responsive EMA, while a lower alpha value results in a slower-moving EMA that is less affected by recent price fluctuations.
The core of the DSEMA calculation involves applying two layers of EMA. The first layer calculates the initial EMA using the source price data and the alpha value. This first EMA places more weight on recent price data points, similar to a regular EMA.
The second layer calculates another EMA using the initial EMA values and the same alpha value. This second layer of EMA provides additional smoothing to the price data, resulting in a smoother output curve that is less prone to noise and sudden market changes. The final output of the DSEMA is the result of the second EMA layer.
In summary, the Double Smoothed Exponential Moving Average (DSEMA) offers an advanced approach to price data smoothing in technical analysis by applying two successive layers of EMA calculations. This technique enhances the detection of market trends and helps reduce the impact of noise in price data, providing traders with a more reliable representation of price movements to support their decision-making process.
Combining DSEMA and Polychromatic Momentum
DSEMA is an advanced smoothing technique that applies two layers of Exponential Moving Average (EMA) calculations to reduce noise in price data and produce a smoother representation of the market trends. On the other hand, Polychromatic Momentum is a momentum calculation method that employs a weighted approach to assess the strength of trends by analyzing the rate of change in prices over time.
By combining the two techniques, DSEMA can be used to smooth the source price data before inputting it into the Polychromatic Momentum calculation. This combination allows for a more accurate representation of price movements, as the smoothed price data provided by DSEMA minimizes the impact of sudden market fluctuations and noise on the momentum calculation.
The result is an enhanced technical analysis tool that leverages the benefits of advanced price smoothing from DSEMA and the refined trend assessment of Polychromatic Momentum. This integrated approach can help traders gain a deeper understanding of market dynamics and make more informed decisions based on reliable, noise-reduced price data and nuanced momentum calculations.
For our purposes here, only the source price can be smoothed and it's turned off by default. The smoothing period is zero by default. Any period above 0 and the smoothing will kick in. Try a period of 5.
Additional Features
This indicator allows you to select from 33 source types. They are as follows:
Close
Open
High
Low
Median
Typical
Weighted
Average
Average Median Body
Trend Biased
Trend Biased (Extreme)
HA Close
HA Open
HA High
HA Low
HA Median
HA Typical
HA Weighted
HA Average
HA Average Median Body
HA Trend Biased
HA Trend Biased (Extreme)
HAB Close
HAB Open
HAB High
HAB Low
HAB Median
HAB Typical
HAB Weighted
HAB Average
HAB Average Median Body
HAB Trend Biased
HAB Trend Biased (Extreme)
What are Heiken Ashi "better" candles?
Heiken Ashi "better" candles are a modified version of the standard Heiken Ashi candles, which are a popular charting technique used in technical analysis. Heiken Ashi candles help traders identify trends and potential reversal points by smoothing out price data and reducing market noise. The "better formula" was proposed by Sebastian Schmidt in an article published by BNP Paribas in Warrants & Zertifikate, a German magazine, in August 2004. The aim of this formula is to further improve the smoothing of the Heiken Ashi chart and enhance its effectiveness in identifying trends and reversals.
Standard Heiken Ashi candles are calculated using the following formulas:
Heiken Ashi Close = (Open + High + Low + Close) / 4
Heiken Ashi Open = (Previous Heiken Ashi Open + Previous Heiken Ashi Close) / 2
Heiken Ashi High = Max (High, Heiken Ashi Open, Heiken Ashi Close)
Heiken Ashi Low = Min (Low, Heiken Ashi Open, Heiken Ashi Close)
The "better formula" modifies the standard Heiken Ashi calculation by incorporating additional smoothing, which can help reduce noise and make it easier to identify trends and reversals. The modified formulas for Heiken Ashi "better" candles are as follows:
Better Heiken Ashi Close = (Open + High + Low + Close) / 4
Better Heiken Ashi Open = (Previous Better Heiken Ashi Open + Previous Better Heiken Ashi Close) / 2
Better Heiken Ashi High = Max (High, Better Heiken Ashi Open, Better Heiken Ashi Close)
Better Heiken Ashi Low = Min (Low, Better Heiken Ashi Open, Better Heiken Ashi Close)
Smoothing Factor = 2 / (N + 1), where N is the chosen period for smoothing
Smoothed Better Heiken Ashi Open = (Better Heiken Ashi Open * Smoothing Factor) + (Previous Smoothed Better Heiken Ashi Open * (1 - Smoothing Factor))
Smoothed Better Heiken Ashi Close = (Better Heiken Ashi Close * Smoothing Factor) + (Previous Smoothed Better Heiken Ashi Close * (1 - Smoothing Factor))
The smoothed Better Heiken Ashi Open and Close values are then used to calculate the smoothed Better Heiken Ashi High and Low values, resulting in "better" candles that provide a clearer representation of the market trend and potential reversal points.
It's important to note that, like any other technical analysis tool, Heiken Ashi "better" candles are not foolproof and should be used in conjunction with other indicators and analysis techniques to make well-informed trading decisions.
Heiken Ashi "better" candles, as mentioned previously, provide a clearer representation of market trends and potential reversal points by reducing noise and smoothing out price data. When using these candles in conjunction with other technical analysis tools and indicators, traders can gain valuable insights into market behavior and make more informed decisions.
To effectively use Heiken Ashi "better" candles in your trading strategy, consider the following tips:
Trend Identification: Heiken Ashi "better" candles can help you identify the prevailing trend in the market. When the majority of the candles are green (or another color, depending on your chart settings) and there are no or few lower wicks, it may indicate a strong uptrend. Conversely, when the majority of the candles are red (or another color) and there are no or few upper wicks, it may signal a strong downtrend.
Trend Reversals: Look for potential trend reversals when a change in the color of the candles occurs, especially when accompanied by longer wicks. For example, if a green candle with a long lower wick is followed by a red candle, it could indicate a bearish reversal. Similarly, a red candle with a long upper wick followed by a green candle may suggest a bullish reversal.
Support and Resistance: You can use Heiken Ashi "better" candles to identify potential support and resistance levels. When the candles are consistently moving in one direction and then suddenly change color with longer wicks, it could indicate the presence of a support or resistance level.
Stop-Loss and Take-Profit: Using Heiken Ashi "better" candles can help you manage risk by determining optimal stop-loss and take-profit levels. For instance, you can place your stop-loss below the low of the most recent green candle in an uptrend or above the high of the most recent red candle in a downtrend.
Confirming Signals: Heiken Ashi "better" candles should be used in conjunction with other technical indicators, such as moving averages, oscillators, or chart patterns, to confirm signals and improve the accuracy of your analysis.
In this implementation, you have the choice of AMA, KAMA, or T3 smoothing. These are as follows:
Kaufman Adaptive Moving Average (KAMA)
The Kaufman Adaptive Moving Average (KAMA) is a type of adaptive moving average used in technical analysis to smooth out price fluctuations and identify trends. The KAMA adjusts its smoothing factor based on the market's volatility, making it more responsive in volatile markets and smoother in calm markets. The KAMA is calculated using three different efficiency ratios that determine the appropriate smoothing factor for the current market conditions. These ratios are based on the noise level of the market, the speed at which the market is moving, and the length of the moving average. The KAMA is a popular choice among traders who prefer to use adaptive indicators to identify trends and potential reversals.
Adaptive Moving Average
The Adaptive Moving Average (AMA) is a type of moving average that adjusts its sensitivity to price movements based on market conditions. It uses a ratio between the current price and the highest and lowest prices over a certain lookback period to determine its level of smoothing. The AMA can help reduce lag and increase responsiveness to changes in trend direction, making it useful for traders who want to follow trends while avoiding false signals. The AMA is calculated by multiplying a smoothing constant with the difference between the current price and the previous AMA value, then adding the result to the previous AMA value.
T3
The T3 moving average is a type of technical indicator used in financial analysis to identify trends in price movements. It is similar to the Exponential Moving Average (EMA) and the Double Exponential Moving Average (DEMA), but uses a different smoothing algorithm.
The T3 moving average is calculated using a series of exponential moving averages that are designed to filter out noise and smooth the data. The resulting smoothed data is then weighted with a non-linear function to produce a final output that is more responsive to changes in trend direction.
The T3 moving average can be customized by adjusting the length of the moving average, as well as the weighting function used to smooth the data. It is commonly used in conjunction with other technical indicators as part of a larger trading strategy.
█ Giga Kaleidoscope Modularized Trading System
Core components of an NNFX algorithmic trading strategy
The NNFX algorithm is built on the principles of trend, momentum, and volatility. There are six core components in the NNFX trading algorithm:
1. Volatility - price volatility; e.g., Average True Range, True Range Double, Close-to-Close, etc.
2. Baseline - a moving average to identify price trend
3. Confirmation 1 - a technical indicator used to identify trends
4. Confirmation 2 - a technical indicator used to identify trends
5. Continuation - a technical indicator used to identify trends
6. Volatility/Volume - a technical indicator used to identify volatility/volume breakouts/breakdown
7. Exit - a technical indicator used to determine when a trend is exhausted
What is Volatility in the NNFX trading system?
In the NNFX (No Nonsense Forex) trading system, ATR (Average True Range) is typically used to measure the volatility of an asset. It is used as a part of the system to help determine the appropriate stop loss and take profit levels for a trade. ATR is calculated by taking the average of the true range values over a specified period.
True range is calculated as the maximum of the following values:
-Current high minus the current low
-Absolute value of the current high minus the previous close
-Absolute value of the current low minus the previous close
ATR is a dynamic indicator that changes with changes in volatility. As volatility increases, the value of ATR increases, and as volatility decreases, the value of ATR decreases. By using ATR in NNFX system, traders can adjust their stop loss and take profit levels according to the volatility of the asset being traded. This helps to ensure that the trade is given enough room to move, while also minimizing potential losses.
Other types of volatility include True Range Double (TRD), Close-to-Close, and Garman-Klass
What is a Baseline indicator?
The baseline is essentially a moving average, and is used to determine the overall direction of the market.
The baseline in the NNFX system is used to filter out trades that are not in line with the long-term trend of the market. The baseline is plotted on the chart along with other indicators, such as the Moving Average (MA), the Relative Strength Index (RSI), and the Average True Range (ATR).
Trades are only taken when the price is in the same direction as the baseline. For example, if the baseline is sloping upwards, only long trades are taken, and if the baseline is sloping downwards, only short trades are taken. This approach helps to ensure that trades are in line with the overall trend of the market, and reduces the risk of entering trades that are likely to fail.
By using a baseline in the NNFX system, traders can have a clear reference point for determining the overall trend of the market, and can make more informed trading decisions. The baseline helps to filter out noise and false signals, and ensures that trades are taken in the direction of the long-term trend.
What is a Confirmation indicator?
Confirmation indicators are technical indicators that are used to confirm the signals generated by primary indicators. Primary indicators are the core indicators used in the NNFX system, such as the Average True Range (ATR), the Moving Average (MA), and the Relative Strength Index (RSI).
The purpose of the confirmation indicators is to reduce false signals and improve the accuracy of the trading system. They are designed to confirm the signals generated by the primary indicators by providing additional information about the strength and direction of the trend.
Some examples of confirmation indicators that may be used in the NNFX system include the Bollinger Bands, the MACD (Moving Average Convergence Divergence), and the MACD Oscillator. These indicators can provide information about the volatility, momentum, and trend strength of the market, and can be used to confirm the signals generated by the primary indicators.
In the NNFX system, confirmation indicators are used in combination with primary indicators and other filters to create a trading system that is robust and reliable. By using multiple indicators to confirm trading signals, the system aims to reduce the risk of false signals and improve the overall profitability of the trades.
What is a Continuation indicator?
In the NNFX (No Nonsense Forex) trading system, a continuation indicator is a technical indicator that is used to confirm a current trend and predict that the trend is likely to continue in the same direction. A continuation indicator is typically used in conjunction with other indicators in the system, such as a baseline indicator, to provide a comprehensive trading strategy.
What is a Volatility/Volume indicator?
Volume indicators, such as the On Balance Volume (OBV), the Chaikin Money Flow (CMF), or the Volume Price Trend (VPT), are used to measure the amount of buying and selling activity in a market. They are based on the trading volume of the market, and can provide information about the strength of the trend. In the NNFX system, volume indicators are used to confirm trading signals generated by the Moving Average and the Relative Strength Index. Volatility indicators include Average Direction Index, Waddah Attar, and Volatility Ratio. In the NNFX trading system, volatility is a proxy for volume and vice versa.
By using volume indicators as confirmation tools, the NNFX trading system aims to reduce the risk of false signals and improve the overall profitability of trades. These indicators can provide additional information about the market that is not captured by the primary indicators, and can help traders to make more informed trading decisions. In addition, volume indicators can be used to identify potential changes in market trends and to confirm the strength of price movements.
What is an Exit indicator?
The exit indicator is used in conjunction with other indicators in the system, such as the Moving Average (MA), the Relative Strength Index (RSI), and the Average True Range (ATR), to provide a comprehensive trading strategy.
The exit indicator in the NNFX system can be any technical indicator that is deemed effective at identifying optimal exit points. Examples of exit indicators that are commonly used include the Parabolic SAR, the Average Directional Index (ADX), and the Chandelier Exit.
The purpose of the exit indicator is to identify when a trend is likely to reverse or when the market conditions have changed, signaling the need to exit a trade. By using an exit indicator, traders can manage their risk and prevent significant losses.
In the NNFX system, the exit indicator is used in conjunction with a stop loss and a take profit order to maximize profits and minimize losses. The stop loss order is used to limit the amount of loss that can be incurred if the trade goes against the trader, while the take profit order is used to lock in profits when the trade is moving in the trader's favor.
Overall, the use of an exit indicator in the NNFX trading system is an important component of a comprehensive trading strategy. It allows traders to manage their risk effectively and improve the profitability of their trades by exiting at the right time.
How does Loxx's GKD (Giga Kaleidoscope Modularized Trading System) implement the NNFX algorithm outlined above?
Loxx's GKD v1.0 system has five types of modules (indicators/strategies). These modules are:
1. GKD-BT - Backtesting module (Volatility, Number 1 in the NNFX algorithm)
2. GKD-B - Baseline module (Baseline and Volatility/Volume, Numbers 1 and 2 in the NNFX algorithm)
3. GKD-C - Confirmation 1/2 and Continuation module (Confirmation 1/2 and Continuation, Numbers 3, 4, and 5 in the NNFX algorithm)
4. GKD-V - Volatility/Volume module (Confirmation 1/2, Number 6 in the NNFX algorithm)
5. GKD-E - Exit module (Exit, Number 7 in the NNFX algorithm)
(additional module types will added in future releases)
Each module interacts with every module by passing data between modules. Data is passed between each module as described below:
GKD-B => GKD-V => GKD-C(1) => GKD-C(2) => GKD-C(Continuation) => GKD-E => GKD-BT
That is, the Baseline indicator passes its data to Volatility/Volume. The Volatility/Volume indicator passes its values to the Confirmation 1 indicator. The Confirmation 1 indicator passes its values to the Confirmation 2 indicator. The Confirmation 2 indicator passes its values to the Continuation indicator. The Continuation indicator passes its values to the Exit indicator, and finally, the Exit indicator passes its values to the Backtest strategy.
This chaining of indicators requires that each module conform to Loxx's GKD protocol, therefore allowing for the testing of every possible combination of technical indicators that make up the six components of the NNFX algorithm.
What does the application of the GKD trading system look like?
Example trading system:
Backtest: Strategy with 1-3 take profits, trailing stop loss, multiple types of PnL volatility, and 2 backtesting styles
Baseline: Hull Moving Average
Volatility/Volume: Hurst Exponent
Confirmation 1: Polychromatic Momentum as shown on the chart above
Confirmation 2: Williams Percent Range
Continuation: Polychromatic Momentum
Exit: Rex Oscillator
Each GKD indicator is denoted with a module identifier of either: GKD-BT, GKD-B, GKD-C, GKD-V, or GKD-E. This allows traders to understand to which module each indicator belongs and where each indicator fits into the GKD protocol chain.
Giga Kaleidoscope Modularized Trading System Signals (based on the NNFX algorithm)
Standard Entry
1. GKD-C Confirmation 1 Signal
2. GKD-B Baseline agrees
3. Price is within a range of 0.2x Volatility and 1.0x Volatility of the Goldie Locks Mean
4. GKD-C Confirmation 2 agrees
5. GKD-V Volatility/Volume agrees
Baseline Entry
1. GKD-B Baseline signal
2. GKD-C Confirmation 1 agrees
3. Price is within a range of 0.2x Volatility and 1.0x Volatility of the Goldie Locks Mean
4. GKD-C Confirmation 2 agrees
5. GKD-V Volatility/Volume agrees
6. GKD-C Confirmation 1 signal was less than 7 candles prior
Volatility/Volume Entry
1. GKD-V Volatility/Volume signal
2. GKD-C Confirmation 1 agrees
3. Price is within a range of 0.2x Volatility and 1.0x Volatility of the Goldie Locks Mean
4. GKD-C Confirmation 2 agrees
5. GKD-B Baseline agrees
6. GKD-C Confirmation 1 signal was less than 7 candles prior
Continuation Entry
1. Standard Entry, Baseline Entry, or Pullback; entry triggered previously
2. GKD-B Baseline hasn't crossed since entry signal trigger
3. GKD-C Confirmation Continuation Indicator signals
4. GKD-C Confirmation 1 agrees
5. GKD-B Baseline agrees
6. GKD-C Confirmation 2 agrees
1-Candle Rule Standard Entry
1. GKD-C Confirmation 1 signal
2. GKD-B Baseline agrees
3. Price is within a range of 0.2x Volatility and 1.0x Volatility of the Goldie Locks Mean
Next Candle:
1. Price retraced (Long: close < close or Short: close > close )
2. GKD-B Baseline agrees
3. GKD-C Confirmation 1 agrees
4. GKD-C Confirmation 2 agrees
5. GKD-V Volatility/Volume agrees
1-Candle Rule Baseline Entry
1. GKD-B Baseline signal
2. GKD-C Confirmation 1 agrees
3. Price is within a range of 0.2x Volatility and 1.0x Volatility of the Goldie Locks Mean
4. GKD-C Confirmation 1 signal was less than 7 candles prior
Next Candle:
1. Price retraced (Long: close < close or Short: close > close )
2. GKD-B Baseline agrees
3. GKD-C Confirmation 1 agrees
4. GKD-C Confirmation 2 agrees
5. GKD-V Volatility/Volume Agrees
1-Candle Rule Volatility/Volume Entry
1. GKD-V Volatility/Volume signal
2. GKD-C Confirmation 1 agrees
3. Price is within a range of 0.2x Volatility and 1.0x Volatility of the Goldie Locks Mean
4. GKD-C Confirmation 1 signal was less than 7 candles prior
Next Candle:
1. Price retraced (Long: close < close or Short: close > close)
2. GKD-B Volatility/Volume agrees
3. GKD-C Confirmation 1 agrees
4. GKD-C Confirmation 2 agrees
5. GKD-B Baseline agrees
PullBack Entry
1. GKD-B Baseline signal
2. GKD-C Confirmation 1 agrees
3. Price is beyond 1.0x Volatility of Baseline
Next Candle:
1. Price is within a range of 0.2x Volatility and 1.0x Volatility of the Goldie Locks Mean
2. GKD-C Confirmation 1 agrees
3. GKD-C Confirmation 2 agrees
4. GKD-V Volatility/Volume Agrees
]█ Setting up the GKD
The GKD system involves chaining indicators together. These are the steps to set this up.
Use a GKD-C indicator alone on a chart
1. Inside the GKD-C indicator, change the "Confirmation Type" setting to "Solo Confirmation Simple"
Use a GKD-V indicator alone on a chart
**nothing, it's already useable on the chart without any settings changes
Use a GKD-B indicator alone on a chart
**nothing, it's already useable on the chart without any settings changes
Baseline (Baseline, Backtest)
1. Import the GKD-B Baseline into the GKD-BT Backtest: "Input into Volatility/Volume or Backtest (Baseline testing)"
2. Inside the GKD-BT Backtest, change the setting "Backtest Special" to "Baseline"
Volatility/Volume (Volatility/Volume, Backte st)
1. Inside the GKD-V indicator, change the "Testing Type" setting to "Solo"
2. Inside the GKD-V indicator, change the "Signal Type" setting to "Crossing" (neither traditional nor both can be backtested)
3. Import the GKD-V indicator into the GKD-BT Backtest: "Input into C1 or Backtest"
4. Inside the GKD-BT Backtest, change the setting "Backtest Special" to "Volatility/Volume"
5. Inside the GKD-BT Backtest, a) change the setting "Backtest Type" to "Trading" if using a directional GKD-V indicator; or, b) change the setting "Backtest Type" to "Full" if using a directional or non-directional GKD-V indicator (non-directional GKD-V can only test Longs and Shorts separately)
6. If "Backtest Type" is set to "Full": Inside the GKD-BT Backtest, change the setting "Backtest Side" to "Long" or "Short
7. If "Backtest Type" is set to "Full": To allow the system to open multiple orders at one time so you test all Longs or Shorts, open the GKD-BT Backtest, click the tab "Properties" and then insert a value of something like 10 orders into the "Pyramiding" settings. This will allow 10 orders to be opened at one time which should be enough to catch all possible Longs or Shorts.
Solo Confirmation Simple (Confirmation, Backtest)
1. Inside the GKD-C indicator, change the "Confirmation Type" setting to "Solo Confirmation Simple"
1. Import the GKD-C indicator into the GKD-BT Backtest: "Input into Backtest"
2. Inside the GKD-BT Backtest, change the setting "Backtest Special" to "Solo Confirmation Simple"
Solo Confirmation Complex without Exits (Baseline, Volatility/Volume, Confirmation, Backtest)
1. Inside the GKD-V indicator, change the "Testing Type" setting to "Chained"
2. Import the GKD-B Baseline into the GKD-V indicator: "Input into Volatility/Volume or Backtest (Baseline testing)"
3. Inside the GKD-C indicator, change the "Confirmation Type" setting to "Solo Confirmation Complex"
4. Import the GKD-V indicator into the GKD-C indicator: "Input into C1 or Backtest"
5. Inside the GKD-BT Backtest, change the setting "Backtest Special" to "GKD Full wo/ Exits"
6. Import the GKD-C into the GKD-BT Backtest: "Input into Exit or Backtest"
Solo Confirmation Complex with Exits (Baseline, Volatility/Volume, Confirmation, Exit, Backtest)
1. Inside the GKD-V indicator, change the "Testing Type" setting to "Chained"
2. Import the GKD-B Baseline into the GKD-V indicator: "Input into Volatility/Volume or Backtest (Baseline testing)"
3. Inside the GKD-C indicator, change the "Confirmation Type" setting to "Solo Confirmation Complex"
4. Import the GKD-V indicator into the GKD-C indicator: "Input into C1 or Backtest"
5. Import the GKD-C indicator into the GKD-E indicator: "Input into Exit"
6. Inside the GKD-BT Backtest, change the setting "Backtest Special" to "GKD Full w/ Exits"
7. Import the GKD-E into the GKD-BT Backtest: "Input into Backtest"
Full GKD without Exits (Baseline, Volatility/Volume, Confirmation 1, Confirmation 2, Continuation, Backtest)
1. Inside the GKD-V indicator, change the "Testing Type" setting to "Chained"
2. Import the GKD-B Baseline into the GKD-V indicator: "Input into Volatility/Volume or Backtest (Baseline testing)"
3. Inside the GKD-C 1 indicator, change the "Confirmation Type" setting to "Confirmation 1"
4. Import the GKD-V indicator into the GKD-C 1 indicator: "Input into C1 or Backtest"
5. Inside the GKD-C 2 indicator, change the "Confirmation Type" setting to "Confirmation 2"
6. Import the GKD-C 1 indicator into the GKD-C 2 indicator: "Input into C2"
7. Inside the GKD-C Continuation indicator, change the "Confirmation Type" setting to "Continuation"
8. Inside the GKD-BT Backtest, change the setting "Backtest Special" to "GKD Full wo/ Exits"
9. Import the GKD-E into the GKD-BT Backtest: "Input into Exit or Backtest"
Full GKD with Exits (Baseline, Volatility/Volume, Confirmation 1, Confirmation 2, Continuation, Exit, Backtest)
1. Inside the GKD-V indicator, change the "Testing Type" setting to "Chained"
2. Import the GKD-B Baseline into the GKD-V indicator: "Input into Volatility/Volume or Backtest (Baseline testing)"
3. Inside the GKD-C 1 indicator, change the "Confirmation Type" setting to "Confirmation 1"
4. Import the GKD-V indicator into the GKD-C 1 indicator: "Input into C1 or Backtest"
5. Inside the GKD-C 2 indicator, change the "Confirmation Type" setting to "Confirmation 2"
6. Import the GKD-C 1 indicator into the GKD-C 2 indicator: "Input into C2"
7. Inside the GKD-C Continuation indicator, change the "Confirmation Type" setting to "Continuation"
8. Import the GKD-C Continuation indicator into the GKD-E indicator: "Input into Exit"
9. Inside the GKD-BT Backtest, change the setting "Backtest Special" to "GKD Full w/ Exits"
10. Import the GKD-E into the GKD-BT Backtest: "Input into Backtest"
Baseline + Volatility/Volume (Baseline, Volatility/Volume, Backtest)
1. Inside the GKD-V indicator, change the "Testing Type" setting to "Baseline + Volatility/Volume"
2. Inside the GKD-V indicator, make sure the "Signal Type" setting is set to "Traditional"
3. Import the GKD-B Baseline into the GKD-V indicator: "Input into Volatility/Volume or Backtest (Baseline testing)"
4. Inside the GKD-BT Backtest, change the setting "Backtest Special" to "Baseline + Volatility/Volume"
5. Import the GKD-V into the GKD-BT Backtest: "Input into C1 or Backtest"
6. Inside the GKD-BT Backtest, change the setting "Backtest Type" to "Full". For this backtest, you must test Longs and Shorts separately
7. To allow the system to open multiple orders at one time so you can test all Longs or Shorts, open the GKD-BT Backtest, click the tab "Properties" and then insert a value of something like 10 orders into the "Pyramiding" settings. This will allow 10 orders to be opened at one time which should be enough to catch all possible Longs or Shorts.
Requirements
Inputs
Confirmation 1: GKD-V Volatility / Volume indicator
Confirmation 2: GKD-C Confirmation indicator
Continuation: GKD-C Confirmation indicator
Solo Confirmation Simple: GKD-B Baseline
Solo Confirmation Complex: GKD-V Volatility / Volume indicator
Solo Confirmation Super Complex: GKD-V Volatility / Volume indicator
Stacked 1: None
Stacked 2+: GKD-C, GKD-V, or GKD-B Stacked 1
Outputs
Confirmation 1: GKD-C Confirmation 2 indicator
Confirmation 2: GKD-C Continuation indicator
Continuation: GKD-E Exit indicator
Solo Confirmation Simple: GKD-BT Backtest
Solo Confirmation Complex: GKD-BT Backtest or GKD-E Exit indicator
Solo Confirmation Super Complex: GKD-C Continuation indicator
Stacked 1: GKD-C, GKD-V, or GKD-B Stacked 2+
Stacked 2+: GKD-C, GKD-V, or GKD-B Stacked 2+ or GKD-BT Backtest
Additional features will be added in future releases.
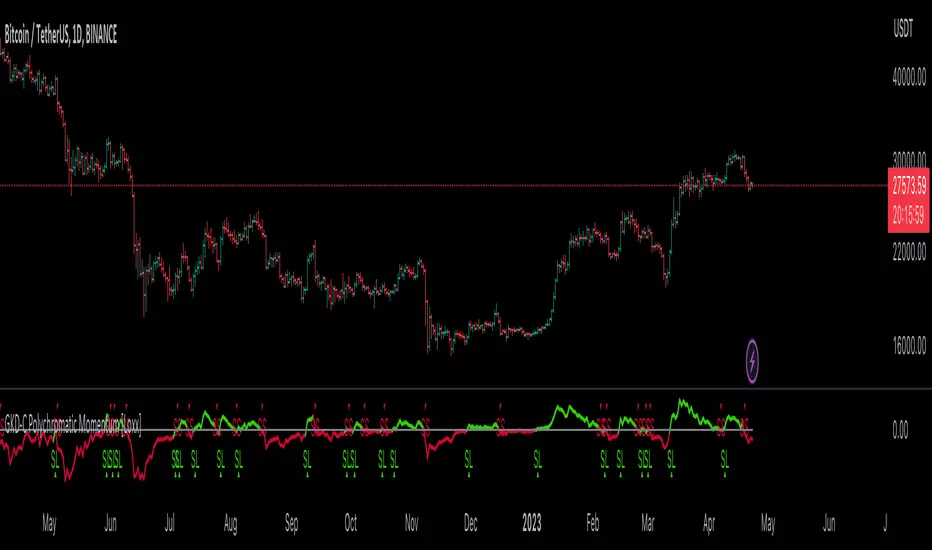
Momentum and AccelerationThe following oscillator is a twist on momentum, incorporating a 2nd derivative "acceleration" to help determine changes in momentum. Both are plotted directly accessing previous series values rather than using a moving average.
The script has an option to divide so the formula is d(Price)/d(Time), like a derivative. The script also provides options for the user to use their price source, volume, or a combination of price and volume.
Credit: This script utilizes the "color gradient framework" tutorial by LucF (PineCoders) to create user-adjustable gradient visuals.
Definitions
"1st Derivative - Momentum" - Momentum is most commonly referred to as a rate and measures the acceleration of the price and/or volume of a security.
"2nd Derivative - Acceleration" - Acceleration is the rate of change of momentum.
Value Added
This script may help the trader to assess directional changes in momentum easier.
This script also plots using previous series values rather than using a moving average function. To my knowledge, I was unable to find one that does this for "2nd derivative", so it had to be created.
Momentum Candle V2 by Sekolah Trading📌 Momentum Candle V2 by Sekolah Trading – Pair-Based Volatility & Wick Ratio Filter
This script provides a structured and adaptive approach to detecting high-probability momentum candles in intraday markets. It dynamically adjusts pip thresholds and wick filtering conditions based on the selected symbol and timeframe, making it highly practical for real-time trading.
🔍 Concept and Originality
Momentum Candle V2 by Sekolah Trading implements a custom-built methodology combining:
Dynamic Pip Calibration
For each supported instrument (e.g., XAUUSD, USDJPY, GBPUSD, AUDUSD, EURUSD, BTCUSD), the user can define a pip threshold that determines the minimum valid body size for momentum candles. These thresholds are tailored for each pair and timeframe (M5, M15, H1), ensuring the logic adjusts to different volatility profiles.
Wick-to-Body Ratio Filtering
The script filters out candles with large wicks by requiring that total wick length (upper + lower) be no more than 30% of the full candle range. This helps identify decisive candles with minimal rejection.
Directional Validation
Bullish momentum is defined as: Close > Open with a shorter upper wick.
Bearish momentum is: Close < Open with a shorter lower wick.
Real-Time Timing Filter
Alerts are only triggered when the current candle is between 20 and 90 seconds from closing, which reduces noise and encourages confirmation-based entry.
Non-Repainting Logic
All calculations run in real-time with confirmed candles only — no lookahead or future leak.
📊 Visual Output – How to Read the Chart
When the conditions above are met, the script displays triangle markers on the chart:
🔺 Red downward triangle above the candle: valid bearish momentum signal
🔻 Blue upward triangle below the candle: valid bullish momentum signal
These shapes appear on live bars during the final moments of the candle to alert traders to potential confirmed momentum.
🔔 Alert Conditions
Two alert types are provided:
Momentum Bullish: Large bullish candle with small upper wick, during last 20–90s of bar
Momentum Bearish: Large bearish candle with small lower wick, same timing window
Alerts are designed for precision entries at candle close.
🧭 How to Use
Apply the script to a 5m, 15m, or 1h chart.
Configure pip thresholds for your preferred pairs from the input settings.
Watch for triangle markers near the close of each candle:
Blue = potential bullish momentum
Red = potential bearish momentum
Set alerts:
Go to Alerts → Select Momentum Bullish or Momentum Bearish
Frequency: Once Per Bar
Customize message: e.g. “Momentum Bullish on XAUUSD M15”
Combine signals with:
EMA, S/R, or trend filters
Volume/Order Flow
Liquidity zone or breakout context
🛡️ Why This Script Is Closed-Source
This script uses proprietary logic developed by Sekolah Trading, including:
Custom pip calibration engine
Adaptive wick filtering
Real-time entry validation with triangle plots
While the code is protected, the methodology has been explained transparently here in accordance with TradingView publishing rules.
⚠️ Disclaimer
This script is provided for educational and technical analysis purposes only.
It does not guarantee results or provide financial advice. Always verify trades with your own strategy and risk controls.
Author: Sekolah Trading
Version: Momentum Candle V2
Built with Pine Script v6

Dynamic Volume-Volatility Adjusted MomentumThis Indicator in a refinement of my earlier script PC*VC Moving average Old with easier to follow color codes, overbought and oversold zones. This script has converted the previous script into a standardized measure by converting it into Z-scores and also incorporated a volatility based dynamic length option. Below is a detailed Explanation.
The "Dynamic Volume-Volatility Adjusted Momentum" or "Nasan Momentum Oscillator" is designed to capture market momentum while accounting for volume and volatility fluctuations. It leverages the Typical Price (TP), calculated as the average of high, low, and close prices, and introduces the Price Coefficient (PC) based on deviations from the simple moving average (SMA) across various time frames. Additionally, the Volume Coefficient (VC) compares current volume to SMA, and calculates Intraday Volatility (IDV) which gauges the daily price range relative to the close. Then intraday volatility ratio is calculated ( IDV Ratio) as the ratio of current Intraday Volatility (IDV) to the average of IDV for three different length periods, which provides a relative measure of current intraday volatility compared to its recent historical average. An inter-day ATR based Relative Volatility (RV) is calculated to adjusts for changing market volatility based on which the dynamic length adjustment adapts the moving average (standard length is 14). The PC *VC/IDV Ratio integrates price, volume, and volatility information which provides a volume and volatility adjusted momentum. This volume and volatility adjusted momentum is converted into a standardized Z-Score. The Z-Score measures deviations from the mean. Color-coded plots visually represent momentum, and thresholds aid in identifying overbought or oversold conditions.
The indicator incorporates a nuanced approach to emphasize the joint impact of price and volume while considering the stabilizing effect of lower intraday volatility. Placing the volume ratio (VC) in the numerator means that higher volume positively contributes to the overall ratio, aligning with the observation that increased volumes often accompany robust price movements. Simultaneously, the decision to include the inverse of intraday volatility (1/IDV) in the denominator acts as a dampener, reducing the impact of extreme intraday volatility on the momentum indicator. This design choice aims to filter out noise, giving more weight to significant price changes supported by substantial trading activity. In essence, the indicator's design seeks to provide a more robust momentum measure that balances the influence of price, volume, and volatility in the analysis of market dynamics.
Composite Momentum IndicatorComposite Momentum Indicator" combines the signals from several oscillators, including Stochastic, RSI, Ultimate Oscillator, and Commodity Channel Index (CCI) by averaging the standardized values (Z-Scores). Since it is a Z-Score based indicators the values will be typically be bound between +3 and -3 oscillating around 0. Here's a summary of the code:
Input Parameters: Users can customize the look-back period and set threshold values for overbought and oversold conditions. They can also choose which oscillators to include in the composite calculation.
Oscillator Calculations: The code calculates four separate oscillators - Stochastic, RSI, Ultimate Oscillator, and CCI - each measuring different aspects of market momentum.
Z-Scores Calculation: For each oscillator, the code calculates a Z-Score, which normalizes the oscillator's values based on its historical standard deviation and mean. This allows for a consistent comparison of oscillator values across different timeframes.
Composite Z-Score: The code aggregates the Z-Scores from the selected oscillators, taking into account user preferences (whether to include each oscillator). It then calculates an average Z-Score to create the "Composite Momentum Oscillator."
Conditional Color Coding: The composite oscillator is color-coded based on its average Z-Score value. It turns green when it's above the overbought threshold, red when it's below the oversold threshold, and blue when it's within the specified range.
Horizontal Lines: The code plots horizontal lines at key levels, including 0, ±3, ±2, and ±1, to help users identify important momentum levels.
Gradient Fills: It adds gradient fills above the overbought threshold and below the oversold threshold to visually highlight extreme momentum conditions.
Combining the Stochastic, RSI, Ultimate Oscillator, and Commodity Channel Index (CCI) into one composite indicator offers several advantages for traders and technical analysts:
Comprehensive Insight: Each of these oscillators measures different aspects of market momentum and price action. Combining them into one indicator provides a more comprehensive view of the market's behavior, as it takes into account various dimensions of momentum simultaneously.
Reduced Noise: Standalone oscillators can generate conflicting signals and produce noisy readings, especially during choppy market conditions. A composite indicator smoothes out these discrepancies by averaging the signals from multiple indicators, potentially reducing false signals.
Confirmation and Divergence: By combining multiple oscillators, traders can seek confirmation or divergence signals. When multiple oscillators align in the same direction, it can strengthen a trading signal. Conversely, divergence between the oscillators can warn of potential reversals or weakening trends.
Customization: Traders can tailor the composite indicator to their specific trading strategies and preferences. They have the flexibility to include or exclude specific oscillators, adjust look-back periods, and set threshold levels. This adaptability allows for a more personalized approach to technical analysis.
Clarity and Efficiency: Rather than cluttering the chart with multiple individual oscillators, a composite indicator condenses the information into a single plot. This enhances the clarity of the chart and makes it easier for traders to quickly interpret market conditions.
Overbought/Oversold Identification: Combining these oscillators can improve the identification of overbought and oversold conditions. It reduces the likelihood of false signals since multiple indicators must align to trigger these extreme conditions.
Educational Tool: For novice traders and analysts, a composite indicator can serve as an educational tool by demonstrating how different oscillators interact and influence each other's signals. It allows users to learn about multiple technical indicators in one glance.
Efficient Use of Screen Space: A single composite indicator occupies less screen space compared to multiple separate indicators. This is especially beneficial when analyzing multiple markets or timeframes simultaneously.
Holistic Approach: Instead of relying on a single indicator, a composite approach encourages a more holistic assessment of market conditions. Traders can consider a broader range of factors before making trading decisions.
Increased Confidence: A composite indicator can boost traders' confidence in their decisions. When multiple reliable indicators align, it can provide a stronger basis for taking action in the market.
In summary, combining the Stochastic, RSI, Ultimate Oscillator, and CCI into one composite indicator enhances the depth and reliability of technical analysis. It simplifies the decision-making process, reduces noise, and offers a more complete picture of market momentum, ultimately helping traders make more informed and well-rounded trading decisions.
* Feel free to compare against individual oscillatiors*
