4 Bar Momentum Reversal strategy█ STRATEGY DESCRIPTION
The "4 Bar Momentum Reversal Strategy" is a mean-reversion strategy designed to identify price reversals following a sustained downward move. It enters a long position when a reversal condition is met and exits when the price shows strength by exceeding the previous bar's high. This strategy is optimized for indices and stocks on the daily timeframe.
█ WHAT IS THE REFERENCE CLOSE?
The Reference Close is the closing price from X bars ago, where X is determined by the Lookback period. Think of it as a moving benchmark that helps the strategy assess whether prices are trending upwards or downwards relative to past performance. For example, if the Lookback is set to 4, the Reference Close is the closing price 4 bars ago (`close `).
█ SIGNAL GENERATION
1. LONG ENTRY
A Buy Signal is triggered when:
The close price has been lower than the Reference Close for at least `Buy Threshold` consecutive bars. This indicates a sustained downward move, suggesting a potential reversal.
The signal occurs within the specified time window (between `Start Time` and `End Time`).
2. EXIT CONDITION
A Sell Signal is generated when the current closing price exceeds the high of the previous bar (`close > high `). This indicates that the price has shown strength, potentially confirming the reversal and prompting the strategy to exit the position.
█ ADDITIONAL SETTINGS
Buy Threshold: The number of consecutive bearish bars needed to trigger a Buy Signal. Default is 4.
Lookback: The number of bars ago used to calculate the Reference Close. Default is 4.
Start Time and End Time: The time window during which the strategy is allowed to execute trades.
█ PERFORMANCE OVERVIEW
This strategy is designed for trending markets with frequent reversals.
It performs best in volatile conditions where price movements are significant.
Backtesting results should be analysed to optimize the Buy Threshold and Lookback parameters for specific instruments.
Cerca negli script per "momentum"

US/JP Factor/Sector Performance RankingThis indicator is designed to help you easily understand the strengths and weaknesses of different factors and sectors in the U.S. stock market. It looks at various ETFs, ranks their performance over a specific period (20 days by default), and shows the results visually.
= How the Ranking Works
The best-performing rank is shown as -1, with lower ranks as -2, -3, -4, and so on. This setup makes it easy to see rank order in TradingView’s default view.
If you turn on the “Inverse” setting, ranks will be shown as positive numbers in order (e.g., 1, 2, 3…). In this case, it’s recommended to reverse the TradingView scale for better understanding.
= How the Indicator Reacts to Market Conditions
- Normal Market Conditions
Certain factors or sectors often stay at the top rank. For example, during the rallies at the start of 2024 and in May, the Momentum factor performed well, showing a risk-on market environment.
On the other hand, sectors at the bottom rank also tend to stay in specific positions.
- Market Tops
Capital flows within sectors slow down, and top ranks begin to change frequently. This may suggest a market turning point.
- Bear Markets or High Volatility
Rankings become more chaotic in these conditions. These large changes can help you understand market sentiment and the level of volatility.
= Way of using the Indicator
You can use this indicator in the following ways:
- To apply sector rotation strategies.
- To build positions after volatile markets calm down.
- To take long positions on strong elements (higher ranks) and short positions on weaker ones (lower ranks).
= Things to Keep in Mind
It’s a Lagging Indicator
This indicator calculates rankings using the past 20 days of data. It doesn’t provide signals for the future but is a tool for analyzing past performance. To predict the market, you should combine this with other tools or leading indicators.
However, since trends in capital flows often continue, this indicator can help you spot those trends.
= Customization
This indicator is set up for U.S. and Japanese stock markets. However, you can customize it for other markets by changing the ticker and label description in the script.
==Japanese Description==
このインジケーターは、米国株市場におけるファクターやセクターの強弱を直感的に把握するために設計されています。
各ETFを参照し、特定期間(デフォルトでは20日間)のパフォーマンスを順位付けし、それを視覚的に表示します。
= インジケーターの特徴
- ランク付けの仕様
ランク1位は-1で表され、順位が下がるごとに-2、-3、-4…と減少します。この仕様により、TradingViewの標準状態でランクの高低を直感的に把握できるようにしました。
さらに、Inverse設定をONにすると、1位から順に正の値(例: 1, 2, 3…)で表示されるようになります。この場合、TradingViewのスケールを反転させることを推奨します。
= 市況とインジケーターの動き
- 平常時の市況
特定のファクターやセクターがランク1位を維持することが多いです。
例えば、2024年の年初や同年5月の上昇相場では、Momentumファクターが効果を発揮し、リスクオンの市場環境であったことを示しています。
一方、最下位に位置するセクターも特定の順位を維持する傾向があります。
- 天井圏の市況
セクター内の資金流入や流出が停滞し、上位ランクの変動が起こり始めます。これが市場の転換点を示唆する場合があります。
- 下落相場や荒れた市況
ランク順位が大きく乱れることが特徴です。この変動の大きさは、市況の雰囲気やボラティリティの高さを感じ取る材料として活用できます。
= 活用方法
このインジケーターは以下のような投資戦略に役立てることができます:
- セクターローテーションを活用した投資戦略
- 荒れた相場が落ち着いたタイミングでのポジション構築
- 強い要素(ランク上位)のロング、弱い要素(ランク下位)のショート
= 注意点
- 遅行指標であること
本インジケーターは、過去20日間のデータを基にランクを算出します。そのため、先行的なシグナルを提供するものではなく、過去のパフォーマンスに基づいた分析ツールです。市場を先回りするには、別途先行指標や分析を組み合わせる必要があります。
ただし、特定のファクターやセクターへの資金流入・流出が継続する傾向があるため、これを見極める手助けにはなります。
= カスタマイズについて
このインジケーターは米国・日本株市場に特化しています。ただし、他国のファクターやセクターのETFや指数が利用可能であれば、スクリプト内のtickerとlabel descriptionを変更することでカスタマイズが可能です。

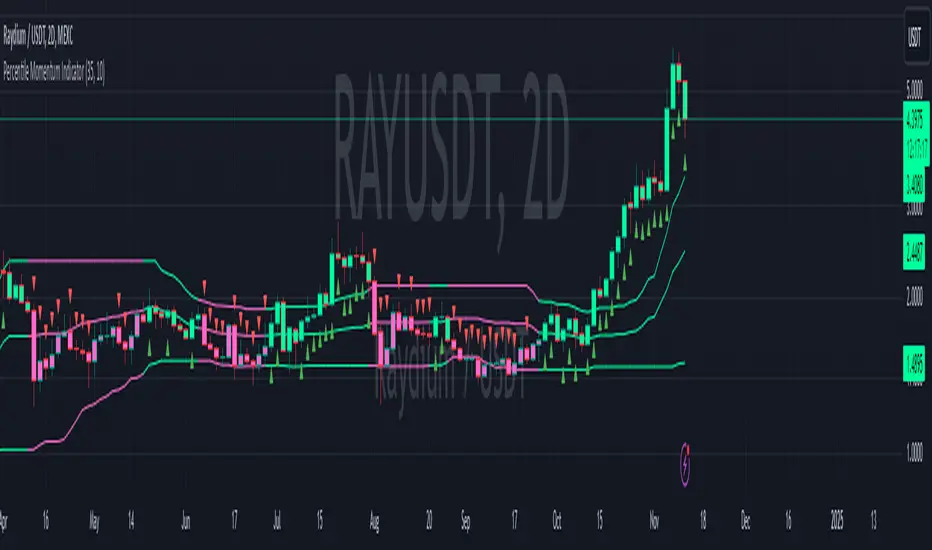
Percentile Momentum IndicatorInput Parameters:
lengthPercentile: Defines the period used to calculate the percentile values (default: 30).
lengthMomentum: Defines the period for calculating the Rate of Change (ROC) momentum (default: 10).
Core Logic:
Rate of Change (ROC): The script calculates the ROC of the closing price over the specified period (lengthMomentum).
Percentile Calculations: The script calculates two key percentiles:
percentile_upper (80th percentile of the high prices)
percentile_lower (20th percentile of the low prices)
Percentile Average: An average of the upper and lower percentiles is calculated (avg_percentile).
Trade Signals:
Buy Signal: Triggered when the ROC is positive, the close is above the percentile_lower, and the close is above the avg_percentile.
Sell Signal: Triggered when the ROC is negative, the close is below the percentile_upper, and the close is below the avg_percentile.
Trade State Management:
The script uses a binary state: 1 for long (buy) and -1 for short (sell).
The trade state is updated based on buy or sell signals.
Bar Coloring:
Bars are colored dynamically based on the trade state:
Green for long (buy signal).
Red for short (sell signal).
The same color is applied to the percentile and average percentile lines for visual consistency.
The Most Powerful TQQQ EMA Crossover Trend Trading StrategyTQQQ EMA Crossover Strategy Indicator
Meta Title: TQQQ EMA Crossover Strategy - Enhance Your Trading with Effective Signals
Meta Description: Discover the TQQQ EMA Crossover Strategy, designed to optimize trading decisions with fast and slow EMA crossovers. Learn how to effectively use this powerful indicator for better trading results.
Key Features
The TQQQ EMA Crossover Strategy is a powerful trading tool that utilizes Exponential Moving Averages (EMAs) to identify potential entry and exit points in the market. Key features of this indicator include:
**Fast and Slow EMAs:** The strategy incorporates two EMAs, allowing traders to capture short-term trends while filtering out market noise.
**Entry and Exit Signals:** Automated signals for entering and exiting trades based on EMA crossovers, enhancing decision-making efficiency.
**Customizable Parameters:** Users can adjust the lengths of the EMAs, as well as take profit and stop loss multipliers, tailoring the strategy to their trading style.
**Visual Indicators:** Clear visual plots of the EMAs and exit points on the chart for easy interpretation.
How It Works
The TQQQ EMA Crossover Strategy operates by calculating two EMAs: a fast EMA (default length of 20) and a slow EMA (default length of 50). The core concept is based on the crossover of these two moving averages:
- When the fast EMA crosses above the slow EMA, it generates a *buy signal*, indicating a potential upward trend.
- Conversely, when the fast EMA crosses below the slow EMA, it produces a *sell signal*, suggesting a potential downward trend.
This method allows traders to capitalize on momentum shifts in the market, providing timely signals for trade execution.
Trading Ideas and Insights
Traders can leverage the TQQQ EMA Crossover Strategy in various market conditions. Here are some insights:
**Scalping Opportunities:** The strategy is particularly effective for scalping in volatile markets, allowing traders to make quick profits on small price movements.
**Swing Trading:** Longer-term traders can use this strategy to identify significant trend reversals and capitalize on larger price swings.
**Risk Management:** By incorporating customizable stop loss and take profit levels, traders can manage their risk effectively while maximizing potential returns.
How Multiple Indicators Work Together
While this strategy primarily relies on EMAs, it can be enhanced by integrating additional indicators such as:
- **Relative Strength Index (RSI):** To confirm overbought or oversold conditions before entering trades.
- **Volume Indicators:** To validate breakout signals, ensuring that price movements are supported by sufficient trading volume.
Combining these indicators provides a more comprehensive view of market dynamics, increasing the reliability of trade signals generated by the EMA crossover.
Unique Aspects
What sets this indicator apart is its simplicity combined with effectiveness. The reliance on EMAs allows for smoother signals compared to traditional moving averages, reducing false signals often associated with choppy price action. Additionally, the ability to customize parameters ensures that traders can adapt the strategy to fit their unique trading styles and risk tolerance.
How to Use
To effectively utilize the TQQQ EMA Crossover Strategy:
1. **Add the Indicator:** Load the script onto your TradingView chart.
2. **Set Parameters:** Adjust the fast and slow EMA lengths according to your trading preferences.
3. **Monitor Signals:** Watch for crossover points; enter trades based on buy/sell signals generated by the indicator.
4. **Implement Risk Management:** Set your stop loss and take profit levels using the provided multipliers.
Regularly review your trading performance and adjust parameters as necessary to optimize results.
Customization
The TQQQ EMA Crossover Strategy allows for extensive customization:
- **EMA Lengths:** Change the default lengths of both fast and slow EMAs to suit different time frames or market conditions.
- **Take Profit/Stop Loss Multipliers:** Adjust these values to align with your risk management strategy. For instance, increasing the take profit multiplier may yield larger gains but could also increase exposure to market fluctuations.
This flexibility makes it suitable for various trading styles, from aggressive scalpers to conservative swing traders.
Conclusion
The TQQQ EMA Crossover Strategy is an effective tool for traders seeking an edge in their trading endeavors. By utilizing fast and slow EMAs, this indicator provides clear entry and exit signals while allowing for customization to fit individual trading strategies. Whether you are a scalper looking for quick profits or a swing trader aiming for larger moves, this indicator offers valuable insights into market trends.
Incorporate it into your TradingView toolkit today and elevate your trading performance!

CoT Trend Change MomentumI discovered that whenever there's huge change in long IO or short IO there will be a momentum shift. So, I created this indicator to spot massive explosive volume changes for commercials and non commercials activity. Using standard deviation 2 and -2 as extreme point. Whatever crossing above standard deviation 2 indicating positions are added regardless whether it is long or shorts, whatever crossing below standard deviation -2 means positions are closed.
This is how I use this indicator:
1) In this example , i use only the commercials long and shorts. Whenever the longs exceed stdeviation +2, means that long volume flow in massively, for me this can be indicating potential to the upside. Whenever longs fall below stdeviation-2, for me this can be indicating that commercials are either taking profits for the short positions or accumulating for another bull price.
2) For shorts same logic applied here, when it exceeds stdeviation +2, mean commercials shorts position increase massively, when it exceeds stdeviation-2, means that commercials closed their short positions.
For this script, I use 13 weeks period as lookback, u guys may directly modify the period in the script to set the period that u want.
I've added for non-commercials as well, to ease people who emphasizes on non-commercials positioning analysis process.
I'm still trying to incorporate this with Open Interest Analysis. Hopefully u guys find this indicator useful. Feel free to modify it, to understand it more, my suggestions are u compare date by date the positions, to see the extreme points. The indicator only works in weekly chart, it is non repainted only in weekly chart, meaning that the indicator shows the histogram just as the week open.

Uptrick: Bullish/Bearish Signal DetectorDetailed Explanation of the "Uptrick: Bullish/Bearish Signal Detector" Script
The "Uptrick: Bullish/Bearish Signal Detector" script is a sophisticated tool designed for the TradingView platform, leveraging Pine Script version 5. This script is crafted to enhance traders' ability to identify bullish (buy) and bearish (sell) signals directly on their trading charts. By combining the power of the MACD (Moving Average Convergence Divergence) and RSI (Relative Strength Index) indicators, this script provides a unique and efficient method for detecting potential trading opportunities. Below is an in-depth exploration of its purpose, features, and functionality.
Purpose
The primary purpose of this script is to assist traders in identifying potential entry and exit points in the market by signaling bullish and bearish conditions. This automated detection helps traders make more informed decisions without the need to manually analyze complex indicators. By overlaying signals directly on the price chart, the script allows for quick visual identification of market trends and reversals.
Uniqueness
What sets this script apart is its dual use of MACD and RSI indicators. While many trading strategies might rely on a single indicator, combining MACD and RSI enhances the reliability of the signals by filtering out false positives. The script not only identifies trends but also adds a layer of confirmation through the RSI, which measures the speed and change of price movements.
Inputs and Features
Customizable Label Appearance:
The script allows users to customize the appearance of the labels that indicate bullish and bearish signals. Users can set their preferred colors for the labels and the text, ensuring that the signals are easily distinguishable and aesthetically pleasing on their charts.
MACD Calculation:
The script calculates the MACD line and signal line using user-defined input values for the fast length, slow length, and signal length. The MACD histogram, which is the difference between the MACD line and the signal line, is used to determine the momentum of the market.
RSI Calculation:
The RSI is calculated using a user-defined input length. The RSI helps in identifying overbought or oversold conditions, which are crucial for confirming the strength of the trend detected by the MACD.
Bullish and Bearish Conditions:
The script defines bullish conditions as those where the MACD histogram is positive and the RSI is above 50. Bearish conditions are defined where the MACD histogram is negative and the RSI is below 50. This combination of conditions ensures that signals are generated based on both momentum and relative strength, reducing the likelihood of false signals.
Label Plotting:
The script plots labels on the chart to indicate bullish and bearish signals. When a bullish condition is met, and the previous signal was not bullish, a "LONG" label is plotted. Similarly, when a bearish condition is met, and the previous signal was not bearish, a "SHORT" label is plotted. This feature helps in clearly marking the points of interest for traders, making it easier to spot potential trades.
Tracking Previous Signals:
To avoid repetitive signals, the script keeps track of the last signal. If the last signal was bullish, it avoids plotting another bullish signal immediately. The same logic applies to bearish signals. This tracking ensures that signals are spaced out and only significant changes in market conditions are highlighted.
How It Works
The script operates in a loop, processing each bar (or candlestick) on the chart as new data comes in. It calculates the MACD and RSI values for each bar and checks if the current conditions meet the criteria for a bullish or bearish signal. If a signal is detected and it is different from the last signal, a label is plotted on the chart at the current bar's price level. This real-time processing allows traders to see the signals as they form, providing timely insights into market movements.
Practical Application
For practical use, a trader would add this script to their TradingView chart. They can customize the input parameters for the MACD and RSI calculations to fit their trading strategy or preferred settings. Once added, the script will automatically analyze the price data and start plotting "LONG" and "SHORT" labels based on the detected signals. Traders can then use these labels to make decisions on entering or exiting trades, adjusting their strategy as necessary based on the signals provided.
Conclusion
The "Uptrick: Bullish/Bearish Signal Detector" script is a powerful tool for any trader looking to leverage technical indicators for better trading decisions. By combining MACD and RSI, it offers a robust method for detecting market trends and potential reversals. The customizable features and real-time signal plotting make it a versatile and user-friendly addition to any trading toolkit. This script not only simplifies the process of technical analysis but also enhances the accuracy of trading signals, thereby potentially increasing the trader's success rate in the market.

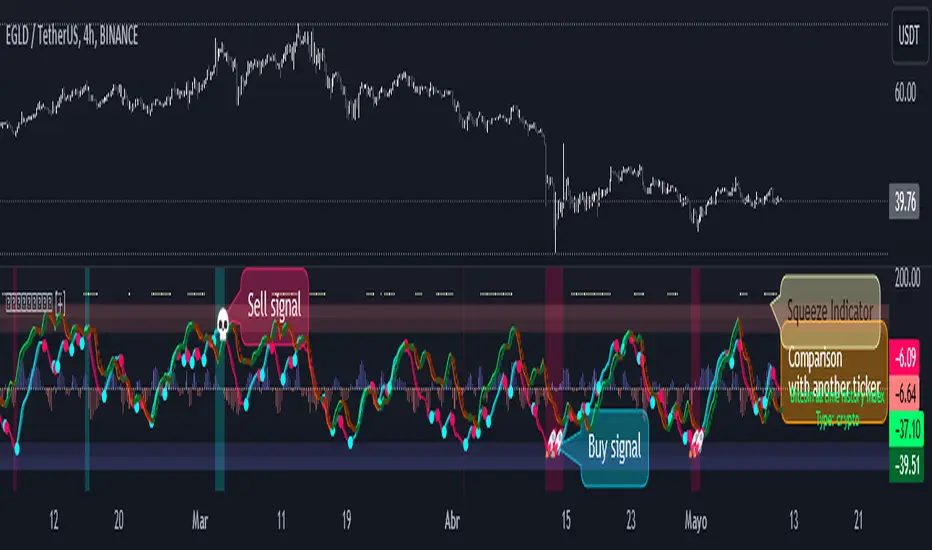
WaveTrend Oscillator PlusThe WaveTrend based on “Enhanced WaveTrend” of EliCobra. The WaveTrend Oscillator is a popular technical analysis tool used to identify overbought and oversold conditions in the market and generate trading signals. This indicator introduces additional features for improved analysis and comparison across assets.
WaveTrend:
The original WaveTrend indicator calculates two lines based on exponential moving averages and their relationship to the asset's price. The first line measures the distance between the asset's price and its EMA, while the second line smooths the first line over a specific period. The result is divided by 0.015 multiplied by the smoothed difference ('d' for reference). The indicator aims to identify overbought and oversold conditions by analyzing the relationship between the two lines.
In the original formula, the rudimentary estimation factor 0.015 times 'd' fails to accomodate for approximately a quarter of the data, preventing the indicator from reaching the traditional stationary levels of +-100. This limitation renders the indicator quantitatively biased, as it relies on the user's subjective adjustment of the levels. The enhanced version replaces this factor with the standard deviation of the asset's price, resulting in improved estimation accuracy and provides a more dynamic and robust outcome, we thereafter multiply the result by 100 to achieve a more traditional oscillation.
Enhancements and Features:
Dynamic Estimation: The original indicator uses an arbitrary estimation factor, while the enhanced version replaces it with the standard deviation of the asset's price. This modification provides a more dynamic and accurate estimation, adapting to the specific price characteristics of each asset.
Stationary Support and Resistance Levels: The enhanced version provides stationary key support and resistance levels that range from -150 to 150. These levels are determined based on the analysis of the indicator's data and encompass more than 95% of the indicator's values. These levels offer important reference points for traders to identify potential price reversals or significant price movements.
Comparison Across Assets: The enhanced version allows for better comparison and analysis across different assets. By incorporating the standard deviation of the asset's price, the indicator provides a more consistent and comparable interpretation of the market conditions across multiple assets.
Z-Score Analysis:
The Z-Score is a statistical measurement that quantifies how far a particular data point deviates from the mean in terms of standard deviations. In the enhanced version, the calculation involves determining the basis (mean) and deviation (standard deviation) of the asset's price to calculate its Z-Score, thereafter applying a smoothing technique to generate the final WaveTrend value.
Utility:
The offers traders and investors valuable insights into overbought and oversold conditions in the market. By analyzing the indicator's values and referencing the stationary support and resistance levels, traders can identify potential trend reversals, evaluate market strength, and make better informed analysis.
The following indicators were added:
⎆⎆ Squeeze Momentum Indicator
⎆⎆ Elliott Wave Oscillator
⎆⎆ Expert Trend Locator
UT Bot Stochastic RSIUT Bot Stochastic RSI is a powerful trading tool designed to help traders identify potential buy and sell signals in the market. This indicator combines the Stochastic and RSI (Relative Strength Index) oscillators, two of the most popular and effective technical analysis tools, to provide a comprehensive view of market conditions.
The Stochastic oscillator is a momentum indicator that compares a security's closing price to its price range over a given time period. The RSI, on the other hand, is a momentum oscillator that measures the speed and change of price movements. By combining these two indicators, the UT Bot Stochastic RSI can help traders identify overbought and oversold conditions, as well as potential trend reversals.
The UT Bot Stochastic RSI also includes an ATR (Average True Range) trailing stop, which can be used to set stop-loss levels and manage risk. This feature is particularly useful in volatile markets, where price movements can be large and unpredictable.
In addition to its powerful technical analysis tools, the UT Bot Stochastic RSI also includes a backtesting feature, allowing traders to test their strategies on historical data. This can help traders identify the most effective settings for the indicator and improve their trading performance.
Overall, the UT Bot Stochastic RSI is a versatile and effective tool for traders of all levels, providing valuable insights into market conditions and helping to improve trading decisions

Elliott's Quadratic Momentum - Strategy [presentTrading]█ Introduction and How It Is Different
The "Elliott's Quadratic Momentum - Strategy" is a unique and innovative approach in the realm of technical trading. This strategy is a fusion of multiple SuperTrend indicators combined with an Elliott Wave-like pattern analysis, offering a comprehensive and dynamic trading tool. It stands apart from conventional strategies by incorporating multiple layers of trend analysis, thereby providing a more robust and nuanced view of market movements.
*Although the script doesn't explicitly analyze Elliott Wave patterns, it employs a wave-like approach by considering multiple SuperTrend indicators. Elliott Wave theory is based on the premise that markets move in predictable wave patterns. While this script doesn't identify specific Elliott Wave structures like impulsive and corrective waves, the sequential checking of trend conditions across multiple SuperTrend indicators mimics a wave-like progression.
BTC 8hr Long/Short Performance
Local Detail
█ Strategy, How It Works: Detailed Explanation
The core of this strategy lies in its multi-tiered approach:
1. Multiple SuperTrend Indicators:
The strategy employs four different SuperTrend indicators, each with unique ATR lengths and multipliers. These indicators offer various perspectives on market trends, ranging from short to long-term views.
By analyzing the convergence of these indicators, the strategy can pinpoint robust entry signals for both long and short positions.
2. Elliott Wave-like Pattern Recognition:
While not directly applying Elliott Wave theory, the strategy takes inspiration from its pattern recognition approach. It looks for alignments in market movements that resemble the characteristic waves of Elliott's theory.
This pattern recognition aids in confirming the signals provided by the SuperTrend indicators, adding an extra layer of validation to the trading signals.
3. Comprehensive Market Analysis:
By combining multiple indicators and pattern analysis, the strategy offers a holistic view of the market. This allows for capturing potential trend reversals and significant market moves early.
█ Trade Direction
The strategy is designed with flexibility in mind, allowing traders to select their preferred trading direction – Long, Short, or Both. This adaptability is key for traders looking to tailor their approach to different market conditions or personal trading styles. The strategy automatically adjusts its logic based on the chosen direction, ensuring that traders are always aligned with their strategic objectives.
█ Usage
To utilize the "Elliott's Quadratic Momentum - Strategy" effectively:
Traders should first determine their trading direction and adjust the SuperTrend settings according to their market analysis and risk appetite.
The strategy is versatile and can be applied across various time frames and asset classes, making it suitable for a wide range of trading scenarios.
It's particularly effective in trending markets, where the alignment of multiple SuperTrend indicators can provide strong trade signals.
█ Default Settings
Trading Direction: Configurable (Long, Short, Both)
SuperTrend Settings:
SuperTrend 1: ATR Length 7, Multiplier 4.0
SuperTrend 2: ATR Length 14, Multiplier 3.618
SuperTrend 3: ATR Length 21, Multiplier 3.5
SuperTrend 4: ATR Length 28, Multiplier 3.382
Additional Settings: Gradient effect for trend visualization, customizable color schemes for upward and downward trends.

Trig-Log Scaled Momentum OscillatorTaylor Series Approximations for Trigonometry:
1. The indicator starts by calculating sine and cosine values of the close price using Taylor Series approximations. These approximations use polynomial terms to estimate the values of these trigonometric functions.
Mathematical Component Formation:
2. The calculated sine and cosine values are then multiplied together. This gives us the primary mathematical component, termed as the 'trigComponent'.
Smoothing Process:
3. To ensure that our indicator is less susceptible to market noise and more reactive to genuine price movements, this 'trigComponent' undergoes a smoothing process using a simple moving average (SMA). The length of this SMA is defined by the user.
Logarithmic Transformation:
4. With our smoothed value, we apply a natural logarithm approximation. Again, this approximation is based on the Taylor expansion. This step ensures that all resultant values are positive and offers a different scale to interpret the smoothed component.
Dynamic Scaling:
5. To make our indicator more readable and comparable over different periods, the logarithmically transformed values are scaled between a range. This range is determined by the highest and lowest values of the transformed component over the user-defined 'lookback' period.
ROC (Rate of Change) Direction:
6. The direction of change in our scaled value is determined. This offers a quick insight into whether our mathematical component is increasing or decreasing compared to the previous value.
Visualization:
7. Finally, the indicator plots the dynamically scaled and smoothed mathematical component on the chart. The color of the plotted line depends on its direction (increasing or decreasing) and its boundary values.

Variety Step RSI w/ Dynamic Zones [Loxx]Variety Step RSI w/ Dynamic Zones is a stepped RSI calculation with Discontinued Signal Lines. This indicator includes 7 types of RSI to choose from. The addition of the Discontinued Signal Lines allows this indicator to better identify momentum shifts in price so traders have better defined long/short signals.
Enhanced Moving Average Calculation with Stepped Moving Average and the Advantages over Regular RSI
Technical analysis plays a crucial role in understanding and predicting market trends. One popular indicator used by traders and analysts is the Relative Strength Index (RSI). However, an enhanced approach called Stepped Moving Average, in combination with the Slow RSI function, offers several advantages over regular RSI calculations.
█ Stepped Moving Average and Moving Averages:
The Stepped Moving Average function serves as a crucial component in the calculation of moving averages. Moving averages smooth out price data over a specific period to identify trends and potential trading signals. By employing the Stepped Moving Average function, traders can enhance the accuracy of moving averages and make more informed decisions.
Stepped Moving Average takes two parameters:
The current RSI value and a size parameter. It computes the next step in the moving average calculation by determining the upper and lower bounds of the moving average range. It accomplishes this by adjusting the values of smax and smin based on the given RSI and size.
Furthermore, Stepped Moving Average introduces the concept of a trend variable. By comparing the previous trend value with the current RSI and the previous upper and lower bounds, it updates the trend accordingly. This feature enables traders to identify potential shifts in market sentiment and make timely adjustments to their trading strategies.
█ Advantages over Regular RSI:
Enhanced Range Boundaries:
The inclusion of size parameters in Stepped Moving Average allows for more precise determination of the upper and lower bounds of the moving average range. This feature provides traders with a clearer understanding of the potential price levels that can influence market behavior. Consequently, it aids in setting more effective entry and exit points for trades.
Improved Trend Identification:
The trend variable in Stepped Moving Average helps traders identify changes in market trends more accurately. By considering the previous trend value and comparing it to the current RSI and previous bounds, Stepped Moving Average captures trend reversals with greater precision. This capability empowers traders to respond swiftly to market shifts and potentially capture more profitable trading opportunities.
Smoother Moving Averages:
Stepped Moving Average's ability to adjust the moving average range bounds based on trend changes and size parameters results in smoother moving averages. Regular RSI calculations may produce jagged or erratic results due to abrupt market movements. Stepped Moving Average mitigates this issue by dynamically adapting the range boundaries, thereby providing traders with more reliable and consistent moving average signals.
Complementary Functionality with Slow RSI:
Stepped Moving Average and Slow RSI function in harmony to provide a comprehensive trading analysis toolkit. While Stepped Moving Average refines the moving average calculation process, Slow RSI offers a more accurate representation of market strength. The combination of these two functions facilitates a deeper understanding of market dynamics and assists traders in making better-informed decisions.
What is a Discontinued Signal Line (DSL)?
Many indicators employ signal lines to more easily identify trends or desired states of the indicator. The concept of a signal line is straightforward: by comparing a value to its smoothed, slightly lagging state, one can determine the current momentum or state.
The Discontinued Signal Line builds on this fundamental idea by extending it: rather than having a single signal line, multiple lines are used based on the indicator's current value.
The "signal" line is calculated as follows:
When a specific level is crossed in the desired direction, the EMA of that value is calculated for the intended signal line.
When that level is crossed in the opposite direction, the previous "signal" line value is "inherited," becoming a sort of level.
This approach combines signal lines and levels, aiming to integrate the advantages of both methods.
In essence, DSL enhances the signal line concept by inheriting the previous signal line's value and converting it into a level.
Extras
-Alerts
-Signals
Related indicators:
Step RSI

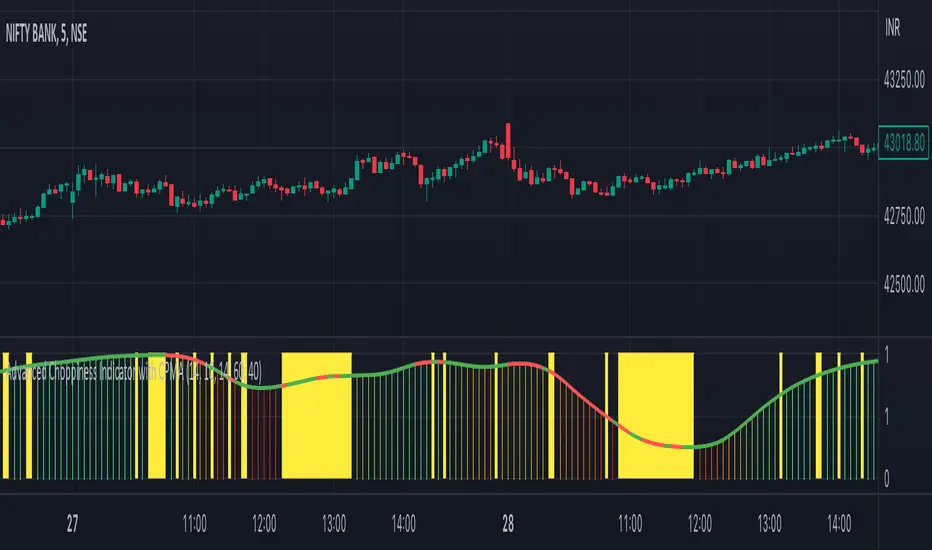
Advanced Choppiness Indicator with CPMA"The Advanced Choppiness Indicator with CPMA is a technical analysis tool designed to assist traders in identifying choppy market conditions and determining trend direction. It combines two key components: the Choppiness Index and a Custom Price Moving Average (CPMA).
The Choppiness Index is calculated using the Average True Range (ATR), which measures market volatility. It compares the ATR to the highest high and lowest low over a specified period. A higher Choppiness Index value indicates choppier market conditions, while a lower value suggests smoother and more directional price movements.
The CPMA is a custom moving average that takes into account various price types, including the close, high, low, and other combinations. It calculates the average of these price types over a specific length. The CPMA provides a smoother trend line that can help identify support and resistance levels more accurately than traditional moving averages.
When using this indicator, pay attention to the following elements:
Yellow range boxes: These indicate choppy zones, where market conditions are characterized by low momentum and erratic price action. Avoid entering trades during these periods.
Histogram bars: Green bars suggest an uptrend, while red bars indicate a downtrend. These bars are based on the CPMA and can help confirm the prevailing trend direction.
CPMA angle: The angle of the CPMA line provides further insight into the trend. A positive angle indicates an uptrend, while a negative angle suggests a downtrend.
Choppiness thresholds: The indicator includes user-defined thresholds for choppiness. Values above the high threshold indicate high choppiness, while values below the low threshold suggest low choppiness.
Trade decisions: Consider the information provided by the indicator to make informed trading decisions. Avoid trading during choppy zones and consider entering trades in the direction of the prevailing trend.
Remember that the indicator's parameters, such as ATR length and CPMA length, can be adjusted to suit your trading preferences and timeframe. However, it's important to use this indicator in conjunction with other technical analysis tools and your trading strategy for comprehensive market analysis."
By combining the Choppiness Index, CPMA, and other visual cues, this indicator aims to help traders identify suitable trading conditions and make more informed decisions based on market trends and volatility.
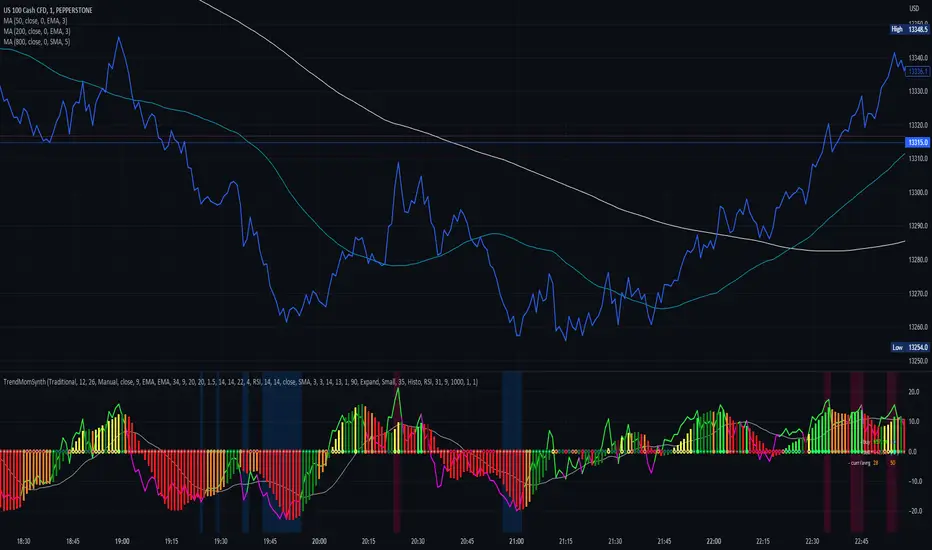
Trend Momentum SynthesizerBy analyzing the MACD (Moving Average Convergence Divergence) and Squeeze Momentum indicators, this indicator helps identify potential bullish, bearish, or undecided market conditions.
The algorithm within considers the positions of the MACD and Squeeze Momentum indicators to determine the overall market sentiment. When the indicators align and indicate a bullish market condition, the indicator's plot color will be either dark green, green, yellow, or lime, indicating a potential bullish trend. Conversely, if the indicators align and indicate a bearish market condition, the plot color will be maroon or red, denoting a potential bearish trend. When the indicators are inconclusive, the plot color will be orange, suggesting an undecided market.
The ADX is an addon component of this indicator, helping to assess the strength of a trend. By analyzing the ADX, the indicator determines whether a trend is strong enough, providing additional confirmation for potential trade signals. The ADX smoothing and DI (Directional Index) length parameters can be customized to suit individual trading preferences.
By combining these indicators, the algorithm provides traders with a comprehensive view of the market, helping them make informed trading decisions. It aims to assist traders in identifying potential market opportunities and aligns with the objective of maximizing trading performance.
How to use the indicator:
Note: I used back-testing for fine tuning do not base your trades on signals from the testing framework.
FTR, WMA, OBV & RSI StrategyThis Pine Script code is a trading strategy that uses several indicators such as Fisher Transform (FTR), On-Balance Volume (OBV), Relative Strength Index (RSI), and a Weighted Moving Average (WMA). The strategy generates buy and sell signals based on the conditions of these indicators.
The Fisher Transform function is a technical indicator that uses past prices to determine whether the current market is bullish or bearish. The Fisher Transform function takes in four multipliers and a length parameter. The four multipliers are used to calculate four Fisher Transform values, and these values are used in combination to determine if the market is bullish or bearish.
The Weighted Moving Average (WMA) is a technical indicator that smooths out the price data by giving more weight to the most recent prices.
The Relative Strength Index (RSI) is a momentum indicator that measures the strength of a security's price action. The RSI ranges from 0 to 100 and is typically used to identify overbought or oversold conditions in the market.
The On-Balance Volume (OBV) is a technical indicator that uses volume to predict changes in the stock price. OBV values are calculated by adding volume on up days and subtracting volume on down days.
The strategy uses the Fisher Transform values to generate buy and sell signals when all four Fisher Transform values change color. It also uses the WMA to determine if the trend is bullish or bearish, the OBV to confirm the trend, and the RSI to filter out false signals.
The red and green triangular arrows attempt to indicate that the trend is bullish or bearish and should not be traded against in the opposite direction. This helps with my FOMO :)
All comments welcome!
The script should not be relied upon alone, there are no stop loss or take profit filters. The best results have been back-tested using Tradingview on the 45m - 3 hour timeframes.

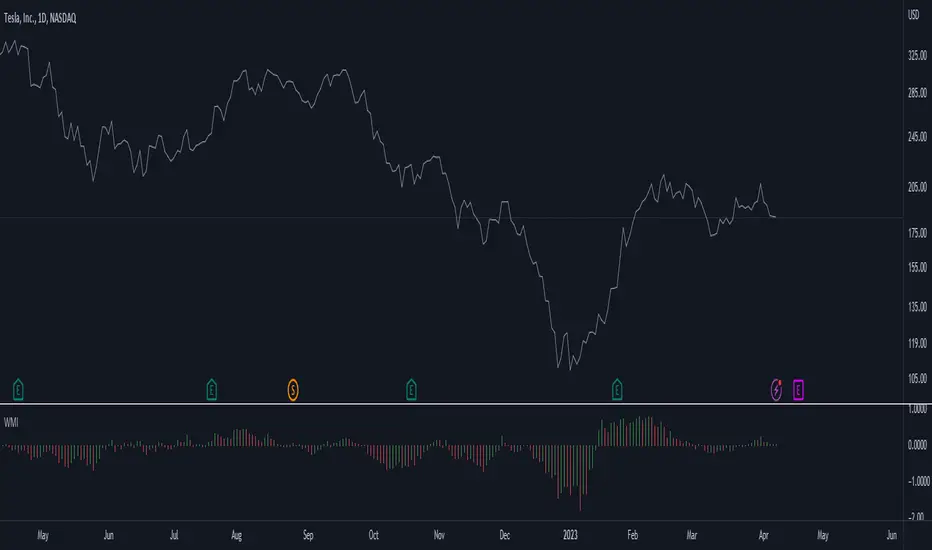
Weighted Momentum and Volatility Indicator (WMI)The Weighted Momentum and Volatility Indicator (WMI) is a composite technical analysis tool that combines momentum and volatility to identify potential trend changes in the underlying asset.
The WMI is displayed as an histogram that oscillates around a zero line, with increasing bars indicating a bullish trend and decreasing bars indicating a bearish trend.
The WMI is calculated by combining the Rate of Change (ROC) and Average True Range (ATR) indicators.
The ROC measures the percentage change in price over a set period of time, while the ATR measures the volatility of the asset over the same period.
The WMI is calculated by multiplying the normalized values of the ROC and ATR indicators, with the normalization process being used to adjust the values to a scale between 0 and 1.
Traders and investors can use the WMI to identify potential trend changes in the underlying asset, with increasing bars indicating a bullish trend and decreasing bars indicating a bearish trend.
The WMI can be used in conjunction with other technical analysis tools to develop a comprehensive trading strategy.
Do not hesitate to let me know your comments if you see any improvements to be made :)
Stochastic Momentum Index (SMI) Refurbished▮Introduction
Stochastic Momentum Index (SMI) Indicator is a technical indicator used in technical analysis of stocks and other financial instruments.
It was developed by William Blau in 1993 and is considered to be a momentum indicator that can help identify trend reversal points.
Basically, it's a combination of the True Strength Index with a signal line to help identify turning points in the market.
SMI uses the stochastic formula to compare the current closing price of an asset with the maximum and minimum price range over a specific period.
He then compares this ratio to a short-term moving average to create an indicator that oscillates between -100 and +100.
When the SMI is above 0, it is considered positive, indicating that the current price is above the short-term moving average.
When it is below 0, it is considered negative, indicating that the current price is below the short-term moving average.
Traders use the SMI to identify potential trend reversal points.
When the indicator reaches an extreme level above +40 or below -40, a trend reversal is possible.
Furthermore, traders also watch for divergences between the SMI and the asset price to identify potential trading opportunities.
It is important to remember that the SMI is a technical indicator and as such should be used in conjunction with other technical analysis tools to get a complete picture of the market situation.
▮ Improvements
The following features were added:
1. 7 color themes, for TSI, Signal and Histogram.
2. Possibility to customize moving average type for TSI/Signal.
3. Dynamic Zones.
4. Crossing Alerts.
5. Alert points on specific ranges.
5. Coloring of bars according to TSI/Signal/Histogram.
▮ Themes
Examples:
▮ About Dynamic Zones
'Most indicators use a fixed zone for buy and sell signals.
Here's a concept based on zones that are responsive to the past levels of the indicator.'
The concept of Dynamic Zones was described by Leo Zamansky ( Ph .D.) and David Stendahl, in the magazine of Stocks & Commodities V15:7 (306-310).
Basically, a statistical calculation is made to define the extreme levels, delimiting a possible overbought/oversold region.
Given user-defined probabilities, the percentile is calculated using the method of Nearest Rank.
It is calculated by taking the difference between the data point and the number of data points below it, then dividing by the total number of data points in the set.
The result is expressed as a percentage.
This provides a measure of how a particular value compares to other values in a data set, identifying outliers or values that are significantly higher or lower than the rest of the data.
▮ What to look for
1. Divergences/weakening of a trend/reversal:
2. Supports, resistances, pullbacks:
3. Overbought/Oversold Points:
▮ Thanks and Credits
- TradingView and PineCoders: for SMI and Moving Averages
- allanster: for Dynamic Zones
