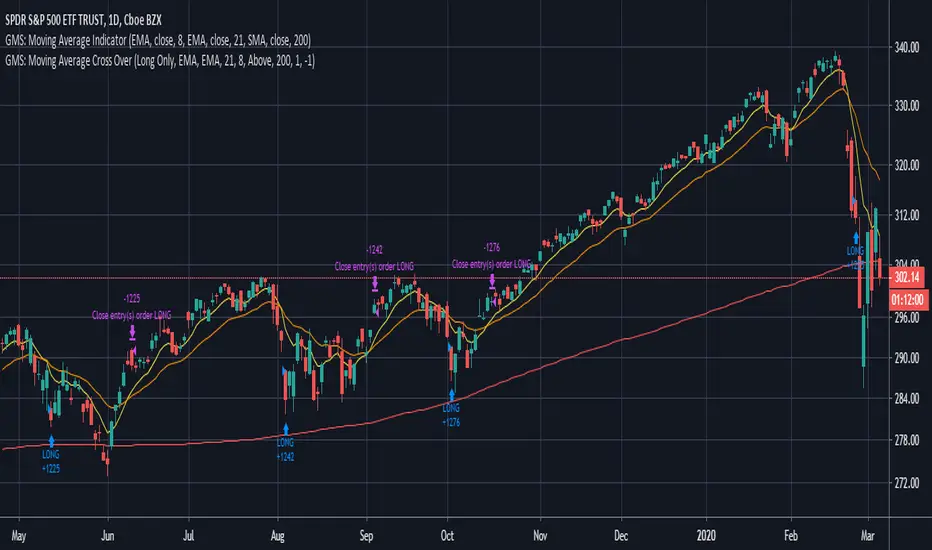
GMS: Moving Average Crossover StrategyThis is a moving average crossover system built the way I would want it to be.
- The moving averages included are SMA, EMA, WMA, VWMA.
- You can select either for the first moving average or the second moving average.
- You can also select to see the Long trades, Short trades, or both at the same time.
- There is also a simple moving average trend filter. When this is selected, it only applies to the entries of a trade and not the exit. There are situations where the entry is above the trend filter and the exit is below.
The source code should be open so feel free to adapt it, make it more efficient, or take some part for your own project!
I hope it helps,
Andre
Cerca negli script per "moving average crossover"
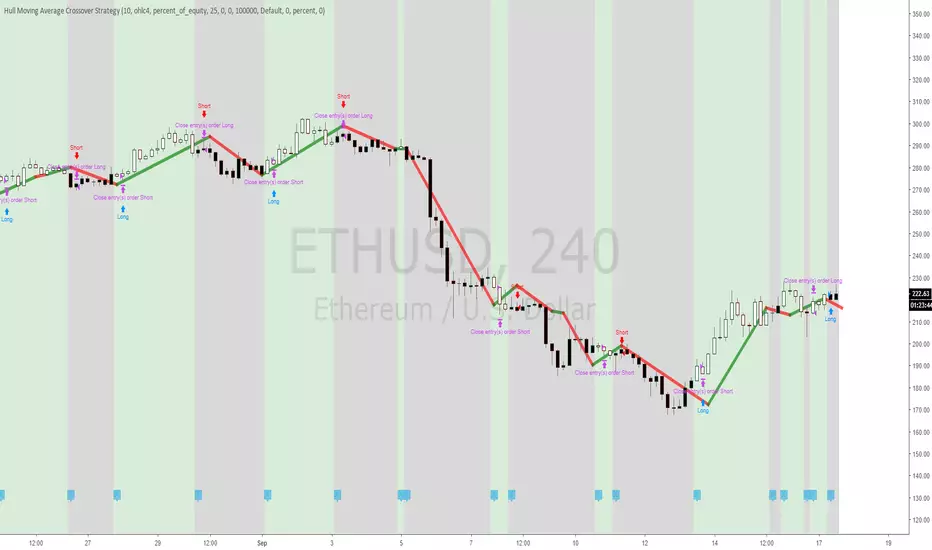
Hull Moving Average Crossover StrategyHull Moving Average Crossover, the Strategy version, so people can easily test the profitability of it.
Use Indicator version for use with Alerts
Jurik Moving Average Crossover Strategy [ChuckBanger]The classic moving average crossover strategy does not work well in markets that, instead of trending, tend to frequently reverse within a trading range. The lag between the actual time the market has reversed direction and when the moving average is signalling a trade, the trend is already over and the market is about to go against your position. In this environment, a more appropriate trading strategy is suggested here using an JMA Keltner Channel.
The idea is to create a channel based of support and resistance. When the market breaks out of the channel, and fails to maintain momentum. It is likely the price will fall back toward the center of the channel. This tendency can be exploited in the following manner.
In the chart above, The aqua and maroon (center line) and the blue lines are part of a channel. The middle line is a slow running JMA of the closing prices, with Length = 30 and phase = 0. The upper blue band is constructed by adding 1.5 times of 30-bar ATR (average true range) to the center JMA line and the lower blue band by deducting the same amount. There is a grey line running through the data- That is a fast running JMA with length = 5 and phase = 100 representing the price.
The red dots indicate that the the price is going back in the channel and the market is retracting from a failed upward breakout, and the green dots mark when price is retracting from a failed downward breakout. These are places where one might want to enter the trade. The orange dots indicate where price crosses the center line, a reasonable place to take profit from or even exit the trade.
The center line also shows the up or down movements if the setting is ticked. This feature is useful to use when exit a trade. For example, you enter a long position on a green dot signal and the color is maroon. You can wait for 3-5 candles (depending of markets). And if the color doesn’t change it can be an indication that the price is going lower. Here it is possible to switch to a short possible or the opposite apply if you enter on a red dot.
The parameter use in this study is for demonstrating purposes only. This is to show how you can use JMA. Do not trade with real money without thoroughly test the strategy. And always use stop-losses.


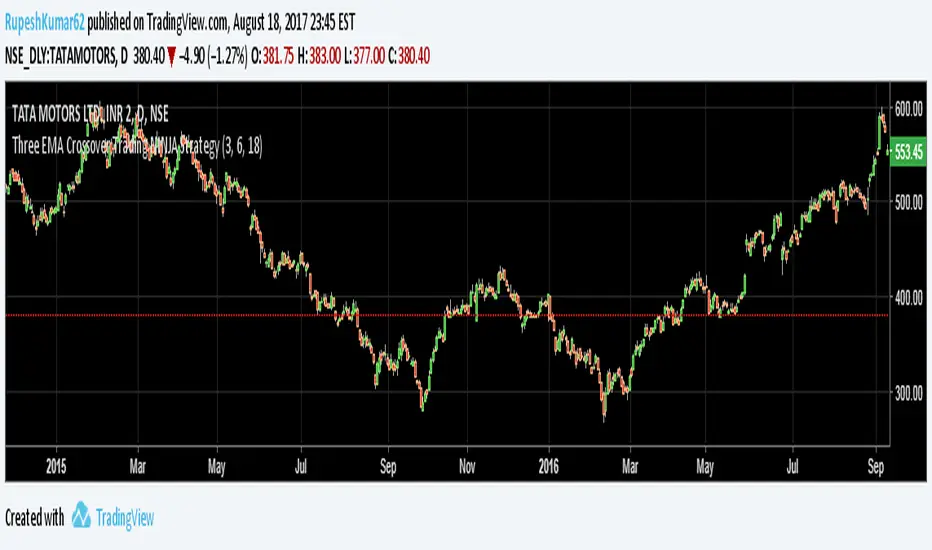
Modified 3MA cross : Modified 3 moving average crossoverModified 3MA cross : Modified 3 moving average crossover


EMA Crossover StrategyMoving average crossover systems measure drift in the market. They are great strategies for time-limited people.
So, why don't more people use them?
I think it's due to poor choice in choosing EMA lengths: Market Wizard Ed Seykota has a guideline for moving average crossovers: the slow line should be at least 3x the fast line. This removes a lot of the whipsaws inherent in moving average systems, which means greater profitability. His other piece of advice: long-only strategies are best in stock markets where there's a lot more upside potential.
Using these simple rules, we can reduce a lot of the whipsaws and low profitability trades! This strategy was made so you can see for yourself before trading.
=== HOW TO USE THIS INDICATOR ===
1) Choose your market and timeframe.
2) Choose the length.
3) Choose the multiplier.
4) Choose if the strategy is long-only or bidirectional.
Don't overthink the above! We don't know the best answers, that's why this strategy exists! We're going to test and find out.
After you find a good combination, set up an alert system with the default Exponential Moving Average indicators provided by TradingView.
=== TIPS ===
Increase the multiplier to reduce whipsaws (back and forth trades).
Increase the length to take fewer trades, decrease the length to take more trades.
Try a Long-Only strategy to see if that performs better.

[RS]Moving Average Cross System V0moving average crossover with added functions:
if you want crossover with price set ma1 length to 1, or use as dual ma with both lengths, ability to turn ma's on and off leaving the crossover signals behind, ability to chose ma mode (sma, ema, rma, wma, vwma, swma and alma), ability to chose source (open, high, low, close, hl2, hlc3 or ohlc4).

Moving Average Crossover V3 Beta basic Cross over strategy with using crossover of 3 days and 5 days moving average still in Beta Mode.


WIN1! • Crossing EMAs• (By Mesquita, v7)Moving average crossover strategy for intraday movements, especially in the continuous index (WIN1!) on the Brazilian stock exchange B³. The strategy is customizable for time windows, has a filter for trades only above the long-term average, whether only long, only short, or both, with or without stop loss.

Moving Average Crossover This indicator is based on ema 5 and ema 20, when ema 5 crosses over ema 20, the line will be green, when ema 5 crosses down it will be red
This indicator has been accompanied by a strategy so we can see the results through the strategy tester, this strategy there is only a long, I recommend using a weekly timeframe because the volatility is lower and minimal with false signals


Moving Average Crossover 0001The first strategy for my (also first) Everyday project. During the rest of 2016 I plan to create a new strategy everyday
and I give myself between 15 minutes and 2 hours to complete the idea.
The goal is to improve my knowledge of Pine Script, become a faster strategy coder, and experiment with different strategic trading ideas.
I'm new to strategies and algorithmic trading, and hoping to learn from the community, so any feedback, advice or corrections is very much welcome!
/pbergden

Easy MA SignalsEasy MA Signals
Overview
Easy MA Signals is a versatile Pine Script indicator designed to help traders visualize moving average (MA) trends, generate buy/sell signals based on crossovers or custom price levels, and enhance chart analysis with volume-based candlestick coloring. Built with flexibility in mind, it supports multiple MA types, crossover options, and customizable signal appearances, making it suitable for traders of all levels. Whether you're a day trader, swing trader, or long-term investor, this indicator provides actionable insights while keeping your charts clean and intuitive.
Configure the Settings
The indicator is divided into three input groups for ease of use:
General Settings:
Candlestick Color Scheme: Choose from 10 volume-based color schemes (e.g., Sapphire Pulse, Emerald Spark) to highlight high/low volume candles. Select “None” for TradingView’s default colors.
Moving Average Length: Set the MA period (default: 20). Adjust for faster (lower values) or slower (higher values) signals.
Moving Average Type: Choose between SMA, EMA, or WMA (default: EMA).
Show Buy/Sell Signals: Enable/disable signal plotting (default: enabled).
Moving Average Crossover: Select a crossover type (e.g., MA vs VWAP, MA vs SMA50) for signals or “None” to disable.
Volume Influence: Adjust how volume impacts candlestick colors (default: 1.2). Higher values make thresholds stricter.
Signal Appearance Settings:
Buy/Sell Signal Shape: Choose shapes like triangles, arrows, or labels for signals.
Buy/Sell Signal Position: Place signals above or below bars.
Buy/Sell Signal Color: Customize colors for better visibility (default: green for buy, red for sell).
Custom Price Alerts:
Custom Buy/Sell Alert Price: Set specific price levels for alerts (default: 0, disabled). Enter a non-zero value to enable.
Set Up Alerts
To receive notifications (e.g., sound, popup, email) when signals or custom price levels are hit:
Click the Alert button (alarm clock icon) in TradingView.
Select Easy MA Signals as the condition and choose one of the four alert types:
MA Crossover Buy Alert: Triggers on MA crossover buy signals.
MA Crossover Sell Alert: Triggers on MA crossover sell signals.
Custom Buy Alert: Triggers when price crosses above the custom buy price.
Custom Sell Alert: Triggers when price crosses below the custom sell price.
Enable Play Sound and select a sound (e.g., “Bell”).
Set the frequency (e.g., Once Per Bar Close for confirmed signals) and create the alert.
Analyze the Chart
Moving Average Line: Displays the selected MA with color changes (green for bullish, red for bearish, gray for neutral) based on price position relative to the MA.
Buy/Sell Signals: Appear as shapes or labels when crossovers or custom price levels are hit.
Candlestick Colors: If a color scheme is selected, candles change color based on volume strength (high, low, or neutral), aiding in trend confirmation.
Why Use Easy MA Signals?
Easy MA Signals is designed to simplify technical analysis while offering advanced customization. It’s ideal for traders who want:
A clear visualization of MA trends and crossovers.
Flexible signal generation based on MA crossovers or custom price levels.
Volume-enhanced candlestick coloring to identify market strength.
Easy-to-use settings with tooltips for beginners and pros alike.
This script is particularly valuable because it combines multiple features into one indicator, reducing chart clutter and providing actionable insights without overwhelming the user.
Benefits of Easy MA Signals
Highly Customizable: Supports SMA, EMA, and WMA with adjustable lengths.
Offers multiple crossover options (VWAP, SMA10, SMA20, etc.) for tailored strategies.
Custom price alerts allow precise targeting of key levels.
Volume-Based Candlestick Coloring: 10 unique color schemes highlight volume strength, helping traders confirm trends.
Adjustable volume influence ensures adaptability to different markets.
Flexible Signal Visualization: Choose from various signal shapes (triangles, arrows, labels) and positions (above/below bars).
Customizable colors improve visibility on any chart background.
Alert Integration: Built-in alert conditions for crossovers and custom prices support sound, email, and app notifications.
Easy setup for real-time trading decisions.
User-Friendly Design: Organized input groups with clear tooltips make configuration intuitive.
Suitable for beginners and advanced traders alike.
Example Use Cases
Swing Trading with MA Crossovers:
Scenario: A trader wants to trade Bitcoin (BTC/USD) on a 4-hour chart using an EMA crossover strategy.
Setup:
Set Moving Average Type to EMA, Length to 20.
Set Moving Average Crossover to “MA vs SMA50”.
Enable Show Buy/Sell Signals and choose “arrowup” for buy, “arrowdown” for sell.
Select “Emerald Spark” for candlestick colors to highlight volume surges.
Usage: Buy when the EMA20 crosses above the SMA50 (green arrow appears) and volume is high (dark green candles). Sell when the EMA20 crosses below the SMA50 (red arrow). Set alerts for real-time notifications.
Scalping with Custom Price Alerts:
Scenario: A day trader monitors Tesla (TSLA) on a 5-minute chart and wants alerts at specific support/resistance levels.
Setup:
Set Custom Buy Alert Price to 150.00 (support) and Custom Sell Alert Price to 160.00 (resistance).
Use “labelup” for buy signals and “labeldown” for sell signals.
Keep Moving Average Crossover as “None” to focus on price alerts.
Usage: Receive a sound alert and label when TSLA crosses 150.00 (buy) or 160.00 (sell). Use volume-colored candles to confirm momentum before entering trades.
When NOT to Use Easy MA Signals
High-Frequency Trading: Reason: The indicator relies on moving averages and volume, which may lag in ultra-fast markets (e.g., sub-second trades). High-frequency traders may need specialized tools with real-time tick data.
Alternative: Use order book or market depth indicators for faster execution.
Low-Volatility or Sideways Markets:
Reason: MA crossovers and custom price alerts can generate false signals in choppy, range-bound markets, leading to whipsaws.
Alternative: Use oscillators like RSI or Bollinger Bands to trade within ranges.
This indicator is tailored more towards less experienced traders. And as always, paper trade until you are comfortable with how this works if you're unfamiliar with trading! We hope you enjoy this and have great success. Thanks for your interested in Easy MA Signals!

[GrandAlgo] Moving Averages Cross LevelsMoving Averages Cross Levels
Many traders watch for moving average crossovers – such as the golden cross (50 MA crossing above 200 MA) or death cross – as signals of changing trends. However, once a crossover happens, the exact price level where it occurred often fades from view, even though that level can be an important reference point. Moving Averages Cross Levels is an indicator that keeps those crossover price levels visible on your chart, helping you track where momentum shifts occurred and how price behaves relative to those key levels.
This tool plots horizontal line segments at the price where each pair of selected moving averages crossed within a recent window of bars. Each level is labeled with the moving average lengths (for example, “21×50” for a 21/50 MA cross) and is color-coded – green for bullish crossovers (short-term MA crossing above long-term MA) and red for bearish crossunders (short-term crossing below). By visualizing these crossover levels, you can quickly identify past trend change points and use them as potential support/resistance or decision levels in your trading. Importantly, this indicator is non-repainting – once a crossover level is plotted, it remains fixed at the historical price where the cross occurred, allowing you to continually monitor that level going forward. (As with any moving average-based analysis, crossover signals are lagging, so use these levels in conjunction with other tools for confirmation.)
Key Features:
✅ Multiple Moving Averages: Track up to 7 different MAs (e.g. 5, 8, 21, 50, 64, 83, 200 by default) simultaneously. You can enable/disable each MA and set its length, allowing flexible combinations of short-term and long-term averages.
✅ Selectable MA Type: Each average can be calculated as a Simple (SMA), Exponential (EMA), Volume-Weighted (VWMA), or Smoothed (RMA) moving average, giving you flexibility to match your preferred method.
✅ Auto Crossover Detection: The script automatically detects all crosses between any enabled MA pairs, so you don’t have to specify pairs manually. Whether it’s a fast cross (5×8) or a long-term cross (50×200), every crossover within the lookback period will be identified and marked.
✅ Horizontal Level Markers: For each detected crossover, a horizontal line segment is drawn at the exact price where the crossover occurred. This makes it easy to glance at your chart and see precisely where two moving averages intersected in the recent past.
✅ Labeled and Color-Coded: Each crossover line is labeled with the two MA lengths that crossed (e.g. “50×200”) for clear identification. Colors indicate crossover direction – by default green for bullish (positive) crossovers and red for bearish (negative) crossovers – so you can tell at a glance which way the trend shifted. (You can customize these colors in the settings.)
✅ Adjustable Lookback: A “Crosses with X candles” input lets you control how far back the script looks for crossovers to plot. This prevents your chart from getting cluttered with too many old levels – for example, set X = 100 to show crossovers from roughly the last 100 bars. Older crossover lines beyond this lookback window will automatically clear off the chart.
✅ Optional MA Plots: You can toggle the display of each moving average line on the chart. This means you can either view just the crossover levels alone for a clean look, or also overlay the MA curves themselves for additional context (to see how price and MAs were moving around the crossover).
✅ No Repainting or Hindsight Bias: Once a crossover level is plotted, it stays at that fixed price. The indicator doesn’t move levels around after the fact – each line is a true historical event marker. This allows you to backtest visually: see how price acted after the crossover by observing if it retested or respected that level later.
How It Works:
1️⃣ Add to Chart & Configure – Simply add the indicator to your chart. In the settings, choose which moving averages you want to include and set their lengths. For example, you might enable 21, 50, 200 to focus on medium and long-term crosses (including the golden cross), or turn on shorter MAs like 5 and 8 for quick momentum shifts. Adjust the lookback (number of bars to scan for crosses) if needed.
2️⃣ Visualization – The script continuously checks the latest X bars for any points where one MA crossed above or below another. Whenever a crossover is found, it calculates the exact price level at which the two moving averages intersected. On the last bar of your chart, it will draw a horizontal line segment extending from the crossover bar to the current bar at that price level, and place a label to the right of the line with the MA lengths. Green lines/labels signify bullish crossovers (where the first MA crossed above the second), and red lines indicate bearish crossunders.
3️⃣ On Your Chart – You will see these labeled levels aligned with the price scale. For example, if a 50 MA crossed above a 200 MA (bullish) 50 bars ago at price $100, there will be a green “50×200” line at $100 extending to the present, showing you exactly where that golden cross happened. You might notice price pulling back near that level and bouncing, or if price falls back through it, it could signal a failed crossover. The indicator updates in real-time: if a new crossover happens on the latest bar, a new line and label will instantly appear, and if any old cross moves out of the lookback range, its line is removed to keep the chart focused.
4️⃣ Customization – You can fine-tune the appearance: toggle any MA’s visibility, change line colors or label styles, and modify the lookback length to suit different timeframes. For instance, on a 1-hour chart you might use a lookback of 500 bars to see a few weeks of cross history, whereas on a daily chart 100 bars (about 4–5 months) may be sufficient. Adjust these settings based on how many crossover levels you find useful to display.
Ideal for Traders Who:
Use MA Crossovers in Strategy: If your strategy involves moving average crossovers (for trend confirmation or entry/exit signals), this indicator provides an extra layer of insight by keeping the price of those crossover events in sight. For example, trend-followers can watch if price stays above a bullish crossover level as a sign of trend strength, or falls below it as a sign of weakness.
Identify Support/Resistance from MA Events: Crossover levels often coincide with pivot points in market sentiment. A crossover can act like a regime change – the level where it happened may turn into support or resistance. This tool helps you mark those potential S/R levels automatically. Rather than manually noting where a golden cross occurred, you’ll have it highlighted, which can be useful for setting stop-losses (e.g. below the crossover price in a bullish scenario) or profit targets.
Track Multiple Averages at Once: Instead of focusing on just one pair of moving averages, you might be interested in the interaction of several (short, medium, and long-term trends). This indicator caters to that by plotting all relevant crossovers among your chosen MAs. It’s great for multi-timeframe thinkers as well – e.g. you could apply it on a higher timeframe chart to mark major cross levels, then drill down to lower timeframes knowing those key prices.
Value Clean Visualization: There are no flashing signals or arrows – just simple lines and labels that enhance your chart’s storytelling. It’s ideal if you prefer to make trading decisions based on understanding price interaction with technical levels rather than following automatic trade calls. Moving Averages Cross Levels gives you information to act on, without imposing any bias or strategy – you interpret the crossover levels in the context of your own trading system.

MA RSI MACD Signal SuiteThis Pine Script™ is designed for use in Trading View and generates trading signals based on moving average (MA) crossovers, RSI (Relative Strength Index) signals, and MACD (Moving Average Convergence Divergence) indicators. It provides visual markers on the chart and can be configured to suit various trading strategies.
1. Indicator Overview
The indicator includes signals for:
Moving Averages (MA): It tracks crossovers between different types of moving averages.
RSI: Signals based on RSI crossing certain levels or its signal line.
MACD: Buy and sell signals generated by MACD crossovers.
2. Inputs and Customization
Moving Averages (MAs):
You can customize up to 6 moving averages with different types, lengths, and colors.
MA Type: Choose from different types of moving averages:
SMA (Simple Moving Average)
EMA (Exponential Moving Average)
HMA (Hull Moving Average)
SMMA (RMA) (Smoothed Moving Average)
WMA (Weighted Moving Average)
VWMA (Volume Weighted Moving Average)
T3, DEMA, TEMA
Source: Select the price to base the MA on (e.g., close, open, high, low).
Length: Define the number of periods for each moving average.
Examples:
MA1: Exponential Moving Average (EMA) with a period of 9
MA2: Exponential Moving Average (EMA) with a period of 21
RSI Settings:
RSI is calculated based on a user-defined period and is used to identify potential overbought or oversold conditions.
RSI Length: Lookback period for RSI (default 14).
Overbought Level: Defines the overbought threshold for RSI (default 70).
Oversold Level: Defines the oversold threshold for RSI (default 30).
You can also adjust the smoothing for the RSI signal line and customize when to trigger buy and sell signals based on the RSI crossing these levels.
MACD Settings:
MACD is used for identifying changes in momentum and trends.
Fast Length: The period for the fast moving average (default 12).
Slow Length: The period for the slow moving average (default 26).
Signal Length: The period for the signal line (default 9).
Smoothing Method: Choose between SMA or EMA for both the MACD and the signal line.
3. Signal Logic
Moving Average (MA) Crossover Signals:
Crossover: A bullish signal is generated when a fast MA crosses above a slow MA.
Crossunder: A bearish signal is generated when a fast MA crosses below a slow MA.
The crossovers are plotted with distinct colors, and the chart will display markers for these crossover events.
RSI Signals:
Oversold Crossover: A bullish signal when RSI crosses over its signal line below the oversold level (30).
Overbought Crossunder: A bearish signal when RSI crosses under its signal line above the overbought level (70).
RSI signals are divided into:
Aggressive (Early) Entries: Signals when RSI is crossing the oversold/overbought levels.
Conservative Entries: Signals when RSI confirms a reversal after crossing these levels.
MACD Signals:
Buy Signal: Generated when the MACD line crosses above the signal line (bullish crossover).
Sell Signal: Generated when the MACD line crosses below the signal line (bearish crossunder).
Additionally, the MACD histogram is used to identify momentum shifts:
Rising to Falling Histogram: Alerts when the MACD histogram switches from rising to falling.
Falling to Rising Histogram: Alerts when the MACD histogram switches from falling to rising.
4. Visuals and Alerts
Plotting:
The script plots the following on the price chart:
Moving Averages (MA): The selected MAs are plotted as lines.
Buy/Sell Shapes: Triangular markers are displayed for buy and sell signals generated by RSI and MACD.
Crossover and Crossunder Markers: Crosses are shown when two MAs crossover or crossunder.
Alerts:
Alerts can be configured based on the following conditions:
RSI Signals: Alerts for oversold or overbought crossover and crossunder events.
MACD Signals: Alerts for MACD line crossovers or momentum shifts in the MACD histogram.
Alerts are triggered when specific conditions are met, such as:
RSI crosses over or under the oversold/overbought levels.
MACD crosses the signal line.
Changes in the MACD histogram.
5. Example Usage
1. Trend Reversal Setup:
Buy Signal: Use the RSI oversold crossover and MACD bullish crossover to identify potential entry points in a downtrend.
Sell Signal: Use the RSI overbought crossunder and MACD bearish crossunder to identify potential exit points or short entries in an uptrend.
2. Momentum Strategy:
Combine MACD and RSI signals to identify the strength of a trend. Use MACD histogram analysis and RSI levels for confirmation.
3. Moving Average Crossover Strategy:
Focus on specific MA crossovers, such as the 9-period EMA crossing above the 21-period EMA, for buy signals. When a longer-term MA (e.g., 50-period) crosses a shorter-term MA, it may indicate a strong trend change.
6. Alerts Conditions
The script includes several alert conditions, which can be triggered and customized based on the user’s preferences:
RSI Oversold Crossover: Alerts when RSI crosses over the signal line below the oversold level (30).
RSI Overbought Crossunder: Alerts when RSI crosses under the signal line above the overbought level (70).
MACD Buy/Sell Crossover: Alerts when the MACD line crosses the signal line for a buy or sell signal.
7. Conclusion
This script is highly customizable and can be adjusted to suit different trading strategies. By combining MAs, RSI, and MACD, traders can gain multiple perspectives on the market, enhancing their ability to identify potential buy and sell opportunities.

Malama's big MACDPurpose: Malama's Big MACD is a multi-faceted Pine Script indicator designed for traders on short timeframes (1-5 minute charts) to identify high-probability trading opportunities. It combines a Stochastic Price Predictor (SPP) with a comprehensive set of technical indicators, including MACD, RSI, moving average crossovers, ATR, volume spikes, and a custom JKH RSI, to generate robust buy and sell signals. The indicator aims to solve the problem of filtering out market noise in fast-moving markets by integrating probability-based predictions with traditional technical analysis, providing traders with clear entry/exit signals, trend visualization, and risk management levels.
Originality and Usefulness
This script is a unique mashup of a Stochastic Price Predictor (SPP) and a comprehensive indicator suite, tailored for short-term trading. The SPP uses a Monte Carlo simulation combined with ATR and Stochastic RSI to forecast price movements, while the comprehensive indicator suite leverages MACD crossovers, RSI overbought/oversold conditions, moving average crossovers, volume spikes, and a custom JKH RSI for confirmation. Unlike standalone MACD or RSI indicators available in TradingView’s public library, this script’s originality lies in its hybrid approach, blending probabilistic forecasting with multiple confirmatory signals to enhance reliability. The integration of user-defined sentiment input and customizable risk management levels further differentiates it from generic open-source alternatives, making it particularly useful for scalpers and day traders seeking precise, actionable signals.
How It Works
The script operates in two primary modules: the Stochastic Price Predictor (SPP) and the Comprehensive Indicator Suite, which work together to generate and confirm trading signals. Signal strength is calculated to quantify the confidence of bullish or bearish conditions.
Stochastic Price Predictor (SPP):
Core Logic: The SPP forecasts price movements using a Monte Carlo simulation based on historical returns, ATR-based volatility, and Stochastic RSI filtering. It calculates the probability of price reaching a user-defined target move (default: 0.3%) within a specified forecast horizon (default: 3 bars).
Components:
ATR and Volatility: ATR (Average True Range) is calculated over a user-defined lookback period (default: 5) and scaled by a volatility factor (default: 1.5) to estimate price volatility. A volatility ratio (current volatility vs. average) filters out signals during extreme volatility (>2x average).
Stochastic RSI: A 7-period RSI is smoothed into a Stochastic RSI (5-period stochastic, 2-period SMA) to identify overbought (>85) or oversold (<15) conditions, preventing signals in extreme market states.
Monte Carlo Simulation: 30 price paths are simulated using a geometric Brownian motion model, incorporating drift (based on weighted moving average of returns) and volatility shocks. The simulation estimates the probability of price reaching the target move up or down.
Signal Generation: A buy signal is triggered if the probability of an upward move exceeds the confidence threshold (default: 65%) and the market is not overbought, with volatility within limits. A sell signal is triggered similarly for downward moves.
Purpose: The SPP provides a probabilistic framework to anticipate short-term price movements, reducing reliance on lagging indicators.
Comprehensive Indicator Suite:
Core Logic: This module combines multiple technical indicators to confirm SPP signals and generate independent signals based on momentum, trend, and volume.
Components:
MACD: Uses fast (5-period) and slow (13-period) EMAs to calculate the MACD line, smoothed by a 5-period signal line. A crossover above a threshold (default: 0.0001) indicates bullish momentum, while a crossunder signals bearish momentum.
RSI: A 14-period RSI identifies overbought (>70) or oversold (<30) conditions to filter signals.
Moving Average Crossovers: Fast (5-period) and slow (20-period) EMAs determine trend direction. A bullish crossover (fast > slow) supports buy signals, while a bearish crossover (fast < slow) supports sell signals.
Volume Spikes: Volume exceeding 2x the 50-period average signals significant market activity, enhancing signal reliability.
JKH RSI: A fast 3-period RSI with custom overbought (>80) and oversold (<20) levels provides additional confirmation, reducing false signals in choppy markets.
Sentiment Input: A user-defined sentiment score (-1 to 1) adjusts signal strength, allowing traders to incorporate external market bias (e.g., news or fundamentals).
Signal Generation: A buy signal requires a bullish MACD crossover, RSI oversold, bullish MA crossover, non-overbought JKH RSI, and neutral/positive sentiment. A sell signal requires the opposite conditions.
Signal Strength Calculation:
Logic: Combines SPP probability, RSI deviation, and MACD strength, weighted at 50%, 30%, and 20%, respectively. Sentiment input scales the final strength (0–100).
Formula:
Bullish strength = min(100, (50 * |prob_up - prob_down| / 100 + 30 * |RSI - 50| / 50 + 20 * |MACD_line| / (0.1 * ATR)) * (1 + max(0, sentiment)))
Bearish strength is calculated similarly, using the absolute negative sentiment.
Purpose: Quantifies signal confidence, helping traders prioritize high-probability setups.
Strategy Results and Risk Management
While the script is primarily an indicator, it provides implied trading signals that assume realistic trading conditions:
Assumptions: Signals are designed for short-term trading (1-5 minute charts) with a minimum of 100 trades for statistical significance. The script assumes typical commission (e.g., 0.1% per trade) and slippage (e.g., 0.05%) for liquid markets. Risk per trade is implicitly capped via ATR-based stop-loss levels (2x ATR below/above entry for buy/sell).
Default Settings:
Lookback (5), volatility factor (1.5), and forecast horizon (3) are optimized for short timeframes.
ATR-based stop-loss and profit target levels (2x ATR) provide a risk-reward ratio of approximately 1:1.
Confidence threshold (65%) balances signal frequency and reliability.
Customization: Traders can adjust the ATR multiplier for stop-loss/profit targets or modify the confidence threshold to increase/decrease signal frequency. Lowering the target move (e.g., to 0.2%) or shortening the forecast horizon (e.g., to 2 bars) can tighten risk parameters for scalping.
Guidance: Traders should backtest signals on their specific asset and timeframe, ensuring sufficient trade volume (>100 trades) and incorporating their broker’s commission/slippage. Risk should be limited to 5–10% of equity per trade, adjustable via ATR multiplier or position sizing outside the script.
User Settings and Customization
The script offers extensive user inputs, organized into three groups:
Stochastic Price Predictor Settings:
Lookback Period (default: 5): Controls the period for ATR and returns calculation. Shorter periods increase sensitivity.
Volatility Factor (default: 1.5): Scales ATR for volatility shocks in the Monte Carlo simulation.
Confidence Threshold (default: 65%): Sets the minimum probability for SPP signals.
Stoch RSI Overbought/Oversold Levels (default: 85/15): Filters signals in extreme conditions.
Forecast Horizon (default: 3): Number of bars for price prediction.
Target Move (default: 0.3%): Expected price movement for probability calculation.
Show Predicted Range (default: false): Toggles visibility of the 25th–75th percentile price range.
Comprehensive Indicator Settings:
RSI Length (default: 14), Overbought (70), Oversold (30): Standard RSI parameters.
ATR Length (default: 14): Period for ATR calculation.
Volume Spike Multiplier (default: 2.0): Threshold for detecting volume spikes.
Sentiment Input (default: 0.0, range: -1 to 1): Scales signal strength based on external bias.
MACD Fast/Slow/Signal Lengths (default: 5/13/5), Crossover Threshold (0.0001): Controls MACD sensitivity.
MA Fast/Slow Lengths (default: 5/20): Defines trend direction.
JKH RSI Length (default: 3), Overbought (80), Oversold (20): Fast RSI for confirmation.
Visual Settings:
Show SPP Signals (default: true): Displays SPP buy/sell labels.
Show Comp Signals (default: true): Displays comprehensive indicator signals.
Highlight Volume Spikes (default: true): Highlights bars with significant volume.
Show ATR Levels (default: true): Plots stop-loss and profit-target lines.
Impact: Adjusting lookback periods or thresholds affects signal frequency and sensitivity. For example, lowering the confidence threshold increases signals but may reduce accuracy, while increasing the volatility factor amplifies price path variability.
Visualizations and Chart Setup
The script plots clear, relevant elements on the chart to aid decision-making:
Trend Line: Plots the close price, colored green (bullish, fast MA > slow MA), red (bearish), or orange (neutral).
SPP Signals: Green "BUY (SPP)" labels below bars and red "SELL (SPP)" labels above bars when conditions are met.
Predicted Range: Optional blue step lines showing the 25th–75th percentile price range from the Monte Carlo simulation, with a semi-transparent fill.
Comprehensive Signals:
Blue upward triangles for bullish MACD crossovers, orange downward triangles for bearish crossovers.
Green circles above bars for RSI overbought, red circles below for oversold.
Green "BUY (Comp)" labels (offset by 1x ATR below) and red "SELL (Comp)" labels (offset by 1x ATR above) for comprehensive signals.
Green upward triangles for bullish MA crossovers, red downward triangles for bearish crossovers.
Volume Spikes: Yellow background highlights bars with volume >2x the 50-period average.
ATR Levels: Purple dotted lines for stop-loss (close - 2x ATR) and profit target (close + 2x ATR).
Moving Averages: Fast MA (blue, 5-period) and slow MA (red, 20-period) for trend reference.
Clarity: Only relevant elements are plotted, ensuring traders can quickly identify trends, signals, and risk levels without clutter.
