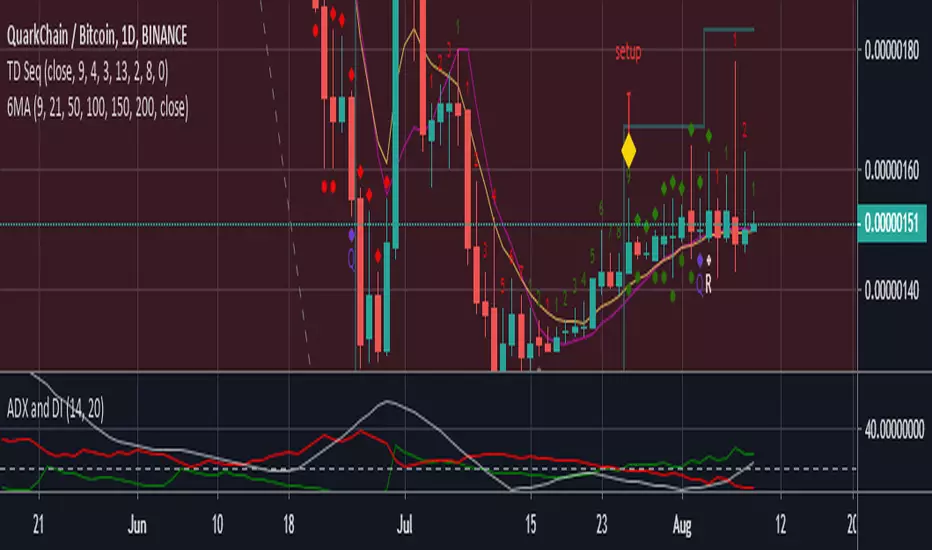
Cerca negli script per "moving averages"


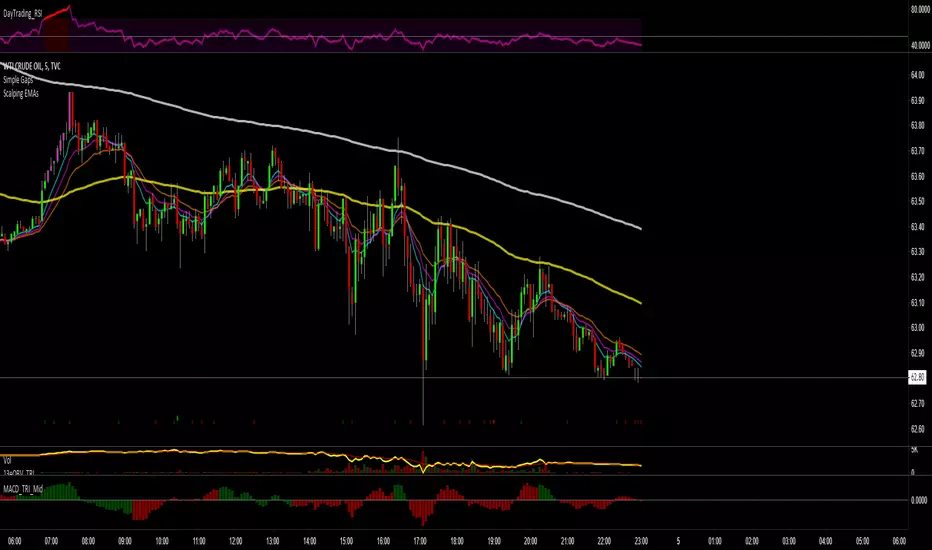
Scalping EMAs for ForexMoving averages for 5m time frame. The 96 and 252 are the 8 and 21 on 1h
Inspired by this simple scalping strategy
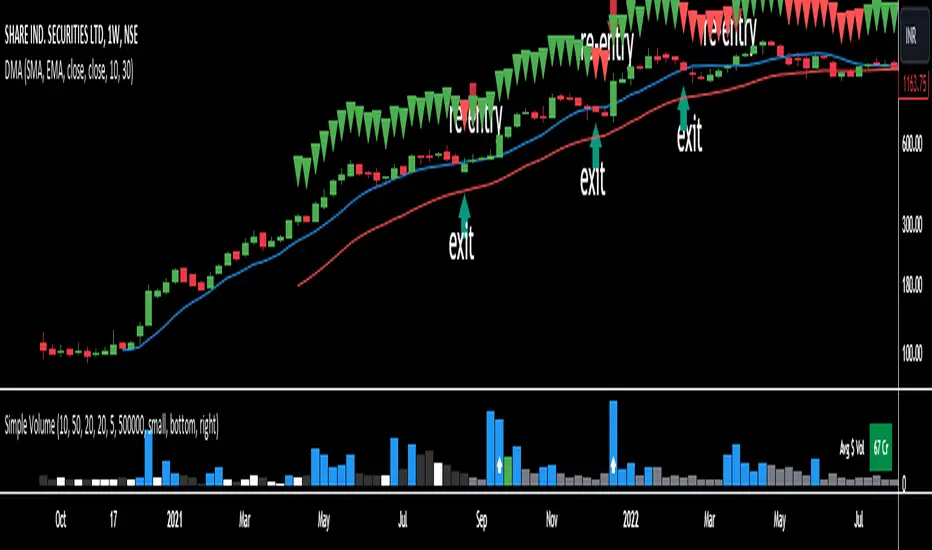
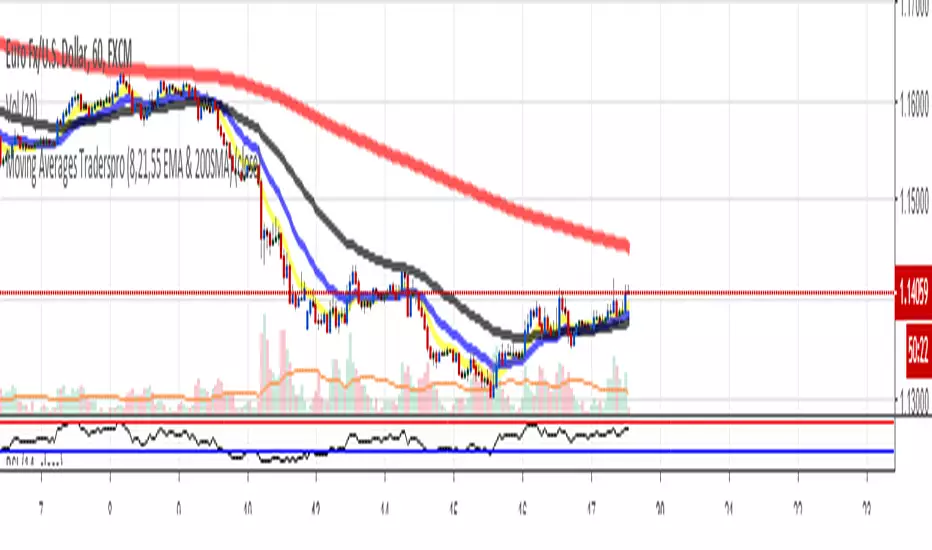
Moving Averages & Pivot Points Traderspro (8,21,55 EMA & 200SMA)For trend continuation strategy adding daily, weekly, montly and yearly pivot points


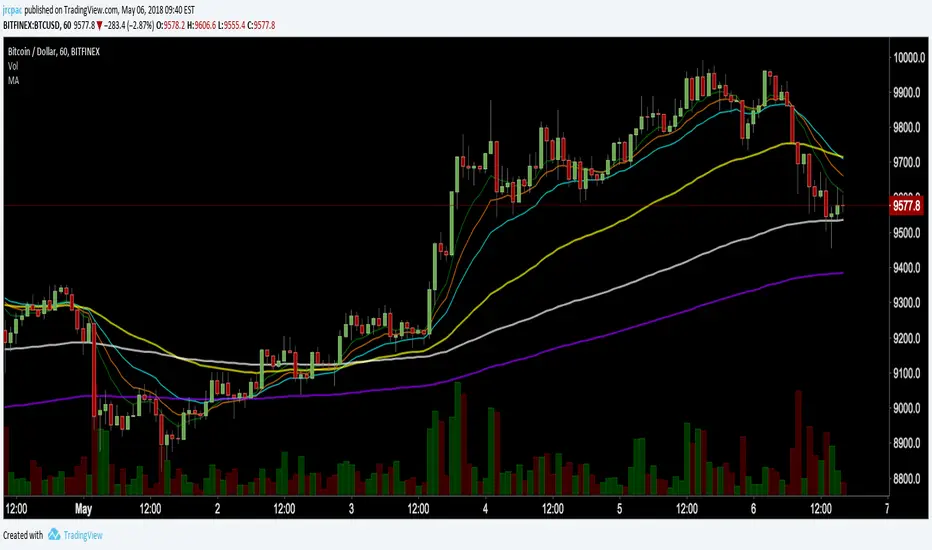
Moving Averages (10, 55, 100 EMAs, 200 SMA close)10, 55, 100 EMAs, 200 SMA close. Increasing line stroke, standard colors.


Moving Averages, input with options sampleA test of Pine Script V3. Had to Remove TEMA and DEMA as not working for some reason. Need to find a work around.


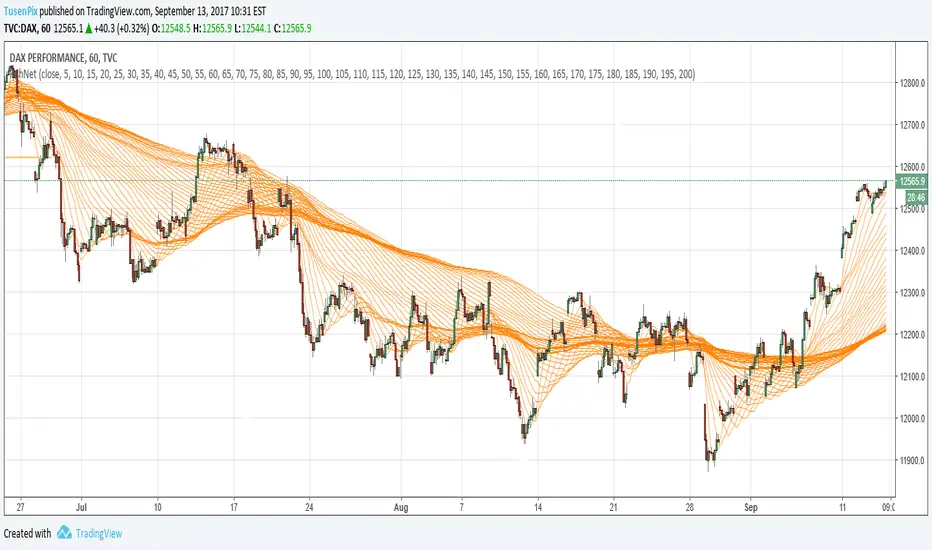
FishNet SMAMoving averages 1-200 that create this FishNet pattern. Works well on all timeframes and together they form resistens and support levels.

Multi-Moving Average Buy/Sell IndicatorThis Multi-Moving Average Buy/Sell Indicator is a powerful and customizable tool designed to help traders identify potential buy and sell signals based on the interaction between price and multiple moving averages. Whether you're a day trader, swing trader, or long-term investor, this indicator provides clear visual cues and alerts to help you make informed trading decisions.
Key Features
1. Multiple Moving Averages
The indicator calculates four key moving averages:
9-period MA
20-period MA
50-period MA
180-period MA
You can choose the type of moving average:
SMA (Simple Moving Average)
EMA (Exponential Moving Average)
WMA (Weighted Moving Average)
2. Custom Timeframe
Select a custom timeframe from a user-friendly dropdown menu:
1 Minute
5 Minutes
15 Minutes
30 Minutes
1 Hour
4 Hours
Daily
Weekly
The indicator dynamically adjusts to the selected timeframe, making it suitable for all trading styles.
3. Buy/Sell Signals
Buy Signal: Triggered when the price crosses above any of the moving averages.
Sell Signal: Triggered when the price crosses below any of the moving averages.
Signals are displayed as labels on the chart:
Green "BUY" Label: Below the bar when a buy signal is triggered.
Red "SELL" Label: Above the bar when a sell signal is triggered.
4. Visualization
Toggle the visibility of all moving averages using the showAllMAs input.
Moving averages are plotted with distinct colors for easy identification:
9 MA: Blue
20 MA: Orange
50 MA: Purple
180 MA: Teal
5. Alerts
The indicator generates alerts for buy and sell signals, which can be used for notifications or automated trading.
How to Use
Add the Indicator:
Open TradingView and go to the Pine Script Editor.
Copy and paste the script into the editor.
Click Add to Chart.
Configure Inputs:
maType: Choose the type of moving average (SMA, EMA, WMA).
timeframe: Select a custom timeframe (e.g., "1 Minute", "Daily").
showSignals: Toggle to show or hide buy/sell signals.
showAllMAs: Toggle to show or hide all moving averages.
Interpret the Signals:
Look for green "BUY" labels below the bars for potential buy opportunities.
Look for red "SELL" labels above the bars for potential sell opportunities.
Set Alerts:
Use the built-in alert system to get notified when buy or sell signals are triggered.
Example Use Cases
Day Trading
Use a 1-minute or 5-minute timeframe with an EMA for quick signals.
Example Inputs:
maType = "EMA"
timeframe = "5 Minutes"
showAllMAs = true
Swing Trading
Use a daily timeframe with an SMA for longer-term signals.
Example Inputs:
maType = "SMA"
timeframe = "Daily"
showAllMAs = false
Why Use This Indicator?
Versatility: Suitable for all trading styles and timeframes.
Customization: Choose your preferred moving average type and timeframe.
Clear Signals: Easy-to-read buy/sell labels and moving averages.
Alerts: Never miss a trading opportunity with built-in alerts.
Limitations
False Signals:
The indicator may generate false signals in choppy or sideways markets. Always combine it with other tools (e.g., RSI, volume analysis) for better accuracy.
Timeframe Dependency:
The effectiveness of the signals depends on the selected timeframe. Shorter timeframes may produce more signals but with higher noise.
No Backtesting:
The script does not include backtesting functionality. Test the strategy manually on historical data.
Customization Options
Add More Moving Averages: Modify the script to include additional moving averages (e.g., 200 MA).
Change Signal Logic: Adjust the conditions for buy/sell signals (e.g., require confirmation from multiple moving averages).
Add Alerts for Specific MAs: Create separate alerts for signals based on specific moving averages (e.g., only 9 MA or 50 MA).

Multiple MAs Signals with RSI MA Filter & Signal About the Script
The "Multiple Moving Averages Signals with RSI MA Filter and Golden Signals" script is a comprehensive trading tool designed to provide traders with detailed insights and actionable signals based on multiple moving averages and RSI (Relative Strength Index). This script combines traditional moving average crossovers with RSI filtering to enhance the accuracy of trading signals and includes "golden" signals to highlight significant long-term trend changes.
This script integrates several technical indicators and concepts to create a robust and versatile trading tool. Here's why this combination is both original and useful:
1. Multiple Moving Averages:
- Why Use Multiple MAs: Different types of moving averages (SMA, EMA, SMMA, WMA, VWMA, Hull) offer unique perspectives on price trends and volatility. Combining them allows traders to capture a more comprehensive view of the market.
- Purpose: Using multiple moving averages helps identify trend direction, support/resistance levels, and potential reversal points.
2. RSI MA Filter:
- Why Use RSI: RSI is a momentum oscillator that measures the speed and change of price movements. It is used to identify overbought or oversold conditions in a market.
- Purpose: Filtering signals with RSI moving averages ensures that trades are taken in line with the prevailing momentum, reducing the likelihood of false signals.
3. Golden Signals:
- Why Use Golden Crosses: A golden cross (50-period MA crossing above the 200-period MA) is a well-known bullish signal, while a death cross (50-period MA crossing below the 200-period MA) is bearish. These signals are widely followed by traders and institutions.
- Purpose: Highlighting these significant long-term signals helps traders identify major buy or sell opportunities and align with broader market trends.
How the Script Works
1. Moving Average Calculations:
- The script calculates multiple moving averages (MA1 to MA5) based on user-selected types (SMA, EMA, SMMA, WMA, VWMA, Hull) and periods (9, 21, 50, 100, 200).
- Golden Moving Averages: Separately calculates 50-period and 200-period moving averages for generating golden signals.
2. RSI and RSI MA Filter:
- RSI Calculation: Computes the RSI for the given period.
- RSI MA: Calculates a moving average of the RSI to smooth out the RSI values and reduce noise.
- RSI MA Filter: Traders can enable/disable RSI filtering and set custom thresholds to refine long and short signals based on RSI momentum.
3. Long & Short Signal Generation:
- Long Signal: Generated when the short-term moving average crosses above both the mid-term and long-term moving averages, and the RSI MA is below the specified threshold (if enabled).
- Short Signal: Generated when the short-term moving average crosses below both the mid-term and long-term moving averages, and the RSI MA is above the specified threshold (if enabled).
4. Golden Signals:
- Golden Long Signal: Triggered when the 50-period golden moving average crosses above the 200-period golden moving average.
- Golden Short Signal: Triggered when the 50-period golden moving average crosses below the 200-period golden moving average.
How to Use the Script
1. Customize Inputs:
- Moving Averages: Choose the type of moving averages and set the periods for up to five different moving averages.
- RSI Settings: Adjust the RSI period and its moving average period. Enable or disable RSI filtering and set custom thresholds for long and short signals.
- Signal Colors: Customize the colors for long, short, and golden signals.
- Enable/Disable Signals: Toggle the visibility of long, short, and golden signals.
2. Observe Plots and Signals:
- The script plots the selected moving averages on the chart.
- Long and short signals are marked with labels on the chart, with customizable colors for easy identification.
- Golden signals are highlighted with specific labels to indicate significant long-term trend changes.
3. Analyze and Trade:
- Use the generated signals as part of your trading strategy. The script provides visual cues to help you make informed decisions about entering or exiting trades based on multiple technical indicators.
Unique Features
1. Integration of Multiple Moving Averages: Combines various moving average types to provide a holistic view of market trends.
2. RSI MA Filtering: Enhances signal accuracy by incorporating RSI momentum, reducing the likelihood of false signals.
3. Golden Signals: Highlights significant long-term trend changes, aligning with broader market movements.
4. Customizability: Offers extensive customization options, allowing traders to tailor the script to their specific trading strategies and preferences.
feel free to comments.

Hamid Double RSIRSI with Moving Average and Another RSI
This script combines two Relative Strength Index (RSI) indicators with configurable moving averages. It allows traders to track momentum and market strength with adjustable periods for both the RSI and moving averages. The script also allows you to choose different data sources for each RSI, offering flexibility in analysis.
Features:
Two RSIs: One with a shorter period and another with a longer period .
Moving Averages: Each RSI has its own configurable moving average . The moving averages help smooth out the RSI and provide clearer trends.
Customizable Inputs: Adjust the RSI period and the length of the moving averages. You can also choose different sources for each RSI (e.g., close, open, high, low).
Mid Line: A horizontal line at 50, which is commonly used as the neutral level for the RSI. It helps identify whether the RSI is above or below neutral, indicating bullish or bearish conditions.
Overbought and Oversold Levels: Horizontal lines at 70 (overbought) and 30 (oversold) to highlight when the asset might be overbought or oversold according to the RSI.
How it works:
RSI Calculation: The script calculates two RSIs using different lengths
Moving Averages: A Simple Moving Average (SMA) is applied to both RSIs to smooth their values and help identify trends.
Overbought/Oversold Indicators: The script includes horizontal lines at 70 and 30 to show overbought and oversold conditions. The mid line is plotted at 50 to highlight neutral levels.
This indicator is useful for traders who want to compare the behavior of two RSIs over different time periods and use the moving averages to filter out noise. The ability to customize the source data for each RSI makes this script adaptable to different trading strategies.

Dual Moving Average with DotsOverview:
The Dual Moving Average with Dots is a powerful technical analysis tool designed to assist traders in identifying potential trend reversals and confirming trend strength. This indicator combines the simplicity of dual moving averages with visual markers in the form of dots above candles, providing clear signals for both trend following and reversal opportunities.
Key Features:
Dual Moving Averages:
Choose between Simple Moving Average (SMA) and Exponential Moving Average (EMA) for two distinct moving averages.
Customize the source for each moving average, including options such as open, close, high, low, and more.
Adjust the periods for both moving averages to suit your trading preferences.
Visual Signals:
Green Dot: A green triangle-up dot appears above candles where the closing price is greater than both selected moving averages. This signals potential bullish strength and trend continuation.
Red Dot: A red triangle-down dot appears above candles where the closing price is lower than either of the selected moving averages. This signals potential bearish weakness and trend reversal.
Flexible Configuration:
Tailor the indicator to your trading strategy by adjusting parameters such as moving average type, source, and period for each average.
Gain insights into market dynamics by visually interpreting the relationship between closing prices and moving averages.
How to Use:
Trend Confirmation:
Confirm a bullish trend when the green dot appears above a candle, suggesting that the closing price is above both moving averages.
Confirm a bearish trend when the red dot appears above a candle, suggesting that the closing price is below either of the moving averages.
Reversal Signals:
Watch for potential trend reversals when red dots appear, signaling that the closing price is below one of the moving averages.
Customization for Strategy:
Experiment with different combinations of moving average types, sources, and periods to align the indicator with your unique trading strategy.
Usage Tips:
Combine the Dual Moving Average with Dots with other technical indicators for comprehensive market analysis.
Look for confluence with support/resistance levels or chart patterns to enhance the robustness of your trading decisions.