FlexiMA Variance Tracker - Strategy [presentTrading]█ Introduction and How It Is Different
The FlexiMA Variance Tracker by PresentTrading introduces a novel approach to technical trading strategies. Unlike traditional methods, it calculates deviations between a chosen indicator source (such as price or average) and a moving average with a variable length. This flexibility is achieved through a unique combination of a starting factor and an increment factor, allowing the moving average to adapt dynamically within a specified range. This strategy provides a more responsive and nuanced view of market trends, setting it apart from standard trading methodologies.
BTC 8h L/S
Local
█ Strategy, How It Works: Detailed Explanation
The FlexiMA Variance Tracker, developed by PresentTrading, stands at the forefront of trading strategies, distinguished by its adaptive and multifaceted approach to market analysis. This strategy intricately weaves various technical elements to construct a comprehensive trading logic. Here's an in-depth professional breakdown:
🔶Foundation on Variable-Length Moving Averages:
Central to this strategy is the concept of variable-length Moving Averages (MAs). Unlike traditional MAs with a fixed period, this strategy dynamically adjusts the length of the MA based on a starting factor and an incremental factor. This approach allows the strategy to adapt to market volatility and trend strength more effectively.
Each MA iteration offers a distinct temporal perspective, capturing short-term price movements to long-term trends. This aggregation of various time frames provides a richer and more nuanced market analysis, essential for making informed trading decisions.
🔶Deviation Analysis and Normalization:
The strategy calculates deviations of the price (or the chosen indicator source) from each of these MAs. These deviations are pivotal in identifying the immediate market direction relative to the average trend captured by each MA.
To standardize these deviations for comparability, they undergo a normalization process. The choice of normalization method (Max-Min or Absolute Sum) can significantly influence the interpretation of market conditions, offering distinct insights into price movements and trend strength.
🔹Normalization: Absolute Sum
🔶Composite Oscillator Construction:
A composite oscillator is derived from the median of these normalized deviations. The median serves as a balanced and robust central trend indicator, minimizing the impact of outliers and market noise.
Additionally, the standard deviation of these deviations is computed, providing a measure of market volatility. This volatility indicator is crucial for assessing market risk and can guide traders in setting appropriate stop-loss and take-profit levels.
🔶Integration with SuperTrend Indicator:
The FlexiMA strategy integrates the SuperTrend indicator, renowned for its effectiveness in identifying trend direction and reversals. The SuperTrend's incorporation enhances the strategy's ability to filter out false signals and confirm genuine market trends.
* The SuperTrend Toolkit is made by @QuantiLuxe
This combination of the variable-length MA oscillator with the SuperTrend indicator forms a potent duo, offering traders a dual-confirmation mechanism for trade signals.
🔹Supertrend's incorporation
🔶Strategic Trade Signal Generation:
Trade signals are generated when there is a confluence between the composite oscillator and the SuperTrend indicator. For example, a long position signal might be considered when the oscillator suggests an uptrend, and the SuperTrend flips to bullish.
The strategy's parameters are fully customizable, enabling traders to tailor the signal generation process to their specific trading style, risk tolerance, and market conditions.
█ Usage
To effectively employ the FlexiMA Variance Tracker strategy:
Traders should set their desired trade direction and fine-tune the starting and increment factors according to their market analysis and risk tolerance.
Indicator Length: 5
Indicator Length: 40
The strategy is suitable for a wide range of markets and can be adapted to different time frames, making it a versatile tool for various trading scenarios.
█ Default Settings Impact on Performance: FlexiMA Variance Tracker
1. Trade Direction (Configurable: Long, Short, Both): Determines trade types. 'Long' for buying, 'Short' for selling, 'Both' adapts to market trends.
2. Indicator Source: HLC3: Balances market sentiment by considering high, low, and close, providing comprehensive period analysis.
4. Indicator Length (Default: 10): Baseline for moving averages. Shorter lengths increase responsiveness but add noise, while longer lengths favor trends.
5. Starting and Increment Factor (Default: 1.0): Adjusts MA lengths range. Higher values capture broad market dynamics, lower values focus analysis.
6. Normalization Method (Options: None, Max-Min, Absolute Sum): Standardizes deviations. 'None' for raw deviations, 'Max-Min' for relative scaling, 'Absolute Sum' emphasizes relative strength.
7. SuperTrend Settings (ATR Length: 10, Multiplier: 15.0): Influences indicator sensitivity. Short ATR or high multiplier for short-term, long ATR or low multiplier for long-term trends.
8. Additional Settings (Mesh Style, Color Customization): Enhances visual clarity. Mesh style for detailed deviation view, colors for quick market condition identification.
Cerca negli script per "moving averages"

Laguerre-Kalman Adaptive Filter | AlphaNattLaguerre-Kalman Adaptive Filter |AlphaNatt
A sophisticated trend-following indicator that combines Laguerre polynomial filtering with Kalman optimal estimation to create an ultra-smooth, low-lag trend line with exceptional noise reduction capabilities.
"The perfect trend line adapts to market conditions while filtering out noise - this indicator achieves both through advanced mathematical techniques rarely seen in retail trading."
━━━━━━━━━━━━━━━━━━━━━━━━━━━━━━━━━━━━━━━━
🎯 KEY FEATURES
Dual-Filter Architecture: Combines two powerful filtering methods for superior performance
Adaptive Volatility Adjustment: Automatically adapts to market conditions
Minimal Lag: Laguerre polynomials provide faster response than traditional moving averages
Optimal Noise Reduction: Kalman filtering removes market noise while preserving trend
Clean Visual Design: Color-coded trend visualization (cyan/pink)
━━━━━━━━━━━━━━━━━━━━━━━━━━━━━━━━━━━━━━━━
📊 THE MATHEMATICS
1. Laguerre Filter Component
The Laguerre filter uses a cascade of four all-pass filters with a single gamma parameter:
4th order IIR (Infinite Impulse Response) filter
Single parameter (gamma) controls all filter characteristics
Provides smoother output than EMA with similar lag
Based on Laguerre polynomials from quantum mechanics
2. Kalman Filter Component
Implements a simplified Kalman filter for optimal estimation:
Prediction-correction algorithm from aerospace engineering
Dynamically adjusts based on estimation error
Provides mathematically optimal estimate of true price trend
Reduces noise while maintaining responsiveness
3. Adaptive Mechanism
Monitors market volatility in real-time
Adjusts filter parameters based on current conditions
More responsive in trending markets
More stable in ranging markets
━━━━━━━━━━━━━━━━━━━━━━━━━━━━━━━━━━━━━━━━
⚙️ INDICATOR SETTINGS
Laguerre Gamma (0.1-0.99): Controls filter smoothness. Higher = smoother but more lag
Adaptive Period (5-100): Lookback for volatility calculation
Kalman Noise Reduction (0.1-2.0): Higher = more noise filtering
Trend Threshold (0.0001-0.01): Minimum change to register trend shift
Recommended Settings:
Scalping: Gamma: 0.6, Period: 10, Noise: 0.3
Day Trading: Gamma: 0.8, Period: 20, Noise: 0.5 (default)
Swing Trading: Gamma: 0.9, Period: 30, Noise: 0.8
Position Trading: Gamma: 0.95, Period: 50, Noise: 1.2
━━━━━━━━━━━━━━━━━━━━━━━━━━━━━━━━━━━━━━━━
📈 TRADING SIGNALS
Primary Signals:
Cyan Line: Bullish trend - price above filter and filter ascending
Pink Line: Bearish trend - price below filter or filter descending
Color Change: Potential trend reversal point
Entry Strategies:
Trend Continuation: Enter on pullback to filter line in trending market
Trend Reversal: Enter on color change with volume confirmation
Breakout: Enter when price crosses filter with momentum
Exit Strategies:
Exit long when line turns from cyan to pink
Exit short when line turns from pink to cyan
Use filter as trailing stop in strong trends
━━━━━━━━━━━━━━━━━━━━━━━━━━━━━━━━━━━━━━━━
✨ ADVANTAGES OVER TRADITIONAL INDICATORS
Vs. Moving Averages:
Significantly less lag while maintaining smoothness
Adaptive to market conditions
Better noise filtering
Vs. Standard Filters:
Dual-filter approach provides optimal estimation
Mathematical foundation from signal processing
Self-adjusting parameters
Vs. Other Trend Indicators:
Cleaner signals with fewer whipsaws
Works across all timeframes
No repainting or lookahead bias
━━━━━━━━━━━━━━━━━━━━━━━━━━━━━━━━━━━━━━━━
🎓 MATHEMATICAL BACKGROUND
The Laguerre filter was developed by John Ehlers, applying Laguerre polynomials (used in quantum mechanics) to financial markets. These polynomials provide an elegant solution to the lag-smoothness tradeoff that plagues traditional moving averages.
The Kalman filter, developed by Rudolf Kalman in 1960, is used in everything from GPS systems to spacecraft navigation. It provides the mathematically optimal estimate of a system's state given noisy measurements.
By combining these two approaches, this indicator achieves what neither can alone: a smooth, responsive trend line that adapts to market conditions while filtering out noise.
━━━━━━━━━━━━━━━━━━━━━━━━━━━━━━━━━━━━━━━━
💡 TIPS FOR BEST RESULTS
Confirm with Volume: Strong trends should have increasing volume
Multiple Timeframes: Use higher timeframe for trend, lower for entry
Combine with Momentum: RSI or MACD can confirm filter signals
Market Conditions: Adjust noise parameter based on market volatility
Backtesting: Always test settings on your specific instrument
━━━━━━━━━━━━━━━━━━━━━━━━━━━━━━━━━━━━━━━━
⚠️ IMPORTANT NOTES
No indicator is perfect - always use proper risk management
Best suited for trending markets
May produce false signals in choppy/ranging conditions
Not financial advice - for educational purposes only
━━━━━━━━━━━━━━━━━━━━━━━━━━━━━━━━━━━━━━━━
🚀 CONCLUSION
The Laguerre-Kalman Adaptive Filter represents a significant advancement in technical analysis, bringing institutional-grade mathematical techniques to retail traders. Its unique combination of polynomial filtering and optimal estimation provides a clean, reliable trend-following tool that adapts to changing market conditions.
Whether you're scalping on the 1-minute chart or position trading on the daily, this indicator provides clear, actionable signals with minimal false positives.
"In the world of technical analysis, the edge comes from using better mathematics. This indicator delivers that edge."
━━━━━━━━━━━━━━━━━━━━━━━━━━━━━━━━━━━━━━━━
Developed by AlphaNatt | Professional Quantitative Trading Tools
Version: 1.0
Last Updated: 2025
Pine Script: v6
License: Open Source
Not financial advice. Always DYOR

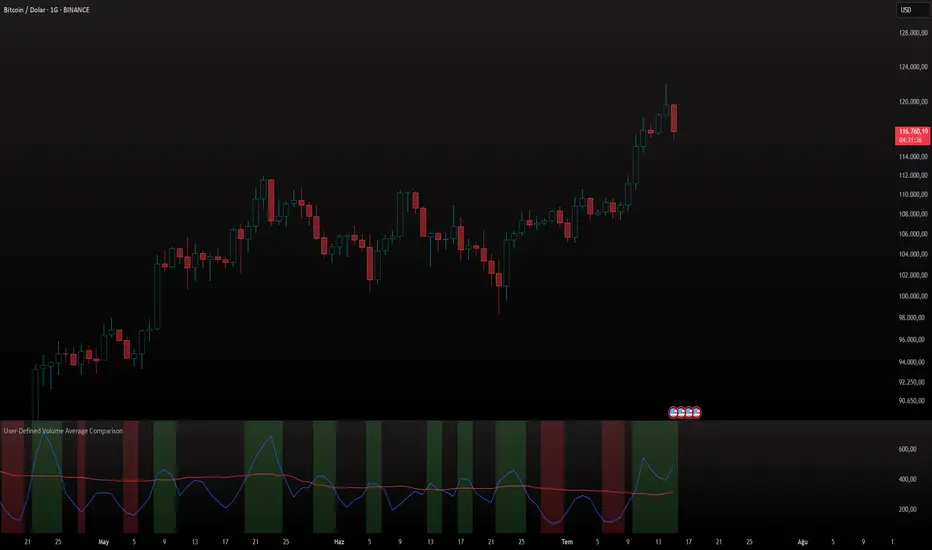
User-Defined Volume Average ComparisonThe User-Defined Volume Average Comparison indicator empowers traders to analyze volume trends by comparing short-term and long-term volume moving averages. With customizable periods, visual cues, and built-in alerts, it’s a versatile tool for identifying volume-driven market shifts across any timeframe, ideal for stocks, forex, crypto, and more.Key Features: Customizable Periods: Set short and long periods (in bars) to match your trading strategy.
Conditional Highlighting:
Green Background: Short-period volume average ≥ long-period volume average, signaling strong short-term volume.
Red Background: Short-period volume average < long-period volume average / 2, indicating low short-term volume.
Optional Labels: Toggle labels to display conditions on the chart (default: off).
Alerts: Receive notifications for key conditions: “Short ≥ Long Alert” for high volume periods.
“Short < Long/2 Alert” for low volume periods.
Visualized Averages: Plots short-period (blue) and long-period (red) volume moving averages for easy analysis.
How It Works:
The indicator calculates the simple moving average (SMA) of volume over user-defined short and long periods, then compares them: A green background and alert trigger when the short-period average meets or exceeds the long-period average, suggesting increased volume activity.
A red background and alert trigger when the short-period average falls below half of the long-period average, indicating reduced volume.
Labels (if enabled) display “Short ≥ Long” or “Short < Long/2” for clarity.
Settings: Short Period (Bars): Number of bars for the short-term volume average (default: 3).
Long Period (Bars): Number of bars for the long-term volume average (default: 50).
Show Labels: Enable or disable condition labels (default: off).
Use Cases: Trend Confirmation: Use green alerts to confirm high volume during breakouts or trend continuations.
Divergence Detection: Identify low volume periods with red alerts to spot potential reversals or weak trends.
Multi-Timeframe Analysis: Apply on any timeframe (e.g., 4H, 1D), with periods based on bars (e.g., 3 bars on 4H = 12 hours).
Notes: Periods are based on the chart’s timeframe (bars). For shorter timeframes, consider increasing period values for more significant results.
Set alerts to “Once Per Bar Close” for reliable notifications.
Combine with price-based indicators to enhance trading decisions.
Why Use This Indicator?
This indicator offers a flexible, alert-driven approach to volume analysis, helping traders of all levels make informed decisions. Its intuitive design and customizable settings make it a valuable addition to any trading setup.
Dskyz (DAFE) MAtrix with ATR-Powered Precision Dskyz (DAFE) MAtrix with ATR-Powered Precision
This cutting‐edge futures trading strategy built to thrive in rapidly changing market conditions. Developed for high-frequency futures trading on instruments such as the CME Mini MNQ, this strategy leverages a matrix of sophisticated moving averages combined with ATR-based filters to pinpoint high-probability entries and exits. Its unique combination of adaptable technical indicators and multi-timeframe trend filtering sets it apart from standard strategies, providing enhanced precision and dynamic responsiveness.
imgur.com
Core Functional Components
1. Advanced Moving Averages
A distinguishing feature of the DAFE strategy is its robust, multi-choice moving averages (MAs). Clients can choose from a wide array of MAs—each with specific strengths—in order to fine-tune their trading signals. The code includes user-defined functions for the following MAs:
imgur.com
Hull Moving Average (HMA):
The hma(src, len) function calculates the HMA by using weighted moving averages (WMAs) to reduce lag considerably while smoothing price data. This function computes an intermediate WMA of half the specified length, then a full-length WMA, and finally applies a further WMA over the square root of the length. This design allows for rapid adaptation to price changes without the typical delays of traditional moving averages.
Triple Exponential Moving Average (TEMA):
Implemented via tema(src, len), TEMA uses three consecutive exponential moving averages (EMAs) to effectively cancel out lag and capture price momentum. The final formula—3 * (ema1 - ema2) + ema3—produces a highly responsive indicator that filters out short-term noise.
Double Exponential Moving Average (DEMA):
Through the dema(src, len) function, DEMA calculates an EMA and then a second EMA on top of it. Its simplified formula of 2 * ema1 - ema2 provides a smoother curve than a single EMA while maintaining enhanced responsiveness.
Volume Weighted Moving Average (VWMA):
With vwma(src, len), this MA accounts for trading volume by weighting the price, thereby offering a more contextual picture of market activity. This is crucial when volume spikes indicate significant moves.
Zero Lag EMA (ZLEMA):
The zlema(src, len) function applies a correction to reduce the inherent lag found in EMAs. By subtracting a calculated lag (based on half the moving average window), ZLEMA is exceptionally attuned to recent price movements.
Arnaud Legoux Moving Average (ALMA):
The alma(src, len, offset, sigma) function introduces ALMA—a type of moving average designed to be less affected by outliers. With parameters for offset and sigma, it allows customization of the degree to which the MA reacts to market noise.
Kaufman Adaptive Moving Average (KAMA):
The custom kama(src, len) function is noteworthy for its adaptive nature. It computes an efficiency ratio by comparing price change against volatility, then dynamically adjusts its smoothing constant. This results in an MA that quickly responds during trending periods while remaining smoothed during consolidation.
Each of these functions—integrated into the strategy—is selectable by the trader (via the fastMAType and slowMAType inputs). This flexibility permits the tailored application of the MA most suited to current market dynamics and individual risk management preferences.
2. ATR-Based Filters and Risk Controls
ATR Calculation and Volatility Filter:
The strategy computes the Average True Range (ATR) over a user-defined period (atrPeriod). ATR is then used to derive both:
Volatility Assessment: Expressed as a ratio of ATR to closing price, ensuring that trades are taken only when volatility remains within a safe, predefined threshold (volatilityThreshold).
ATR-Based Entry Filters: Implemented as atrFilterLong and atrFilterShort, these conditions ensure that for long entries the price is sufficiently above the slow MA and vice versa for shorts. This acts as an additional confirmation filter.
Dynamic Exit Management:
The exit logic employs a dual approach:
Fixed Stop and Profit Target: Stops and targets are set at multiples of ATR (fixedStopMultiplier and profitTargetATRMult), helping manage risk in volatile markets.
Trailing Stop Adjustments: A trailing stop is calculated using the ATR multiplied by a user-defined offset (trailOffset), which captures additional profits as the trade moves favorably while protecting against reversals.
3. Multi-Timeframe Trend Filtering
The strategy enhances its signal reliability by leveraging a secondary, higher timeframe analysis:
15-Minute Trend Analysis:
By retrieving 15-minute moving averages (fastMA15m and slowMA15m) via request.security, the strategy determines the broader market trend. This secondary filter (enabled or disabled through useTrendFilter) ensures that entries are aligned with the prevailing market direction, thereby reducing the incidence of false signals.
4. Signal and Execution Logic
Combined MA Alignment:
The entry conditions are based primarily on the alignment of the fast and slow MAs. A long condition is triggered when the current price is above both MAs and the fast MA is above the slow MA—complemented by the ATR filter and volume conditions. The reverse applies for a short condition.
Volume and Time Window Validation:
Trades are permitted only if the current volume exceeds a minimum (minVolume) and the current hour falls within the predefined trading window (tradingStartHour to tradingEndHour). An additional volume spike check (comparing current volume to a moving average of past volumes) further filters for optimal market conditions.
Comprehensive Order Execution:
The strategy utilizes flexible order execution functions that allow pyramiding (up to 10 positions), ensuring that it can scale into positions as favorable conditions persist. The use of both market entries and automated exits (with profit targets, stop-losses, and trailing stops) ensures that risk is managed at every step.
5. Integrated Dashboard and Metrics
For transparency and real-time analysis, the strategy includes:
On-Chart Visualizations:
Both fast and slow MAs are plotted on the chart, making it easy to see the market’s technical foundation.
Dynamic Metrics Dashboard:
A built-in table displays crucial performance statistics—including current profit/loss, equity, ATR (both raw and as a percentage), and the percentage gap between the moving averages. These metrics offer immediate insight into the health and performance of the strategy.
Input Parameters: Detailed Breakdown
Every input is meticulously designed to offer granular control:
Fast & Slow Lengths:
Determine the window size for the fast and slow moving averages. Smaller values yield more sensitivity, while larger values provide a smoother, delayed response.
Fast/Slow MA Types:
Choose the type of moving average for fast and slow signals. The versatility—from basic SMA and EMA to more complex ones like HMA, TEMA, ZLEMA, ALMA, and KAMA—allows customization to fit different market scenarios.
ATR Parameters:
atrPeriod and atrMultiplier shape the volatility assessment, directly affecting entry filters and risk management through stop-loss and profit target levels.
Trend and Volume Filters:
Inputs such as useTrendFilter, minVolume, and the volume spike condition help confirm that a trade occurs in active, trending markets rather than during periods of low liquidity or market noise.
Trading Hours:
Restricting trade execution to specific hours (tradingStartHour and tradingEndHour) helps avoid illiquid or choppy markets outside of prime trading sessions.
Exit Strategies:
Parameters like trailOffset, profitTargetATRMult, and fixedStopMultiplier provide multiple layers of risk management and profit protection by tailoring how exits are generated relative to current market conditions.
Pyramiding and Fixed Trade Quantity:
The strategy supports multiple entries within a trend (up to 10 positions) and sets a predefined trade quantity (fixedQuantity) to maintain consistent exposure and risk per trade.
Dashboard Controls:
The resetDashboard input allows for on-the-fly resetting of performance metrics, keeping the strategy’s performance dashboard accurate and up-to-date.
Why This Strategy is Truly Exceptional
Multi-Faceted Adaptability:
The ability to switch seamlessly between various moving average types—each suited to particular market conditions—enables the strategy to adapt dynamically. This is a testament to the high level of coding sophistication and market insight infused within the system.
Robust Risk Management:
The integration of ATR-based stops, profit targets, and trailing stops ensures that every trade is executed with well-defined risk parameters. The system is designed to mitigate unexpected market swings while optimizing profit capture.
Comprehensive Market Filtering:
By combining moving average crossovers with volume analysis, volatility thresholds, and multi-timeframe trend filters, the strategy only enters trades under the most favorable conditions. This multi-layered filtering reduces noise and enhances signal quality.
-Final Thoughts-
The Dskyz Adaptive Futures Elite (DAFE) MAtrix with ATR-Powered Precision strategy is not just another trading algorithm—it is a multi-dimensional, fully customizable system built on advanced technical principles and sophisticated risk management techniques. Every function and input parameter has been carefully engineered to provide traders with a system that is both powerful and transparent.
For clients seeking a state-of-the-art trading solution that adapts dynamically to market conditions while maintaining strict discipline in risk management, this strategy truly stands in a class of its own.
****Please show support if you enjoyed this strategy. I'll have more coming out in the near future!!
-Dskyz
Caution
DAFE is experimental, not a profit guarantee. Futures trading risks significant losses due to leverage. Backtest, simulate, and monitor actively before live use. All trading decisions are your responsibility.

$TUBR: 7-25-99 Moving Average7, 25, and 99 Period Moving Averages
This indicator plots three moving averages: the 7-period, 25-period, and 99-period Simple Moving Averages (SMA). These moving averages are widely used to smooth out price action and help traders identify trends over different time frames. Let's break down the significance of these specific moving averages from both supply and demand perspectives and a price action perspective.
1. Supply and Demand Perspective:
- 7-period Moving Average (Short-Term) :
The 7-period moving average represents the short-term sentiment in the market. It captures the rapid fluctuations in price and is heavily influenced by recent supply and demand changes. Traders often look to the 7-period SMA for immediate price momentum, with price moving above or below this line signaling short-term strength or weakness.
- Bullish Supply/Demand : When price is above the 7-period SMA, it suggests that buyers are currently in control and demand is higher than supply. Conversely, price falling below this line indicates that supply is overpowering demand, leading to a short-term downtrend.
Is current price > average price in past 7 candles (depending on timeframe)? This will tell you how aggressive buyers are in short term.
- Key Supply/Demand Zones : The 7-period SMA often acts as dynamic support or resistance in a trending market, where traders might use it to enter or exit positions based on how price interacts with this level.
- 25-period Moving Average (Medium-Term) :
The 25-period SMA smooths out more of the noise compared to the 7-period, providing a more stable indication of intermediate trends. This moving average is often used to gauge the market's supply and demand balance over a broader timeframe than the short-term 7-period SMA.
- Supply/Demand Balance : The 25-period SMA reflects the medium-term equilibrium between supply and demand. A crossover between the price and the 25-period SMA may indicate a shift in this balance. When price sustains above the 25-period SMA, it shows that demand is strong enough to maintain an upward trend. Conversely, if the price stays below it, supply is likely exceeding demand.
Is current price > average price in past 25 candles (depending on timeframe)? This will tell you how aggressive buyers are in mid term.
- Momentum Shift : Crossovers between the 7-period and 25-period SMAs can indicate momentum shifts between short-term and medium-term demand. For example, if the 7-period crosses above the 25-period, it often signifies growing short-term demand relative to the medium-term trend, signaling potential buy opportunities. What this crossover means is that if 7MA > 25MA that means in past 7 candles average price is more than past 25 candles.
- 99-period Moving Average (Long-Term):
The 99-period SMA represents the long-term trend and reflects the market's supply and demand over an extended period. This moving average filters out short-term fluctuations and highlights the market's overall trajectory.
- Long-Term Supply/Demand Dynamics : The 99-period SMA is slower to react to changes in supply and demand, providing a more stable view of the market's overall trend. Price staying above this line shows sustained demand dominance, while price consistently staying below reflects ongoing supply pressure.
Is current price > average price in past 99 candles (depending on timeframe)? This will tell you how aggressive buyers are in long term.
- Market Trend Confirmation : When both the 7-period and 25-period SMAs are above the 99-period SMA, it signals a strong bullish trend with demand outweighing supply across all timeframes. If all three SMAs are below the 99-period SMA, it points to a bear market where supply is overpowering demand in both the short and long term.
2. Price Action Perspective :
- 7-period Moving Average (Short-Term Trends):
The 7-period moving average closely tracks price action, making it highly responsive to quick shifts in price. Traders often use it to confirm short-term reversals or continuations in price action. In an uptrend, price typically stays above the 7-period SMA, whereas in a downtrend, price stays below it.
- Short-Term Price Reversals : Crossovers between the price and the 7-period SMA often indicate short-term reversals. When price breaks above the 7-period SMA after staying below it, it suggests a potential bullish reversal. Conversely, a price breakdown below the 7-period SMA could signal a bearish reversal.
- 25-period Moving Average (Medium-Term Trends) :
The 25-period SMA helps identify the medium-term price action trend. It balances short-term volatility and longer-term stability, providing insight into the more persistent trend. Price pullbacks to the 25-period SMA during an uptrend can act as a buying opportunity for trend traders, while pullbacks during a downtrend may offer shorting opportunities.
- Pullback and Continuation: In trending markets, price often retraces to the 25-period SMA before continuing in the direction of the trend. For instance, if the price is in a bullish trend, traders may look for support at the 25-period SMA for potential continuation trades.
- 99-period Moving Average (Long-Term Trend and Market Sentiment ):
The 99-period SMA is the most critical for identifying the overall market trend. Price consistently trading above the 99-period SMA indicates long-term bullish momentum, while price staying below the 99-period SMA suggests bearish sentiment.
- Trend Confirmation : Price action above the 99-period SMA confirms long-term upward momentum, while price action below it confirms a downtrend. The space between the shorter moving averages (7 and 25) and the 99-period SMA gives a sense of the strength or weakness of the trend. Larger gaps between the 7 and 99 SMAs suggest strong bullish momentum, while close proximity indicates consolidation or potential reversals.
- Price Action in Trending Markets : Traders often use the 99-period SMA as a dynamic support/resistance level. In strong trends, price tends to stay on one side of the 99-period SMA for extended periods, with breaks above or below signaling major changes in market sentiment.
Why These Numbers Matter:
7-Period MA : The 7-period moving average is a popular choice among short-term traders who want to capture quick momentum changes. It helps visualize immediate market sentiment and is often used in conjunction with price action to time entries or exits.
- 25-Period MA: The 25-period MA is a key indicator for swing traders. It balances sensitivity and stability, providing a clearer picture of the intermediate trend. It helps traders stay in trades longer by filtering out short-term noise, while still being reactive enough to detect reversals.
- 99-Period MA : The 99-period moving average provides a broad view of the market's direction, filtering out much of the short- and medium-term noise. It is crucial for identifying long-term trends and assessing whether the market is bullish or bearish overall. It acts as a key reference point for longer-term trend followers, helping them stay with the broader market sentiment.
Conclusion:
From a supply and demand perspective, the 7, 25, and 99-period moving averages help traders visualize shifts in the balance between buyers and sellers over different time horizons. The price action interaction with these moving averages provides valuable insight into short-term momentum, intermediate trends, and long-term market sentiment. Using these three MAs together gives a more comprehensive understanding of market conditions, helping traders align their strategies with prevailing trends across various timeframes.
------------- RULE BASED SYSTEM ---------------
Overview of the Rule-Based System:
This system will use the following moving averages:
7-period MA: Represents short-term price action.
25-period MA: Represents medium-term price action.
99-period MA: Represents long-term price action.
1. Trend Identification Rules:
Bullish Trend:
The 7-period MA is above the 25-period MA, and the 25-period MA is above the 99-period MA.
This structure shows that short, medium, and long-term trends are aligned in an upward direction, indicating strong bullish momentum.
Bearish Trend:
The 7-period MA is below the 25-period MA, and the 25-period MA is below the 99-period MA.
This suggests that the market is in a downtrend, with bearish momentum dominating across timeframes.
Neutral/Consolidation:
The 7-period MA and 25-period MA are flat or crossing frequently with the 99-period MA, and they are close to each other.
This indicates a sideways or consolidating market where there’s no strong trend direction.
2. Entry Rules:
Bullish Entry (Buy Signals):
Primary Buy Signal:
The price crosses above the 7-period MA, AND the 7-period MA is above the 25-period MA, AND the 25-period MA is above the 99-period MA.
This indicates the start of a new upward trend, with alignment across the short, medium, and long-term trends.
Pullback Buy Signal (for trend continuation):
The price pulls back to the 25-period MA, and the 7-period MA remains above the 25-period MA.
This indica
tes that the pullback is a temporary correction in an uptrend, and buyers may re-enter the market as price approaches the 25-period MA.
You can further confirm the signal by waiting for price action (e.g., bullish candlestick patterns) at the 25-period MA level.
Breakout Buy Signal:
The price crosses above the 99-period MA, and the 7-period and 25-period MAs are also both above the 99-period MA.
This confirms a strong bullish breakout after consolidation or a long-term downtrend.
Bearish Entry (Sell Signals):
Primary Sell Signal:
The price crosses below the 7-period MA, AND the 7-period MA is below the 25-period MA, AND the 25-period MA is below the 99-period MA.
This indicates the start of a new downtrend with alignment across the short, medium, and long-term trends.
Pullback Sell Signal (for trend continuation):
The price pulls back to the 25-period MA, and the 7-period MA remains below the 25-period MA.
This indicates that the pullback is a temporary retracement in a downtrend, providing an opportunity to sell as price meets resistance at the 25-period MA.
Breakdown Sell Signal:
The price breaks below the 99-period MA, and the 7-period and 25-period MAs are also below the 99-period MA.
This confirms a strong bearish breakdown after consolidation or a long-term uptrend reversal.
3. Exit Rules:
Bullish Exit (for long positions):
Short-Term Exit:
The price closes below the 7-period MA, and the 7-period MA starts crossing below the 25-period MA.
This indicates weakening momentum in the uptrend, suggesting an exit from the long position.
Stop-Loss Trigger:
The price falls below the 99-period MA, signaling the breakdown of the long-term trend.
This can act as a final exit signal to minimize losses if the long-term uptrend is invalidated.
Bearish Exit (for short positions):
Short-Term Exit:
The price closes above the 7-period MA, and the 7-period MA starts crossing above the 25-period MA.
This indicates a potential weakening of the downtrend and signals an exit from the short position.
Stop-Loss Trigger:
The price breaks above the 99-period MA, invalidating the bearish trend.
This signals that the market may be reversing to the upside, and exiting short positions would be prudent.

Machine Learning Momentum Index (MLMI) [Zeiierman]█ Overview
The Machine Learning Momentum Index (MLMI) represents the next step in oscillator trading. By blending traditional momentum analysis with machine learning, MLMI delivers a potent and dynamic tool that aligns with the complexities of modern financial landscapes. Offering traders an adaptive way to understand and act on market momentum and trends, this oscillator provides real-time insights into market momentum and prevailing trends.
█ How It Works:
Momentum Analysis: MLMI employs a dual-layer analysis, utilizing quick and slow weighted moving averages (WMA) of the Relative Strength Index (RSI) to gauge the market's momentum and direction.
Machine Learning Integration: Through the k-Nearest Neighbors (k-NN) algorithm, MLMI intelligently examines historical data to make more accurate momentum predictions, adapting to the intricate patterns of the market.
MLMI's precise calculation involves:
Weighted Moving Averages: Calculations of quick (5-period) and slow (20-period) WMAs of the RSI to track short-term and long-term momentum.
k-Nearest Neighbors Algorithm: Distances between current parameters and previous data are measured, and the nearest neighbors are used for predictive modeling.
Trend Analysis: Recognition of prevailing trends through the relationship between quick and slow-moving averages.
█ How to use
The Machine Learning Momentum Index (MLMI) can be utilized in much the same way as traditional trend and momentum oscillators, providing key insights into market direction and strength. What sets MLMI apart is its integration of artificial intelligence, allowing it to adapt dynamically to market changes and offer a more nuanced and responsive analysis.
Identifying Trend Direction and Strength: The MLMI serves as a tool to recognize market trends, signaling whether the momentum is upward or downward. It also provides insights into the intensity of the momentum, helping traders understand both the direction and strength of prevailing market trends.
Identifying Consolidation Areas: When the MLMI Prediction line and the WMA of the MLMI Prediction line become flat/oscillate around the mid-level, it's a strong sign that the market is in a consolidation phase. This insight from the MLMI allows traders to recognize periods of market indecision.
Recognizing Overbought or Oversold Conditions: By identifying levels where the market may be overbought or oversold, MLMI offers insights into potential price corrections or reversals.
█ Settings
Prediction Data (k)
This parameter controls the number of neighbors to consider while making a prediction using the k-Nearest Neighbors (k-NN) algorithm. By modifying the value of k, you can change how sensitive the prediction is to local fluctuations in the data.
A smaller value of k will make the prediction more sensitive to local variations and can lead to a more erratic prediction line.
A larger value of k will consider more neighbors, thus making the prediction more stable but potentially less responsive to sudden changes.
Trend length
This parameter controls the length of the trend used in computing the momentum. This length refers to the number of periods over which the momentum is calculated, affecting how quickly the indicator reacts to changes in the underlying price movements.
A shorter trend length (smaller momentumWindow) will make the indicator more responsive to short-term price changes, potentially generating more signals but at the risk of more false alarms.
A longer trend length (larger momentumWindow) will make the indicator smoother and less responsive to short-term noise, but it may lag in reacting to significant price changes.
Please note that the Machine Learning Momentum Index (MLMI) might not be effective on higher timeframes, such as daily or above. This limitation arises because there may not be enough data at these timeframes to provide accurate momentum and trend analysis. To overcome this challenge and make the most of what MLMI has to offer, it's recommended to use the indicator on lower timeframes.
-----------------
Disclaimer
The information contained in my Scripts/Indicators/Ideas/Algos/Systems does not constitute financial advice or a solicitation to buy or sell any securities of any type. I will not accept liability for any loss or damage, including without limitation any loss of profit, which may arise directly or indirectly from the use of or reliance on such information.
All investments involve risk, and the past performance of a security, industry, sector, market, financial product, trading strategy, backtest, or individual's trading does not guarantee future results or returns. Investors are fully responsible for any investment decisions they make. Such decisions should be based solely on an evaluation of their financial circumstances, investment objectives, risk tolerance, and liquidity needs.
My Scripts/Indicators/Ideas/Algos/Systems are only for educational purposes!

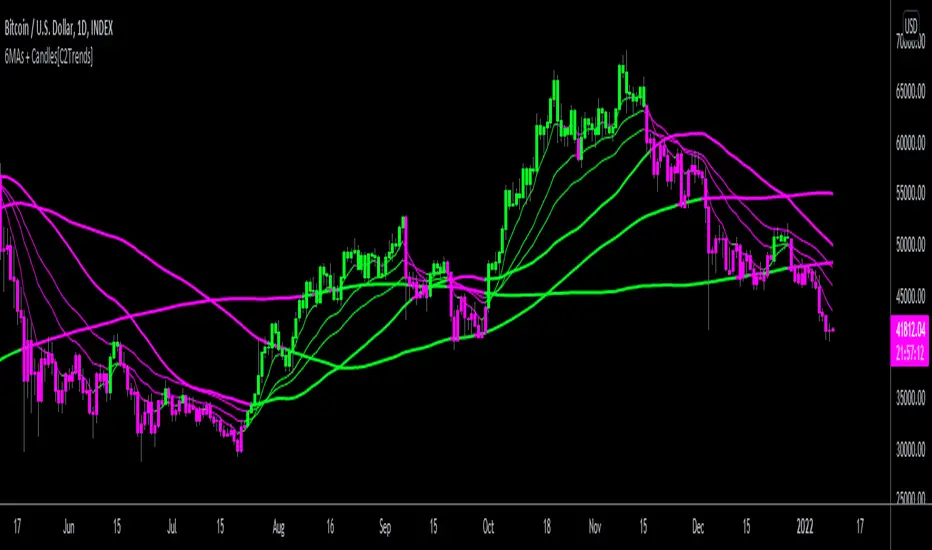
3 EMA/SMA + Colored Candles[C2Trends]// Indicator Features:
// 1) 3 Exponential Moving Averages and 3 Simple Moving Averages.
// 2) Additional EMA input for colored candles(EMA is hidden from chart, input used for coloring of candles only)
// 3) Turn colored candles on/off from main input tab of indicator settings.
// 4) Turn SMA's and EMA's on/off from main input tab of indicator settings.
// 5) Select single color or 2 color EMA and SMA lines from main input tab of indicator settings.
// Indicator Notes:
// 1) 'Candle EMA' input is the trend lookback period for the price candle colors. When price is above desired Candle EMA, price candles will color green. When price is below the Candle EMA, price candles will color fuchsia.
// 2) If you are using another indicator that colors the price candles it may overlap the candle colors applied by this indicator. Trying hiding or removing other indicators to troubleshoot if having candle color issues.
// 3) Using 2-color price moving averages: when price is above an average the average will color green, when price is below an average the average will color fuchsia.
Uptrick: Zero Lag HMA Trend Suite1. Name and Purpose
Uptrick: Zero Lag HMA Trend Suite is a Pine Version 6 script that builds upon the Hull Moving Average (HMA) to offer an advanced trend analysis tool. Its purpose is to help traders identify trend direction, potential reversals, and overall market momentum with reduced lag compared to traditional moving averages. By combining the HMA with Average True Range (ATR) thresholds, slope-dependent coloring, Volume Weighted Average Price (VWAP) ribbons, and optional reversal signals, the script aims to give a detailed view of price activity in various market environments.
2. Overview
This script begins with the calculation of a Hull Moving Average, a method that blends Weighted Moving Averages in a way designed to cut down on lag while still smoothing out price fluctuations. Next, several enhancements are applied. The script compares current HMA values to previous ones for slope-based coloring, which highlights uptrends and downtrends at a glance. It also plots buy and sell signals when price moves beyond or below thresholds determined by the ATR and the user’s chosen signal multiplier. An optional VWAP ribbon can be shown to confirm bullish or bearish conditions relative to a volume-weighted benchmark. Additionally, the script can plot reversal signals (labeled with B) at points where price crosses back toward the HMA from above or below. Taken together, these elements allow traders to visualize both the short-term momentum and the broader context of how price interacts with volatility and overall market direction.
3. Why These Indicators Have Been Linked Together
The reason the Hull Moving Average, the Average True Range, and the VWAP have been integrated into one script is to tackle multiple facets of market analysis in a single tool. The Zero Lag Hull Moving Average provides a responsive trend line, the ATR offers a measure of volatility that helps distinguish significant price shifts from typical fluctuations, and the VWAP acts as a reference for fair value based on traded volume. By layering all three, the script helps traders avoid the need to juggle multiple separate indicators and offers a holistic perspective. The slope-based coloring focuses on trend direction, the ATR-based thresholds refine possible buy and sell zones, and the VWAP ribbons provide insight into how price stands relative to an important volume-weighted level. The inclusion of up and down signals and reversal B labels further refines entries and exits.
4. Why Use Uptrick: Zero Lag HMA Trend Suite
The Hull Moving Average is already known for reacting more quickly to price changes compared to other moving averages while retaining a degree of smoothness. This suite enhances the basic HMA by showing colored gradients that make it easy to spot trend direction changes, highlighting potential entry or exit points based on volatility-driven thresholds, and optionally layering a volume-based measure of bullish or bearish market sentiment. By relying on a zero lag approach and additional data points, the script caters to those wanting a more responsive method of identifying shifts in market dynamics. The added reversal signals and up or down alerts give traders extra confirmation for potential turning points.
5. How This Extension Improves on the Basic HMA
This extension not only plots the Hull Moving Average but also includes data-driven alerts and visual cues that traditional HMA lines do not provide. First, it offers multi-layered slope coloring, making up or down trends quickly apparent. Second, it uses ATR-based thresholds to pinpoint moments when price may be extending beyond normal volatility, thus generating buy or sell signals. Third, the script introduces an optional VWAP ribbon to indicate whether the market is trading above or below this pivotal volume-weighted benchmark, adding a further confirmation step for bullish or bearish conditions. Finally, it incorporates optional reversal signals labeled with B, indicating points where price might swing back toward the main HMA line.
6. Core Components
The script can be broken down into several primary functions and features.
a. Zero Lag HMA Calculation
Uses two Weighted Moving Averages (half-length and full-length) combined through a smoothing step based on the square root of the chosen length. This approach is designed to reduce lag significantly compared to other moving averages.
b. Slope Detection
Compares current and prior HMA values to determine if the trend is up or down. The slope-based coloring changes between turquoise shades for upward movement and magenta shades for downward movement, making trend direction immediately visible.
c. ATR-Based Thresholding for Up and Down Signals
The script calculates an Average True Range over a user-defined period, then multiplies it by a signal factor to form two bands around the HMA. When price crosses below the lower band, an up (buy) signal appears; when it crosses above the upper band, a down (sell) signal is shown.
d. Reversal Signals (B Labels)
Tracks when price transitions back toward the main HMA from an extreme zone. When enabled, these reversal points are labeled with a B and can help traders see potential turning points or mean-reversion setups.
e. VWAP Bands
An optional Volume Weighted Average Price ribbon that plots above or below the HMA, indicating bullish or bearish conditions relative to a volume-weighted price benchmark. This can also act as a kind of support/ resistance.
7. User Inputs
a. HMA Length
Controls how quickly the moving average responds to price changes. Shorter lengths react faster but can lead to more frequent signals, whereas longer lengths produce smoother lines.
b. Source
Specifies the price input, such as close or an alternative source, for the calculation. This can help align the HMA with specific trading strategies.
c. ATR Length and Signal Multiplier
Defines how the script calculates average volatility and sets thresholds for buy or sell alerts. Adjusting these values can help filter out noise or highlight more aggressive signals.
d. Slope Index
Determines how many bars to look back for detecting slope direction, influencing how sensitive the slope coloring is to small fluctuations.
e. Show Buy and Sell Signals, Reversal Signals, and VWAP
Lets users toggle the display of these features. Turning off certain elements can reduce chart clutter if traders prefer a simpler layout.
8. Calculation Process
The script’s calculation follows a step-by-step approach. It first computes two Weighted Moving Averages of the selected price source, one over half the specified length and one over the full length. It then combines these using 2*wma1 minus wma2 to reduce lag, followed by applying another weighted average using the square root of the length. Simultaneously, it computes the ATR for a user-defined period. By multiplying ATR by the signal multiplier, it establishes upper and lower bands around the HMA, where crossovers generate buy (up) or sell (down) signals. The script can also plot reversal signals (B labels) when price crosses back from these bands in the opposite direction. For the optional VWAP feature, Pine Script’s ta.vwap function is used, and differences between the HMA and VWAP levels determine the color and opacity of the ribbon.
9. Signal Generation and Filtering
The ATR-based thresholds reduce the influence of small, inconsequential price swings. When price falls below the lower band, the script issues an up (buy) signal. If price breaks above the upper band, a down (sell) signal appears. These signals are visible through labels placed near the bars. Reversal signals, labeled with B, can be turned on to help detect when price retraces from an extended area back toward the main HMA line. Traders can disable or enable these signals to match their preferred level of chart detail or risk tolerance.
10. Visualization on the Chart
The Zero HMA Lag Trend Suite aims for visual clarity. The HMA line is plotted multiple times with increasing transparency to create a gradient effect. Turquoise gradients indicate upward slopes, and magenta gradients signify downward slopes. Bar coloring can be configured to align with the slope direction, providing quick insight into current momentum. When enabled, buy or sell labels are placed under or above the bars as price crosses the ATR-defined boundaries. If the reversal option is active, B labels appear around areas where price changes direction. The optional VWAP ribbons form background bands, using distinct coloration to signal whether price is above or below the volume-weighted metric.
11. Market Adaptability
Because the script’s parameters (HMA length, ATR length, signal multiplier, and slope index) are user-configurable, it can adapt to a wide range of markets and timeframes. Intraday traders may prefer a shorter HMA length for quick signals, while swing or position traders might use a longer HMA length to filter out short-lived price changes. The source setting can also be adjusted, allowing for specialized data inputs beyond just close or open values.
12. Risk Management Considerations
The script’s signals and labels are based on past price data and volatility readings, and they do not guarantee profitable outcomes. Sharp market reversals or unforeseen fundamental events can produce false signals. Traders should combine this tool with broader risk management strategies, including stop-loss placement, position sizing, and independent market analyses. The Zero HMA Lag Trend Suite can help highlight potential opportunities, but it should not be relied upon as the sole basis for trade decisions.
13. Combining with Other Tools
Many traders choose to verify signals from the Zero HMA Lag Trend Suite using popular indicators like the Relative Strength Index (RSI), Moving Average Convergence Divergence (MACD), or even simple volume-based metrics to confirm whether a price movement has sufficient momentum. Conventional techniques such as support and resistance levels, chart patterns, or candlestick analysis can also supplement signals generated by the script’s up, down, or reversal B labels.
14. Parameter Customization and Examples
a. Short-Term Day Trading
Using a shorter HMA length (for instance, 9 or 14) and a slightly higher ATR multiplier might provide timely buy and sell signals, though it may also produce more whipsaws in choppy markets.
b. Swing or Position Trading
Selecting a longer HMA length (such as 50 or 100) with a moderate ATR multiplier can help users track more significant and sustained market moves, potentially reducing the effect of minor fluctuations.
c. Multiple Timeframe Blends
Some traders load two versions of the indicator on the same chart, one for short-term signals (with frequent B label reversals) and another for the broader trend direction, aligning entry and exit decisions with the bigger picture.
15. Realistic Expectations
Even though the Hull Moving Average helps minimize lag and the script incorporates volatility-based filters and optional VWAP overlays, it cannot predict future market behavior with complete accuracy. Periods of low liquidity or sudden market shocks can still lead to signals that do not reflect longer-term trends. Frequent parameter review and manual confirmation are advised before executing trades based solely on the script’s outputs.
16. Theoretical Background
The Hull Moving Average formula aims to balance smoothness with reactivity, accomplished by combining Weighted Moving Averages at varying lengths. By subtracting a slower average from a faster one and then applying another smoothing step with the square root of the original length, the HMA is designed to respond more promptly to price changes than typical exponential or simple moving averages. The ATR component, introduced by J. Welles Wilder, calculates the average range of price movement over a user-defined period, allowing the script to assess volatility and adapt signals accordingly. VWAP provides a volume-weighted benchmark that many institutional traders track to gauge fair intraday value.
17. Originality and Uniqueness
Although multiple HMA-based indicators can be found, Uptrick: Zero Lag HMA Trend Suite sets itself apart by merging slope-based coloring, ATR thresholds, VWAP ribbons, up or down labels, and optional reversal signals all in one cohesive platform. This synergy aims to reduce chart clutter while still giving traders a comprehensive look at trend direction, volatility, and volume-based sentiment.
18. Summary
Uptrick: Zero Lag HMA Trend Suite is a specialized trading script designed to highlight potential market trends and reversals with minimal delay. It leverages the Hull Moving Average for an adaptive yet smooth price line, pairs ATR-based thresholds for detecting possible breakouts or dips, and provides VWAP-based ribbons for added volume-weighted context. Traders can further refine their entries and exits by enabling up or down signals and reversal labels (B) where price may revert toward the HMA. Suitable for a wide range of timeframes and instrument types, the script encourages a disciplined approach to trade management and risk control.
19. Disclaimer
This script is provided for informational and educational purposes only. Trading and investing involve significant financial risk, and no indicator can guarantee success under all conditions. Users should practice robust risk management, including the placement of stop losses and position sizing, and should confirm signals with additional analysis tools. The developer of this script assumes no liability for any trading decisions or outcomes resulting from its use.

[blackcat] L1 Banker Move█ OVERVIEW
The Pine Script is an indicator designed to analyze market signals for institutional and short-term investors. It calculates and plots three main signals: Institutional Signal, Institutional Build, and Short-Term Investor Signal. The script uses a combination of price, volume, and moving average data to generate these signals, which can help traders identify potential buying or selling opportunities.
█ LOGICAL FRAMEWORK
The script is structured into several main sections:
1 — Input Parameters
The script does not explicitly define any input parameters, relying on default values for calculations.
2 — Custom Functions
• reference_value(values, length) : Retrieves the first non-NA value from a specified number of past values.
• calculate_institutional_and_short_term_signals(low, close, open, volume) : Calculates the institutional and short-term investor signals based on price, volume, and moving average data.
3 — Calculations
• Price and Volume Metrics: The script calculates various smoothed price changes, lowest and highest values over different periods, and volume-weighted prices.
• Moving Averages: It computes simple moving averages (SMA) and exponential moving averages (EMA) for different periods.
• RSI Calculation: The script calculates a custom RSI for different periods.
• Signal Generation: It generates the institutional and short-term investor signals based on the calculated metrics.
4 — Plotting
The script plots the three main signals on the chart using the plot function.
The flow of data and logic is as follows:
• The reference_value function is used to find reference values for calculations.
• The calculate_institutional_and_short_term_signals function performs the core calculations and returns the institutional and short-term investor signals.
• The main script calls this function and plots the results.
█ CUSTOM FUNCTIONS
1 — reference_value(values, length)
• Purpose : Retrieves the first non-NA value from a specified number of past values.
• Parameters :
• values: An array of values.
• length: The number of past values to consider.
• Return Value : The first non-NA value found or na if no valid value is found.
• Functionality : Iterates through the specified number of past values and returns the first non-NA value.
2 — calculate_institutional_and_short_term_signals(low, close, open, volume)
• Purpose : Calculates the institutional and short-term investor signals based on price, volume, and moving average data.
• Parameters :
• low: Low price series.
• close: Close price series.
• open: Open price series.
• volume: Volume series.
• Return Values :
• institutional_signal: The institutional signal.
• institutional_build: The institutional build signal.
• short_term_investor_signal: The short-term investor signal.
• Functionality :
• Computes various price and volume metrics.
• Calculates moving averages and volume-weighted prices.
• Generates the institutional and short-term investor signals based on these metrics.
█ KEY POINTS AND TECHNIQUES
1 — Advanced Pine Script Features
• Custom Functions: The script defines and uses custom functions to encapsulate complex logic.
• Conditional Statements: Extensive use of iff and if statements to control the flow of calculations.
• Looping Constructs: The for loop in reference_value function to iterate through past values.
• Exponential Moving Averages (EMA): Used to smooth out price and signal changes.
• Volume-Weighted Price (VWP): Calculated to factor in volume in price analysis.
• Custom RSI Calculation: A custom RSI formula is used, which differs from the standard RSI calculation.
2 — Optimization Techniques
• Efficient Data Handling: The reference_value function efficiently finds the first non-NA value without unnecessary computations.
• Smoothed Signals: Using EMAs to smooth out noisy signals for better trend identification.
3 — Unique Approaches
• Combination of Metrics: The script combines multiple metrics (price, volume, moving averages, and custom RSI) to generate comprehensive signals.
• Institutional Build Signal: A unique approach to detect institutional activity by comparing current price levels with historical lows and smoothed price changes.
█ EXTENDED KNOWLEDGE AND APPLICATIONS
1 — Potential Modifications
• Input Parameters: Add input parameters to allow users to customize the lengths and thresholds used in the calculations.
• Strategy Version: Convert the indicator into a strategy by adding buy/sell signals based on the generated signals.
• Additional Indicators: Integrate other technical indicators (e.g., MACD, Bollinger Bands) to enhance the signal generation process.
2 — Similar Trading Scenarios
• Institutional Activity Analysis: Use similar techniques to analyze institutional activity in other markets or assets.
• Volume Analysis: Apply the volume-weighted price and volume analysis to identify significant price movements.
• Multi-Timeframe Analysis: Extend the script to analyze signals across multiple timeframes for a more robust trading strategy.
3 — Related Pine Script Concepts
• Pine Script Functions: Understanding how to define and use custom functions effectively.
• Conditional Logic: Mastering the use of iff and if statements for complex logic.
• Looping Constructs: Familiarity with for loops for iterating through data.
• Moving Averages: Knowledge of different types of moving averages and their applications.
• Volume Analysis: Techniques for incorporating volume data into price analysis.

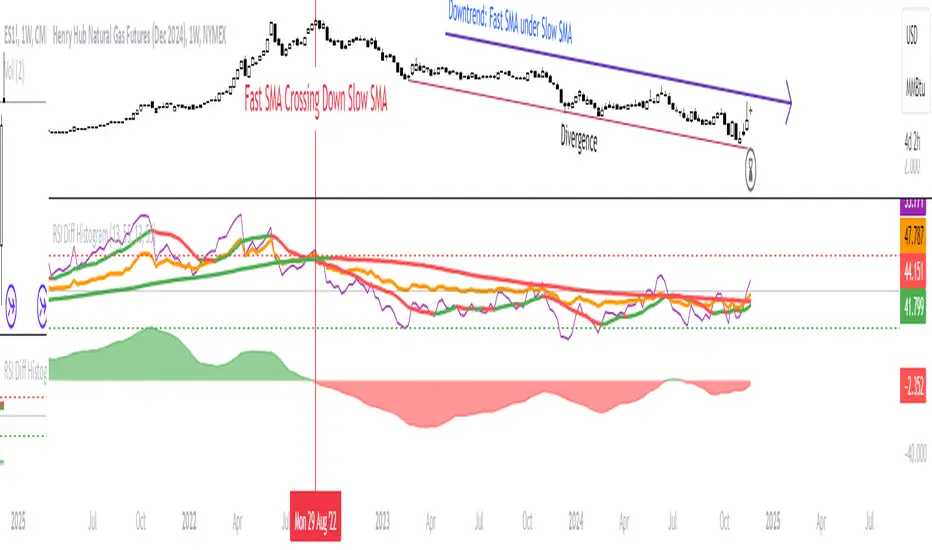
RSI Difference (Fast and Slow)Introduction
Oscillators like the RSI are fundamental tools for identifying trends in financial markets. Their ability to measure price momentum allows traders to detect overbought, oversold levels, and divergences, anticipating trend changes. Are there ways to improve the use of traditional RSI? How can we obtain more detailed information about current trends? This indicator answers these questions by expanding the functionalities of the traditional RSI and offering an additional tool for analysis.
How does it work?
This indicator provides a framework for trend analysis based on the following setup:
Fast RSI
Slow RSI
SMA of the fast RSI
SMA of the slow RSI
Histogram
Custom Indicator Settings
My preferred configuration is based on the 13 and 55 moving averages. The rest of the setup is as follows:
I typically use the 13 and 55 moving averages to configure both the RSI and short- and long-term moving averages.
Interpretation and Signals: Including a Long-Period RSI
Including a long-period RSI helps identify key patterns in market behavior. Crossovers between the two can be used to establish entry patterns:
If the fast RSI crosses above the slow RSI, this could indicate a long-entry pattern.
If the fast RSI crosses below the slow RSI, this could indicate a short-entry pattern.
Interpretation and Signals: Including Moving Averages
Including moving averages for both the short- and long-period RSI can help identify the base trend of the movement and, consequently:
Avoid false signals.
Trade in favor of the trend.
A simple way to start working with these is to use the crossover of the moving averages to identify the current trend:
If the short-period SMA is above the long-period SMA, the trend is bullish.
If the short-period SMA is below the long-period SMA, the trend is bearish.
Interpretation and Signals: The Histogram
The histogram represents the difference between the moving averages. If the histogram is positive, the short average is above the long average. If the histogram is below zero, the short average is below the long average. Divergences with price provide signals of potential exhaustion in the movement, indicating a possible reversal.
Indicator Details
This indicator builds upon the traditional RSI by integrating additional features that enhance its utility for traders. Here’s how each component is calculated and how they contribute to the originality of the script:
Fast RSI and Slow RSI: The fast RSI is calculated using a shorter lookback period, allowing it to capture rapid changes in momentum. The slow RSI uses a longer period to smooth out fluctuations and provide a broader view of the trend. These two RSIs work together to identify significant momentum shifts.
SMA of RSI values: The simple moving averages (SMA) of the fast and slow RSI help filter out noise and provide clear crossover signals. The SMAs are calculated using standard formulas but applied to the RSI values rather than price data, which adds a layer of insight into momentum trends.
Histogram calculation: The histogram represents the difference between the SMA of the fast RSI and the SMA of the slow RSI. This value gives a visual representation of the convergence or divergence of momentum. When the histogram crosses zero, it signifies a potential shift in the underlying trend.
This indicator combines multiple layers of analysis: fast and slow momentum, trend confirmation through SMAs, and divergence detection via the histogram. This multi-dimensional approach provides traders with a more comprehensive tool for trend analysis and decision-making.
Conclusion
This article has explored how to use this indicator to identify trends, leverage entry patterns, and analyze divergences by combining the fast RSI, slow RSI, their moving averages, and a histogram. Additionally, I’ve detailed how I usually interpret this indicator:
Identifying RSI patterns to anticipate momentum changes.
Using SMAs to confirm base trends.
Leveraging the histogram to detect divergences and potential price reversals.
MAC Investor V3.0 [VK]This indicator combines multiple functionalities to assist traders in making informed decisions. It primarily uses Heikin Ashi candles, Moving Averages, and a Price Action Channel (PAC) to provide signals for entering and exiting trades. Here's a detailed breakdown:
Inputs
MAC Length: Sets the length for the PAC calculation.
Use Heikin Ashi Candles: Option to use Heikin Ashi candles for calculations.
Show Coloured Bars around MAC: Option to color bars based on their relation to the PAC.
Show Long/Short Signals: Options to display long and short signals.
Show MAs? : Option to show moving averages on the chart.
Show MAs Trend at the Bottom?: Option to show trend signals at the bottom of the chart.
MA Lengths: Length settings for three different moving averages.
Change MA Color Based on Direction?: Option to change the color of moving averages based on trend direction.
MA Higher TimeFrame: Allows setting a higher timeframe for moving averages.
Show SL-TP Lines: Option to display Stop Loss and Take Profit lines.
SL/TP Percentages: Set the percentages for Stop Loss and three levels of Take Profit.
Calculations and Features
Heikin Ashi Candles: Calculations are based on Heikin Ashi candle data if selected.
Price Action Channel (PAC): Uses Exponential Moving Averages (EMA) of the high, low, and close to create a channel.
Bar Coloring: Colors the bars based on their position relative to the PAC.
Long and Short Signals: Uses crossovers of the close price and PAC upper/lower bands to generate signals.
Moving Averages (MA): Plots three moving averages and colors them based on their trend direction.
Overall Trend Indicators: Uses triangles at the bottom of the chart to show the overall trend of the MAs.
Stop Loss and Take Profit Levels: Calculates and plots these levels based on user-defined percentages from the entry price.
Alerts: Provides alerts for long and short signals.
Use Cases and How to Use
Identifying Trends: The PAC helps to identify the trend direction. If the closing price is above the PAC upper band, it suggests an uptrend; if below the lower band, it suggests a downtrend.
Entering Trades: Use the long and short signals to enter trades. A long signal is generated when the closing price crosses above the PAC upper band, and a short signal is generated when it crosses below the PAC lower band.
Exit Strategies: Utilize the Stop Loss (SL) and Take Profit (TP) levels to manage risk and lock in profits. These levels are automatically calculated based on the entry price and user-defined percentages.
Trend Confirmation with MAs: The moving averages provide additional confirmation of the trend. When all three MAs are trending in the same direction (e.g., all green for an uptrend), it adds confidence to the trade signal.
Overall Trend Indicators: The triangles at the bottom of the chart show the overall trend direction of the MAs:
Green Triangle: All three MAs are trending upwards, indicating a strong uptrend.
Red Triangle: All three MAs are trending downwards, indicating a strong downtrend.
Yellow Triangle: Mixed signals from the MAs, indicating no clear trend.
Bar Coloring for Quick Analysis: The colored bars give a quick visual cue about the market condition, aiding in faster decision-making.
Alerts: Set up alerts to get notified when a long or short signal is generated, allowing you to act promptly without constantly monitoring the chart.
Maximizing Profit
To maximize profit with this indicator:
Follow the Signals: Use the long and short signals to time your entries. Ensure you follow the trend indicated by the PAC and MAs.
Risk Management: Always set your Stop Loss and Take Profit levels to manage risk. This will help you cut losses early and secure profits.
Confirm with MAs: Look for confirmation from the moving averages. When all MAs align with the signal, it indicates a stronger trend.
Overall Trend Indicators: Pay attention to the triangles at the bottom for overall trend confirmation. Only enter trades when the overall trend is in your favor.
Heikin Ashi for Smoothing: Use Heikin Ashi candles for smoother trends and fewer false signals.
Backtesting: Test the indicator on historical data to understand its performance and adjust settings as necessary.
Adapt to Market Conditions: Adjust the lengths of PAC and MAs based on the market's volatility and timeframe you are trading on.
How to Use the Indicator
Add to Chart: Add the indicator to your TradingView chart.
Configure Settings: Customize the input settings to fit your trading strategy and timeframe.
Monitor Signals: Watch for long and short signals and observe the trend direction with the PAC and MAs.
Check Overall Trend: Look at the triangles at the bottom of the chart to see the overall trend direction of the MAs.
Set Alerts: Configure alerts to get notified of new signals.
Manage Trades: Use the SL and TP levels to manage your trades effectively.

TOMMAR#TOMMAR #MultiMovingAverages #MMAR
Dear fellow traders, this is Tommy, and today I'd like to introduce you to the Multi-Moving Averages Ribbon (MMAR) indicator, which I believe to be one of the best MMAR indicators available on TradingView. Moving Averages is a popular technical analysis tool used to smooth out price data by creating an average of past price data points over a specified time period. They can be used to identify trends and provide a clearer view of price action, as well as generate buy and sell signals by observing crossovers between different moving average lines.
In the MMAR indicator, we have incorporated 12 different types of Moving Averages, including Simple Moving Averages (SMA), Exponential Moving Averages (EMA), Weighted Moving Averages (WMA), Hull Moving Averages (HMA), and Smoothed Moving Averages (SMMA), among others. This allows traders to choose the optimal type for their preferred trading commodities.
One common technique in technical analysis is using multiple Moving Averages with varying lengths, which provides a more comprehensive view of price action. By analyzing multiple Moving Averages with different timeframes, traders can better understand both short- and long-term trends and make more informed trading decisions. Some of the well-known combinations of multiple moving averages used by traders are (5, 9, 14, 21, 45), (6, 11, 16, 22, 51), [8, 13, 21, 55), (50, 100, 200), and (60, 120, 240).
Another way to gauge the strength of the market trend is to look for the arrangement of the Moving Averages. If they are in a sequential order, with the shortest on top and the longest on the bottom, it is most likely a bullish trend. On the other hand, if they are arranged in reverse order, with the shortest on the bottom and the longest on top, it is most likely a bearish trend. The 'Trend Light' in the indicator settings will automatically signal when the Moving Averages are in either an orderly or reverse arrangement.
Lastly, I have added a useful feature to the indicator: the 'MA Projection'. This feature projects and forecasts the Moving Averages in the future, allowing traders to easily identify confluence zones in future candlesticks. Please note that the projection levels may change in the case of extreme price action that significantly affects the Moving Averages.
This is free so any Tradingview users can use this indicator. Just search TOMMAR in the indicator section located on top of the chart.
#TOMMAR #MultiMovingAverages #MMAR
안녕하세요 트레이더 여러분, 토미입니다. 오늘 여러분들에게 소개드릴 지표는 다양한 길이의 이동평균선 조합을 사용할 수 있는 MMAR (Multiple Moving Averages Ribbon)입니다. 아마 제가 만든 MMAR 지표가 트레이딩뷰에서 가장 쓸만할 겁니다. 이동평균선, 줄여서 이평선은 말 그대로 특정 기간 범위 내의 주가들을 평균한 값들로 이루어진 선입니다. 제가 이평선 관련된 강의 자료는 예전에 올려드린 바 있으니 더 자세한 내용이 궁금하신 분들은 아래 링크/이미지 클릭하시길 바랍니다.
본 지표는 Simple Moving Averages (SMA), Exponential Moving Averages (EMA), Weighted Moving Averages (WMA), Hull Moving Averages (HMA), 그리고 Smoothed Moving Averages (SMMA) 등을 포함해 총 12개 종류의 이평선 지표를 사용할 수 있습니다. 또한 각 이평선의 길이들도 하나하나 일일이 설정하실 수 있습니다. 예를 들어 요즘에 자주 보이는 이평선들의 조합이 , , , , 그리고 등등이 존재하는데 여러분의 취향에 맞게 설정하여 사용하시면 됩니다.
몇 가지 주요 기능에 대해서 설명 드리겠습니다. 설정에서 ‘Trend Light’를 키면 이평선들의 정배열 혹은 역배열 여부를 쉽게 볼 수 있습니다. 이평선이 정배열일때는 맨 아래의 이평선에 초록불이, 역배열일때는 맨 위의 이평선에 빨간불이 켜지며 둘 다 아닐 땐 아무 불도 켜지지 않습니다. 또한 ‘MA Projection’을 키면 이평선들의 미래 예측 값들을 확장해줍니다. 당연히 가격 변동이 갑자기 크게 나오면 이평선 예측 확장 레벨들이 확 바뀌겠죠.
지표창에 TOMMAR 검색하시거나 아래 즐겨찾기 인디케이터에 넣기 클릭하시면 누구나 사용하실 수 있습니다~ 여러분의 구독, 좋아요, 댓글은 저에게 큰 힘이 됩니다.

CT Moving Average Crossover IndicatorMoving Average Crossover Indicator
Here I present a moving average indicator with 9 user definable moving averages from which up to 5 pairs can be selected to show what prices would need to be closed at on the current bar to cross each individual pair.
I have put much emphasis here on simplicity of setting the parameters of the moving averages, selecting the crossover pairs and on the clarity of the displayed information in the optional “Moving Average Crossover Level” Information Box.
What Is a Moving Average (MA)?
According to Investopedia - “In statistics, a moving average is a calculation used to analyze data points by creating a series of averages of different subsets of the full data set.
In finance, a moving average (MA) is a stock indicator that is commonly used in technical analysis. The reason for calculating the moving average of a stock is to help smooth out the price data by creating a constantly updated average price.
By calculating the moving average, the impacts of random, short-term fluctuations on the price of a stock over a specified time-frame are mitigated.”
The user can set the color, type (SMA/EMA) and length of each of the 9 moving averages.
Then the user may choose 5 pairs of moving averages from the set of 9.
The script will then calculate the price needed to be crossed by the close of the current bar in order to crossover each of the user defined pairs and outputs the results as optional lineplots and/or an Infobox which shows the relevant information in a very clear way.
The user may switch the moving averages, crossover lineplots and infobox on and off easily with one click boxes in the settings menu.
The number of decimal places shown in the Infobox can be altered in the settings menu.
If the price required to cross a pair of moving averages is zero or less, the crossover level will display “Impossible” and the plots will plot at zero. (this helps ameliorate chart auto-focus issues)
Quoting a variety of online resources …….
Understanding Moving Averages (MA)
Moving averages are a simple, technical analysis tool. Moving averages are usually calculated to identify the trend direction of a stock or to determine its support and resistance levels. It is a trend-following—or lagging—indicator because it is based on past prices.
The longer the time period for the moving average, the greater the lag. So, a 200-day moving average will have a much greater degree of lag than a 20-day MA because it contains prices for the past 200 days. The 50-day and 200-day moving average figures for stocks are widely followed by investors and traders and are considered to be important trading signals.
Moving averages are a totally customizable indicator, which means that an investor can freely choose whatever time frame they want when calculating an average. The most common time periods used in moving averages are 15, 20, 30, 50, 100, and 200 days. The shorter the time span used to create the average, the more sensitive it will be to price changes. The longer the time span, the less sensitive the average will be.
Investors may choose different time periods of varying lengths to calculate moving averages based on their trading objectives. Shorter moving averages are typically used for short-term trading, while longer-term moving averages are more suited for long-term investors.
There is no correct time frame to use when setting up your moving averages. The best way to figure out which one works best for you is to experiment with a number of different time periods until you find one that fits your strategy.
Predicting trends in the stock market is no simple process. While it is impossible to predict the future movement of a specific stock, using technical analysis and research can help you make better predictions.
A rising moving average indicates that the security is in an uptrend, while a declining moving average indicates that it is in a downtrend. Similarly, upward momentum is confirmed with a bullish crossover, which occurs when a short-term moving average crosses above a longer-term moving average. Conversely, downward momentum is confirmed with a bearish crossover, which occurs when a short-term moving average crosses below a longer-term moving average.
Types of Moving Averages
Simple Moving Average (SMA)
The simplest form of a moving average, known as a simple moving average (SMA), is calculated by taking the arithmetic mean of a given set of values. In other words, a set of numbers–or prices in the case of financial instruments–are added together and then divided by the number of prices in the set.
Exponential Moving Average (EMA)
The exponential moving average is a type of moving average that gives more weight to recent prices in an attempt to make it more responsive to new information.
To calculate an EMA, you must first compute the simple moving average (SMA) over a particular time period. Next, you must calculate the multiplier for weighting the EMA (referred to as the "smoothing factor"), which typically follows the formula: 2/(selected time period + 1). So, for a 20-day moving average, the multiplier would be 2/(20+1)= 0.0952. Then you use the smoothing factor combined with the previous EMA to arrive at the current value.
The EMA thus gives a higher weighting to recent prices, while the SMA assigns equal weighting to all values.

Signal Hunter Pro - GKDXLSignal Hunter Pro - GKDXL combines four powerful technical indicators with trend strength filtering and volume confirmation to generate reliable BUY/SELL signals. This indicator is perfect for traders who want a systematic approach to market analysis without the noise of conflicting signals.
🔧 Core Features
📈 Multi-Indicator Signal System
Moving Averages: EMA 20, EMA 50, and SMA 200 for trend analysis
Bollinger Bands: Dynamic support/resistance with price momentum detection
RSI: Enhanced RSI logic with smoothing and multi-zone analysis
MACD: Traditional MACD with signal line crossovers and zero-line analysis
🎛️ Advanced Filtering System
ADX Trend Strength Filter: Only signals when trend strength exceeds threshold
Volume Confirmation: Ensures signals occur with adequate volume participation
Multi-Timeframe Logic: Works on any timeframe from 1m to 1D and beyond
🚨 Intelligent Signal Generation
Requires 3 out of 4 indicators to align for signal confirmation
Separate bullish and bearish signal conditions
Real-time signal strength scoring (1/4 to 4/4)
Built-in alert system for automated notifications
⚙️ Customizable Parameters
📊 Technical Settings
Moving Averages: Adjustable EMA and SMA periods
Bollinger Bands: Configurable length and multiplier
RSI: Customizable length, smoothing, and overbought/oversold levels
MACD: Flexible fast, slow, and signal line settings
🎯 Risk Management
Risk Percentage: Set your risk per trade (0.1% to 10%)
Reward Ratio: Configure risk-to-reward ratios (1:1 to 1:5)
ADX Threshold: Control minimum trend strength requirements
🖥️ Display Options
Indicator Visibility: Toggle individual indicators on/off
Information Table: Optional detailed status table (off by default)
Volume Analysis: Real-time volume vs. average comparison
🎨 Visual Elements
📈 Chart Indicators
EMA Lines: Blue (20) and Orange (50) exponential moving averages
SMA 200: Gray long-term trend line
Bollinger Bands: Upper/lower bands with semi-transparent fill
Clean Interface: Minimal visual clutter for clear analysis
📋 Information Table (Optional)
Real-time indicator status with ✓/✗/— symbols
Current signal strength and direction
ADX trend strength measurement
Volume confirmation status
No-signal reasons when conditions aren't met
🔔 Alert System
📢 Three Alert Types
BUY Signal: Triggered when 3+ indicators align bullishly
SELL Signal: Triggered when 3+ indicators align bearishly
General Alert: Any signal detection for broader monitoring
📱 Alert Messages
Clear, actionable alert text
Includes indicator name for easy identification
Compatible with webhook integrations
🎯 How It Works
📊 Signal Logic
Indicator Assessment: Each of the 4 indicators is evaluated as Bullish/Bearish/Neutral
Consensus Building: Counts aligned indicators (minimum 3 required)
Filter Application: Applies trend strength and volume filters
Signal Generation: Generates BUY/SELL when all conditions are met
🔍 Indicator States
Moving Averages: Price position, EMA alignment, and crossovers
Bollinger Bands: Price relative to bands and momentum shifts
RSI: Multi-zone analysis with momentum and crossover detection
MACD: Signal line crossovers and zero-line positioning
🎉 Why Choose Signal Hunter Pro?
✅ Multi-Indicator Confirmation reduces false signals
✅ Trend Strength Filtering improves win rate
✅ Volume Confirmation ensures market participation
✅ Customizable Parameters adapt to any trading style
✅ Clean Visual Design doesn't clutter your charts
✅ Professional Alert System for automated trading
✅ No Repainting - reliable historical signals
✅ Works on All Timeframes from scalping to investing

Distance From moving averageDistance From Moving Average is designed to help traders visualize the deviation of the current price from a specified moving average. Users can select from four different types of moving averages: Simple Moving Average (SMA), Exponential Moving Average (EMA), Weighted Moving Average (WMA), and Hull Moving Average (HMA).
Key Features:
User-Friendly Input Options:
Choose the type of moving average from a dropdown menu.
Set the length of the moving average, with a default value of 200.
Custom Moving Average Calculations:
The script computes the selected moving average using the appropriate mathematical formula, allowing for versatile analysis based on individual trading strategies.
Distance Calculation:
The indicator calculates the distance between the current price and the chosen moving average, providing insight into market momentum. A positive value indicates that the price is above the moving average, while a negative value shows it is below.
Visual Representation:
The distance is plotted on the chart, with color coding:
Lime: Indicates that the price is above the moving average (bullish sentiment).
Red: Indicates that the price is below the moving average (bearish sentiment).
Customization:
Users can further customize the appearance of the plotted line, enhancing clarity and visibility on the chart.
This indicator is particularly useful for traders looking to gauge market conditions and make informed decisions based on the relationship between current prices and key moving averages.
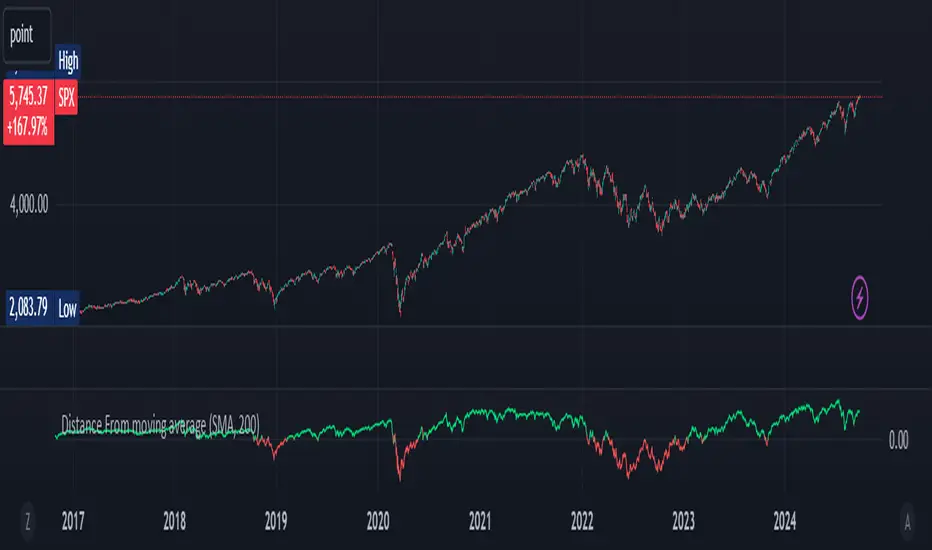
Bull Bear Power With EMA FilterDescription of Indicator:
This Pine Script indicator colors price bars based on the open price in relation to custom moving averages (EMA/SMA), Bull/Bear Power (BBPower), and an optional VWAP filter. The bar colors help identify bullish and bearish conditions with added visual cues for price positioning relative to VWAP.
Key Features:
Customizable Moving Averages (EMA/SMA):
The user can select between EMA or SMA for both short-term and long-term moving averages.
Default moving averages are set to 5 (short-term) and 9 (long-term) but can be adjusted by the user.
Bullish Condition (Blue or Purple Bars):
A bar is colored blue if the following conditions are met:
The open price is above both the short-term and long-term moving averages.
The short-term moving average (MA 1) is above the long-term moving average (MA 2).
BBPower (open price minus the 13-period EMA) is positive, indicating bullish strength.
If the VWAP filter is enabled and the price opens below VWAP, the bullish bars will turn purple.
Bearish Condition (Yellow or Orange Bars):
A bar is colored yellow if the following conditions are met:
The open price is below both the short-term and long-term moving averages.
The short-term moving average (MA 1) is below the long-term moving average (MA 2).
BBPower is negative or zero, indicating bearish market conditions.
If the VWAP filter is enabled and the price opens above VWAP, the bearish bars will turn orange.
VWAP Filter (Optional):
An optional filter allows the user to add VWAP (Volume-Weighted Average Price) to the bar coloring logic.
When the VWAP filter is enabled, it provides additional information about price positioning relative to VWAP, turning bullish bars purple and bearish bars orange depending on whether the price opens above or below VWAP.
Usage:
Bullish Trend: Look for blue or purple bars to identify potential bullish momentum.
Bearish Trend: Look for yellow or orange bars to spot bearish conditions in the market.
The indicator allows users to customize the length and type of moving averages (EMA or SMA), as well as decide whether to apply the VWAP filter.
This indicator provides traders with clear visual signals to quickly assess the strength of bullish or bearish conditions based on the price's position relative to custom moving averages, BBPower, and VWAP, helping with trend identification and potential trade setups.
MTF HalfTrendIntroduction
A half-trend indicator is a technical analysis tool that uses moving averages and price data to find potential trend reversal and entry points in the form of graphical arrows showing market turning points.
The salient features of this indicator are:
- It uses the phenomenon of moving averages.
- It is a momentum indicator.
- It can indicate a trend change.
- It is capable of detecting a bullish or bearish trend reversal.
- It can signal to sell/buy.
- It is a real-time indicator.
Multi-Timeframe Application
A standout feature is its flexibility across timeframes. Traders have the liberty to choose any timeframe on the chart, enhancing the tool's versatility and making it suitable for both short-term and long-term analyses.
Principle of the Half Trend indicator
This indicator is based on the moving averages. The moving average is the average of the fluctuation or change in the price of an asset. These averages are taken for a time interval.
So, a half-trend indicator takes the moving averages phenomenon as its principle for working. The most commonly used moving averages in a half trend indicator are:
- Relative strength index (RSI)
- EMA (estimated moving average)
Components of a Half Trend indicator
There are two main components of a half trend indicator:
- Half trend line
- Arrows
- ATR lines
Half trend line
Half trend line represents this indicator on a candlestick chart. This line shows the trend of a chart in real-time. A half-trend line is based on the moving averages.
There are two further components of a half-trend line:
- Redline
- Blue line
A red line represents a bearish trend. When the half-trend line turns red, a trend is facing a dip. It is time for the bears to take control of the market. A bearish control of the market represents the domination of sellers in the market.
On the other hand, the blue line represents the bullish nature of the market. It tells a trader that the bullish sentiment of the market is prevailing. A bullish market means the number of buyers is significantly greater than the number of sellers.
Moreover, a trader can change these colors to his choice by customization.
Arrows
There are two types of arrows in this indicator which help a trader with the entry and exit points. These arrows are,
- Blue arrow
- Red arrow
A blue arrow signals a buying trade; on the other hand, a red arrow tells a trader about the selling of the assets. These arrows work with the moving average line to formulate a trading strategy.
The color of these arrows is changed if a trader desires so.
ATR lines
The ATR blue and red lines represent the Average True Range of the Half trend line. They may be used as stop loss or take profit levels.
Pros and Cons
Pros
- It is a very easy to eyes indicator.
- This is a very useful friendly indicator.
- It provides sufficient information to beginner traders.
- It provides sufficient information for entry points in a trade.
- A half-trend indicator provides a good exit strategy for a trader.
- It provides information about market reversals.
- It helps a trader to find a bullish and bearish sentiment in the market.
Cons
- It is a real-time indicator. So, it can lag.
- The lagging of this indicator can lead to miss opportunities.
- The most advanced and professional traders may not rely on this indicator for crucial trading decisions.
- The lagging of this indicator can predict false reversals of the market.
- It can create false signals.
- It requires the confluence of the other technical tools for a better success ratio.
Settings for Half Trend indicator
The default settings for half trend indicator are:
Amplitude = 2
Channel deviation = 2
Different markets or financial instruments may require different settings for optimal execution.
Amplitude: The degree that the Half trend line takes the internal variables into consideration. The higher the number, the fewer trades. The default value is 2.
Channel deviation: The ATR value calculation from the Half trend line. The default value is 2.
Trading strategy
It is an effective indicator in terms of strategy formation for a trading setup. The new and beginner trades can take benefit from this indicator for the formulation of a good trading setup. This indicator also helps seasoned and professional traders formulate a good trading setup with other technical tools.
The trading strategy involving a half-trend indicator is divided into three parts:
- Entry and exit
- Risk management
- Take profit
Entry and exit
It is an effective indicator that provides sufficient information about the entry and exit points in a trading setup. The profit of a trader is directly proportional to the appropriate entry and exit points. So, it is a crucial step in any trading setup.
The blue and red arrows provide information about the entry and exit points in a trading setup. Furthermore, the entry and exit for the bullish and bearish setups are as follows.
Entry and exit for a bullish setup
If a blue arrow appears under the half-trend line, it means the bullish sentiment of the market is getting stronger in the future. So, it is a signal for entry in a bullish setup.
As the red arrow appears on the chart, it is a signal to exit your trade. The red arrow represents a reversal in the market, so it is a good opportunity to close your trade in a bullish setup.
Entry and exit for a bearish setup
Suppose a red arrow appears above the red moving average line. It is a good opportunity to enter a trade in a bearish setup. The red line represents that sooner the sellers are going to take control and the value of the asset is about to face a dip. So it is the best time to make your move.
As the opposite arrow appears in the chart, it is time to exit from a bearish trade setup.
Re-entering a position
Bullish setup
- The half-trend line is blue.
- At least one candle closes below the blue half-trend line.
- Enter on the candle that closes above the blue half-trend line.
Bearish setup
- The half-trend line is red.
- At least one candle closes above the red half-trend line.
- Enter on the candle that closes below the red half-trend line.
Risk management
Risk management is an integral part of a trading setup. It is an important step to protect your potential profits and losses.
When trading in a bullish market, place the stop loss at the prior swing low. It will help you to cut your losses in case the prices move to the lower end.
In the case of a bearish market, place your stop loss above the prior swing high.
A trader may trail the stop loss using the ATR lines.
The new trader often makes mistakes in the placement of the stop loss. If you don’t place the stop loss at an appropriate point. It can drain your bank account and ruin your trading experience. Is is recommended not to risk more than 2% of your trading account, per trade.
Take profit
The blue ATR line may be used as one take profit level on a bullish setup followed by the previous swing high. The signal reversal would indicate the final take profit and closing of any position.
The red ATR line may be used as one take profit level on a bearish setup followed by the previous swing low. The signal reversal would indicate the final take profit and closing of any position.
Conclusion
A half trend indicator is a decent indicator that can transform your trading experience. It is a dual indicator that is based on the moving averages as well as helps you to form a trading strategy. If you are a new trader, this indicator can help you to learn and flourish in the trading universe. If you are a seasoned trader, I recommend you use this indicator with other technical analysis tools to enhance your success ratio.
All credits go to:
- @everget the original creator of this indicator (I just added the MTF capability).
- Ali Muhammad original author of much of the description used.

Moving Average Rainbow (Stormer)This strategy is based and shown by trader and investor Alexandre Wolwacz "Stormer".
Overview
The strategy uses 12 moving averages (default EMA) to identify trends and generate trading signals opening positions.
Allowing to select the type of moving average and length to be used.
The conditions includes relationship between moving averages, the position of the current price relative to the moving averages, and the occurrence of certain price patterns.
Calculation
The mean moving averages is calculated by adding all the 12 moving averages and dividing by 12, the value is used to help to identify trend and possible condition to open position.
The 12 moving averages is spliced by 3 ranges, initial range (moving average lines 1 to 4), middle range (moving average lines 5 to 8) and end range (moving average lines 9 to 12). These ranges helps to identify potential trend and market turn over.
The moving average touch price is a relationship between the low price (uptrend) or high price (downtrend) with the moving average lines, it identifies where the price (low/high) has reached the the moving average line. Fetching the value to help for opening position, set stop loss and take profit.
Since the stop loss is based and set from the previous moving average touch price value, when position is about to be open and setting the stop loss value, there is a verification to check both current and previous moving average touch price to recalculate the stop loss value.
The turnover trend checks for a possible market turnover event, setting up a new profit target, this setting when enabled is to be helpful when a turnover occurs against the position to exit position with some profit based on highest high price if long or lowest low price if short.
The turnover signal is similar to turnover trend. The difference is that when this setting is enabled and it triggers, it simply exit the current position and opens up a reverse position, long goes short and short goes long. And there is an complement optional that checks current price exit profitable.
Entry Position
Long Position:
Price is higher than the mean moving averages. Meaning possible uptrend.
The lines of the middle range from the moving averages are in increasing order. Meaning possible uptrend.
The current high pierced up previous high.
Fetch the previous value of the moving average touch price. Meaning the low price has touched one of the moving average lines, which that value is conditioning to open position.
Short Position:
Price is lower than the mean moving averages. Meaning possible downtrend.
The lines of the middle range from the moving averages are in decreasing order. Meaning possible downtrend.
The current low pierced down previous low.
Fetch the previous value of the moving average touch price. Meaning the high price has touched one of the moving average lines, which that value is conditioning to open position.
Risk Management
Stop Loss:
The stop loss is based from the previous moving average touch price value, high price for short and low price for long or occurs an verification to check for both current and previous moving average touch price value and a recalculation is done to set the stop loss.
Take Profit:
According to the author, the profit target should be at least 1:1.6 the risk, so to have the strategy mathematically positive.
The profit target is configured input, can be increased or decreased.
It calculates the take profit based on the price of the stop loss with the profit target input.
Turnover Trend
Long Position:
The moving averages initial range lines signals a possible market turnover. Meaning long might be going short.
Fetches the highest high hit since the opening of the position, setting that value to the new profit target.
Short Position:
The moving averages initial range lines signals a possible market turnover. Meaning short might be going long.
Fetches the lowest low hit since the opening of the position, setting that value to the new profit target.

Zero Lag Moving Average with Gaussian weightsIntroduction
The Zero Lag Moving Average (ZLMA) is a powerful technical indicator that aims to eliminate the lag inherent in traditional moving averages. This post provides a comprehensive exploration of the ZLMA with Gaussian Weights (GWMA) indicator, discussing the concepts, the calculations, and its application in trading.
Concepts
Zero Lag Moving Average (ZLMA): A ZLMA is an advanced moving average designed to reduce the lag in price movements associated with conventional moving averages. This reduction in lag enables traders to make more informed decisions based on the most recent price data.
Gaussian Weights: Gaussian weights are derived from the Gaussian function, which is a mathematical function used to calculate probabilities in a normal distribution. The Gaussian function is smooth, symmetric, and has a bell-shaped curve. In this context, Gaussian weights are used to calculate the weighted average of a series of data points.
Why Gaussian Weights are Beneficial
Gaussian Weights offer several advantages in comparison to traditional moving averages. One of the main reasons for using Gaussian Weights is to address the issue of lag, which is commonly associated with simple and exponential moving averages. By reducing lag, traders can make more informed decisions based on up-to-date information.
Another advantage of Gaussian Weights is their mathematical foundation, which is rooted in the Gaussian function. This function describes the normal distribution in probability theory and statistics. The smooth and symmetric bell-shaped curve of Gaussian Weights enables a more refined approach to handling data points, resulting in a more responsive and accurate moving average.
While exponential moving averages (EMAs) also assign more weight to recent data points, they can still exhibit some lag. Gaussian Weights, on the other hand, offer a smoother and more adaptive solution to different market conditions. By adjusting the smoothing period, traders can tailor the Gaussian Weights to their specific needs, making them a versatile tool for various trading strategies.
In summary, Gaussian Weights provide a valuable alternative to traditional moving averages due to their ability to reduce lag, their strong mathematical foundation, and their adaptability to different market conditions. These benefits make Gaussian Weights a worthwhile consideration for traders looking to enhance their trading strategies.
Calculations
The ZLMA with GWMA consists of two main calculations:
Gaussian Weight Calculation: The Gaussian weight for a given 'k' and 'smooth_per' is calculated using the standard deviation (sigma) and the exponent part of the Gaussian function.
Zero-Lag GWMA Calculation: The zero-lag GWMA is calculated using a source buffer, a Gaussian weighted moving average (gwma1), and an output array. The source buffer stores the input data, the gwma1 array stores the first Gaussian weighted moving average, and the output array stores the final zero-lag moving average.
Application in Trading
The ZLMA with GWMA indicator can be used to identify trends and potential entry/exit points in trading:
Trend Identification: When the ZLMA is above the price, it indicates a bearish trend, and when it is below the price, it indicates a bullish trend.
Entry/Exit Points: Traders can use crossovers between the ZLMA and price to identify potential entry and exit points. A long position could be taken when the price crosses above the ZLMA, and a short position could be taken when the price crosses below the ZLMA.
Conclusion
The Zero Lag Moving Average with Gaussian Weights is a powerful and versatile indicator that can be used in various trading strategies. By minimizing the lag associated with traditional moving averages, the ZLMA with GWMA provides traders with more accurate and timely information about price trends and potential trade opportunities.

+ Awesome OscillatorHi again. I have another indicator that I think is pretty neat.
I had the idea of creating an Awesome Oscillator for my Ultimate MA, just to see what kind of signals it might produce. If you're not familiar with my UMA you should go take a look at it, but essentially it is just an average of eight different length MAs, and if you're not familiar with the Awesome Oscillator, it is simply a comparison of the gap between two different moving averages (traditionally a 5 and 34 SMA) plotted as a histogram below the price chart. The two UMAs I was comparing in this version of the AO were the Hull and Simple. It looked okay, but I thought due to the nature of the movements of these MAs, that it was necessary to add something to this indicator in order to validate its creation and make it truly useful
I came to the idea of simply comparing the closing price of the asset on the chart to both the Awesome Oscillator moving averages. What this effectively does is gives you a representation of the moving averages on the chart (assuming you are using those same MAs) as an oscillator below the chart, enabling you to remove the moving averages from your price chart (obviously if you so choose). For me, I like this because fewer things on the chart makes it easier for me to see the price action and structure of the market clearly, or add something like a tWAP or two.
So, like, "how exactly would I use this indicator?"" you're probably asking.
First off: the Awesome Oscillator. By default it is a faintly shaded area, and is the least obvious part of the indicator.
Second: the plotted line. This is what I call the baseline (if you're familiar with NNFX, then you know what this is). It's basically your bias moving average (this means it defines, based on its lookback or length, whether momentum is bullish, bearish or ranging). In the case of the oscillator though, the ZERO line represents the baseline, and the oscillating line represents price in relation to it. If the line is above the zero line then price is above the moving average, and vice versa if it's below. The farther from the center line the baseline price is the greater the volatility,
Third: the histogram. This is the faster moving average, and same rules apply to it as your baseline. You can think of your fast moving average as a trade entry trigger, or an exit. It shows more immediate momentum shifts.
What's interesting about the relationships of all three of these things is that you don't actually NEED all three displayed. Because the Awesome Oscillator is a relation of your two moving averages, and the baseline and histogram are representational of the price relative to those two moving averages, you will notice that when the histogram (fast MA) flips up or down is the same exact time that the baseline price dips into the AO. The AO is effectively a moving average on that. So you can run this with just the AO and Baseline, or just the Baseline and fast MA histogram. To get started, I might recommend keeping your moving averages that you use on the chart just so you can see how this indicator works.
Both the fast MA and Baseline will show nice divergences (divergence indicator is added if you want to use it). And I've added Donchian Channels as upper and lower bounds that act neatly as support or resistance (especially effective if you're using my UMA with Bollinger Bands, or Magic Carpet Bands).
I've also done the usual colored candles thing, which gives you another great reason to get the moving averages off your chart. There are of course alerts for conditions that one might need to be alerted to as well.
Below are some images of different ways you might set these up using the default moving average/baseline settings. In all of these I've left the moving averages on the price chart (with the addition of a 233 SMA) so you can see the relationship between the indicators.
Right here is the indicator set up with just the awesome oscillator and baseline price. Gives a cleaner overall look. You can see that every time the baseline crosses the awesome oscillator is when price crosses the 8 SMA. Candle colors are based on if candle closes above baseline or below.
This is the indicator set up without the awesome oscillator. Here you can see candle closes over the 8 SMA (fast moving average) are shown by the histogram. Candle coloring is still the same as the above image.
This image looks identical to the first, except that the candle coloring is different. This time it is based on the 8 SMA (same as the baseline entering the awesome oscillator).
And the final example image. This one depicts the awesome oscillator and the fast moving average histogram. Candle coloring is based on the awesome oscillator. This can be a great way to visualize momentum because the awesome oscillator is depicting the crossing of the moving averages. A lot of people poo-poo moving average crosses, but I'd say they're wrong. Well, they're right and wrong. Depends on the MAs you're using. The power in moving average crosses is in their ability to show bullish or bearish momentum (or ranging behavior if they continually cross over each other). If you're using slow moving averages, then crosses are often very late (hence so many people who don't know saying, "but moving average crosses are too laggy". Here you might try changing these and having the baseline be faster than the UMA, and actually plot on chart the UMA (or some other moving average). These are just some thoughts.
Anyway, I hope this indicator proves useful to you all. I think for anyone looking to look at price action a bit more, but is used to using moving averages, this could be a really useful indicator. Most oscillating indicators (if not all) are built around moving averages, but they're never explained in such a way as I'm explaining how this one works (I don't think). I think knowing this could help many traders come to a deeper understanding of what the indicator they're using is actually doing.

Enhanced Market Analyzer with Adaptive Cognitive LearningThe "Enhanced Market Analyzer with Advanced Features and Adaptive Cognitive Learning" is an advanced, multi-dimensional trading indicator that leverages sophisticated algorithms to analyze market trends and generate predictive trading signals. This indicator is designed to merge traditional technical analysis with modern machine learning techniques, incorporating features such as adaptive learning, Monte Carlo simulations, and probabilistic modeling. It is ideal for traders who seek deeper market insights, adaptive strategies, and reliable buy/sell signals.
Key Features:
Adaptive Cognitive Learning:
Utilizes Monte Carlo simulations, reinforcement learning, and memory feedback to adapt to changing market conditions.
Adjusts the weighting and learning rate of signals dynamically to optimize predictions based on historical and real-time data.
Hybrid Technical Indicators:
Custom RSI Calculation: An RSI that adapts its length based on recursive learning and error adjustments, making it responsive to varying market conditions.
VIDYA with CMO Smoothing: An advanced moving average that incorporates Chander Momentum Oscillator for adaptive smoothing.
Hamming Windowed VWMA: A volume-weighted moving average that applies a Hamming window for smoother calculations.
FRAMA: A fractal adaptive moving average that responds dynamically to price movements.
Advanced Statistical Analysis:
Skewness and Kurtosis: Provides insights into the distribution and potential risk of market trends.
Z-Score Calculations: Identifies extreme market conditions and adjusts trading thresholds dynamically.
Probabilistic Monte Carlo Simulation:
Runs thousands of simulations to assess potential price movements based on momentum, volatility, and volume factors.
Integrates the results into a probabilistic signal that informs trading decisions.
Feature Extraction:
Calculates a variety of market metrics, including price change, momentum, volatility, volume change, and ATR.
Normalizes and adapts these features for use in machine learning algorithms, enhancing signal accuracy.
Ensemble Learning:
Combines signals from different technical indicators, such as RSI, MACD, Bollinger Bands, Stochastic Oscillator, and statistical features.
Weights each signal based on cumulative performance and learning feedback to create a robust ensemble signal.
Recursive Memory and Feedback:
Stores and averages past RSI calculations in a memory array to provide historical context and improve future predictions.
Adaptive memory factor adjusts the influence of past data based on current market conditions.
Multi-Factor Dynamic Length Calculation:
Determines the length of moving averages based on volume, volatility, momentum, and rate of change (ROC).
Adapts to various market conditions, ensuring that the indicator is responsive to both high and low volatility environments.
Adaptive Learning Rate:
The learning rate can be adjusted based on market volatility, allowing the system to adapt its speed of learning and sensitivity to changes.
Enhances the system's ability to react to different market regimes.
Monte Carlo Simulation Engine:
Simulates thousands of random outcomes to model potential future price movements.
Weights and aggregates these simulations to produce a final probabilistic signal, providing a comprehensive risk assessment.
RSI with Dynamic Adjustments:
The initial RSI length is adjusted recursively based on calculated errors between true RSI and predicted RSI.
The adaptive RSI calculation ensures that the indicator remains effective across various market phases.
Hybrid Moving Averages:
Short-Term and Long-Term Averages: Combines FRAMA, VIDYA, and Hamming VWMA with specific weights for a unique hybrid moving average.
Weighted Gradient: Applies a color gradient to indicate trend strength and direction, improving visual clarity.
Signal Generation:
Generates buy and sell signals based on the ensemble model and multi-factor analysis.
Uses percentile-based thresholds to determine overbought and oversold conditions, factoring in historical data for context.
Optional settings to enable adaptation to volume and volatility, ensuring the indicator remains effective under different market conditions.
Monte Carlo and Learning Parameters:
Users can customize the number of Monte Carlo simulations, learning rate, memory factor, and reward decay for tailored performance.
Applications:
Scalping and Day Trading:
The fast response of the adaptive RSI and ensemble learning model makes this indicator suitable for short-term trading strategies.
Swing Trading:
The combination of long-term moving averages and probabilistic models provides reliable signals for medium-term trends.
Volatility Analysis:
The ATR, Bollinger Bands, and adaptive moving averages offer insights into market volatility, helping traders adjust their strategies accordingly.
Market Analysis Assistant This indicator uniquely maps and interprets key market conditions using Moving Averages, MACD, RSI, and Bollinger Bands. Unlike traditional indicators that only display visual signals, this tool provides written analysis directly on your chart as soon as specific conditions are met. This feature makes it easier to understand the market’s current state and anticipate potential moves.
Why Moving Averages? Moving Averages are essential for identifying the overall trend of the market. By analyzing the 200, 20, and 9-period Moving Averages, this indicator helps traders quickly determine whether the market is in an uptrend, downtrend, or sideways phase. The integration of multiple averages offers a comprehensive view, allowing for more accurate trend identification.
Why MACD? The MACD is a powerful tool for spotting trend reversals and momentum shifts. By monitoring MACD crossovers, divergences, and the position of the MACD line relative to the zero line, this indicator helps you identify potential changes in the trend direction before they fully develop, giving you a critical edge.
Why RSI? RSI is crucial for understanding the market's overbought and oversold conditions. By tracking RSI levels and its crossover with its moving average, this indicator provides early warnings for potential trend reversals or continuations, helping you time your entries and exits more effectively.
Why Bollinger Bands? Bollinger Bands are used to measure market volatility and identify breakout opportunities. By analyzing the price’s relationship with the upper and lower bands, this indicator helps traders spot potential overbought or oversold conditions, as well as possible breakout scenarios, offering a clear view of market dynamics.
Trend Identification (getTrend()): Detects whether the market is in an uptrend, downtrend, or sideways phase by analyzing the position of the price relative to the 200, 20, and 9-period moving averages.
MACD Analysis (analyzeMACD()): Identifies potential trend reversals or continuations through MACD divergence, crossovers, and the MACD signal line's position relative to the zero line.
RSI Monitoring (analyzeRSI()): Detects overbought and oversold conditions and anticipates trend continuation or corrections based on RSI crossings with its moving average.
Trap Zone Detection (analyzeTrapZone()): Highlights areas of potential price consolidation between the 20 and 200-period moving averages, indicating possible breakouts.
Bollinger Bands Analysis (analyzeBollingerBands()): Analyzes the price’s relationship with Bollinger Bands to identify overbought/oversold conditions, breakouts, and potential trend continuations or correction.
Fibonacci retracement will also check the moment the price tests a monthly or daily weekly Fibonacci retracement
What Makes This Indicator Unique?
This indicator stands out by transforming complex technical analysis into clear, written insights directly on your chart. As soon as specific conditions are met—such as a MACD crossover or an RSI overbought/oversold level—this tool immediately displays a written summary of the event, helping traders to quickly understand and act on market developments.
How to Use My Indicator:
The indicator is designed to provide detailed, real-time market condition analysis using Moving Averages, MACD, RSI, and Bollinger Bands. When certain market conditions are met, such as the price testing a specific moving average or the MACD indicating a potential reversal, the indicator displays this information in written form directly on the chart, in both English and Portuguese.
How to Interpret the Displayed Information:
The information displayed by the indicator can be used for:
Identifying Support and Resistance: The indicator can help identify when the price is testing an important support or resistance level, such as a moving average or a Fibonacci level, allowing the user to decide whether to enter or exit a position.
Trend Detection: If the indicator shows that the price is above the 200, 20, and 9-period moving averages, this may be a sign of an uptrend, indicating that the user should consider maintaining or opening buy positions.
Correction Signals: When the MACD indicates a potential correction, the user may decide to protect their profits by adjusting stops or even exiting the position to avoid losses.
Identifying Overbought/Oversold Conditions: Based on the RSI, the indicator can alert to overbought or oversold conditions, helping the user avoid entering a trade at an unfavorable time.
Example of Use:
the indicator shows several important pieces of information, such as:
"US100 Price is at the 50.0% Fibonacci level (Last Monthly)."
This suggests that the price is testing a significant Fibonacci level, which could be a point of reversal or continuation. A trader can use this information to adjust their entry or exit strategy.
"DXY RSI below 30: Indication of oversold condition"
This indicates that the DXY is in an oversold condition, which might suggest an upcoming bullish reversal. A trader could consider this when trading DXY-related assets.
"Bullish Trend: Price is above the 200, 20, and 9-period moving averages."
This confirms an uptrend, giving the user more confidence to hold long positions.
Availability:
This indicator is available in two languages: English and Portuguese. It is ideal for traders who prefer analysis in English as well as those who prefer it in Portuguese, making it a versatile and accessible tool for traders from different backgrounds
Este indicador mapeia e interpreta de forma única as principais condições de mercado utilizando Médias Móveis, MACD, RSI e Bandas de Bollinger. Ao contrário dos indicadores tradicionais que apenas exibem sinais visuais, esta ferramenta oferece uma análise escrita diretamente no seu gráfico assim que determinadas condições são atendidas. Isso facilita o entendimento do estado atual do mercado e a antecipação de possíveis movimentos.
Por que Médias Móveis? As Médias Móveis são essenciais para identificar a tendência geral do mercado. Ao analisar as Médias Móveis de 200, 20 e 9 períodos, este indicador ajuda os traders a determinarem rapidamente se o mercado está em tendência de alta, baixa ou em fase lateral. A integração de múltiplas médias oferece uma visão abrangente, permitindo uma identificação mais precisa das tendências.
Por que MACD? O MACD é uma ferramenta poderosa para identificar reversões de tendência e mudanças de momentum. Monitorando os cruzamentos do MACD, divergências e a posição da linha MACD em relação à linha zero, este indicador ajuda você a identificar possíveis mudanças na direção da tendência antes que elas se desenvolvam completamente, dando-lhe uma vantagem crítica.
Por que RSI? O RSI é crucial para entender as condições de sobrecompra e sobrevenda do mercado. Acompanhando os níveis do RSI e seu cruzamento com sua média móvel, este indicador fornece avisos antecipados para possíveis reversões ou continuações de tendência, ajudando você a cronometrar suas entradas e saídas de forma mais eficaz.
Por que Bandas de Bollinger? As Bandas de Bollinger são usadas para medir a volatilidade do mercado e identificar oportunidades de rompimento. Ao analisar a relação do preço com as bandas superior e inferior, este indicador ajuda os traders a identificar condições de sobrecompra ou sobrevenda, bem como possíveis cenários de rompimento, oferecendo uma visão clara da dinâmica do mercado.
Identificação de Tendências (getTrend()): Detecta se o mercado está em tendência de alta, baixa ou em fase lateral, analisando a posição do preço em relação às médias móveis de 200, 20 e 9 períodos.
Análise de MACD (analyzeMACD()): Identifica possíveis reversões ou continuações de tendência através de divergências do MACD, cruzamentos, e a posição da linha de sinal do MACD em relação à linha zero.
Monitoramento do RSI (analyzeRSI()): Detecta condições de sobrecompra e sobrevenda e antecipa a continuação da tendência ou correções com base nos cruzamentos do RSI com sua média móvel.
Detecção de Zona de Armadilha (analyzeTrapZone()): Destaca áreas de possível consolidação de preços entre as médias móveis de 20 e 200 períodos, indicando possíveis rompimentos.
Análise das Bandas de Bollinger (analyzeBollingerBands()): Analisa a relação do preço com as Bandas de Bollinger para identificar condições de sobrecompra/sobrevenda, rompimentos e possíveis continuações de tendência ou correção.
A retração de Fibonacci também verificará o momento em que o preço testa uma retração de Fibonacci semanal mensal ou diária
O que Torna Este Indicador Único?
Este indicador se destaca por transformar análises técnicas complexas em insights escritos claros diretamente no seu gráfico. Assim que condições específicas são atendidas—como um cruzamento do MACD ou um nível de sobrecompra/sobrevenda do RSI—esta ferramenta exibe imediatamente um resumo escrito do evento, ajudando os traders a entenderem e agirem rapidamente sobre as mudanças do mercado.
Como Utilizar o Meu Indicador:
O indicador foi desenvolvido para oferecer uma análise detalhada e em tempo real das condições de mercado, utilizando os conceitos de Médias Móveis, MACD, RSI e Bandas de Bollinger. Quando certas condições de mercado são atingidas, como o preço testando uma média móvel específica ou o MACD indicando uma possível reversão, o indicador exibe essas informações de forma escrita diretamente no gráfico, em inglês e português.
Como Interpretar as Informações Exibidas:
As informações exibidas pelo indicador podem ser usadas para:
Identificação de Suportes e Resistências: O indicador pode ajudar a identificar quando o preço está testando um nível de suporte ou resistência importante, como uma média móvel ou um nível de Fibonacci, permitindo ao usuário decidir se deve entrar ou sair de uma posição.
Detecção de Tendências: Se o indicador mostra que o preço está acima das médias móveis de 200, 20 e 9 períodos, isso pode ser um sinal de uma tendência de alta, indicando que o usuário deve considerar manter ou abrir posições de compra.
Sinais de Correção: Quando o MACD indica uma possível correção, o usuário pode decidir proteger seus lucros ajustando os stops ou até mesmo saindo da posição para evitar perdas.
Identificação de Condições de Sobrecompra/Sobrevenda: Com base no RSI, o indicador pode alertar sobre condições de sobrecompra ou sobrevenda, ajudando o usuário a evitar entrar em uma operação em um momento desfavorável.
Exemplo de Utilização:
o indicador mostra várias informações importantes, como:
"O preço do US100 está no nível de Fibonacci de 50,0% (mês passado)."
Isso sugere que o preço está testando um nível significativo de Fibonacci, o que pode ser um ponto de reversão ou continuação. Um trader pode usar essa informação para ajustar sua estratégia de entrada ou saída.
DXY RSI abaixo de 30: Indicação de condição de sobrevenda"
Isso indica que o DXY está em uma condição de sobrevenda, o que pode sugerir uma reversão de alta em breve. Um trader pode considerar isso ao fazer operações relacionadas ao DXY.
"Tendência de alta: o preço está acima das médias móveis de 200, 20 e 9 períodos."
Isso confirma uma tendência de alta, dando ao usuário mais confiança para manter posições longas.
Disponibilidade:
Este indicador está disponível em dois idiomas: inglês e português. Ele é ideal tanto para traders que preferem análises em inglês quanto para aqueles que preferem em português. Isso o torna uma ferramenta versátil e acessível para traders de diferentes origens.

Trend_Trader_WMA (Momentum)<---> Caution! This is first test version of indicator. I am ready to get more ideas+feedback to develop it more. <--->
The "Momentum_Trader_WMA" indicator is a versatile technical analysis tool designed to help traders identify potential trend changes and momentum shifts in the market. It combines multiple indicators and moving averages to provide a comprehensive view of price action and momentum.
Key Features:
Weighted Moving Averages (WMAs): The indicator calculates two different WMAs with user-defined lengths, providing a smoothed representation of price data.
Average True Range (ATR) Bands: ATR is used to calculate dynamic bands around the WMA Average. These bands can help traders gauge market volatility and potential breakout points. The color of the ATR bands can be seen as an early signal of trends or the continuation of current trends.
Commodity Channel Index (CCI): CCI is a momentum oscillator that measures the relative strength of price changes. The indicator calculates CCI values based on a user-defined period.
Exponential Moving Average (EMA) of CCI: An EMA of CCI is plotted to help identify trends and momentum shifts.
Color-Coded Bands: The ATR bands change colors based on CCI conditions, providing visual cues for potential trading opportunities. When ATR bands transition from narrow (indicating low volatility) to wide (indicating increased volatility), it can be seen as an early signal of a potential trend change or the continuation of the current trend.
Buy and Sell Signals: The indicator generates buy and sell signals based on crossovers of WMAs and CCI thresholds, making it easier for traders to identify entry and exit points.
Customizable Moving Averages: Traders can enable or disable different moving averages (e.g., SMA, EMA, WMA, RMA, VWMA, HMA) with various periods and colors to adapt the indicator to their trading preferences.
CCI Dot Alerts: Dots are displayed at the bottom of the chart based on CCI values, helping traders spot extreme CCI conditions.
How to Use:
Trend Identification: The WMAs and ATR bands can help identify the current trend direction and its strength. When the WMAs are in an uptrend (green) and the ATR bands widen, it may indicate a strong bullish trend. Conversely, when the WMAs are in a downtrend (red) and the ATR bands narrow, it may suggest a weakening bearish trend.
Momentum Confirmation: The CCI and its EMA provide insights into market momentum. Look for CCI crossovers above 100 for potential bullish momentum and below -100 for potential bearish momentum.
Buy and Sell Signals: Pay attention to the buy and sell signals generated by the indicator. Buy when the WMAs cross over and CCI crosses above 100. Sell when the WMAs cross under and CCI crosses below -100.
ATR Bands as Early Signals: The color changes in the ATR bands can be seen as early signals of trends or the continuation of current trends. Wide ATR bands may indicate increased volatility and potential trend changes, while narrow ATR bands suggest reduced volatility and potential trend continuation.
Moving Averages: Customize the indicator by enabling or disabling specific moving averages according to your preferred trading strategy.
CCI Dots: Use the CCI dots to identify extreme CCI conditions, which may indicate overbought or oversold market conditions.
PS:
Recommended to use Indicator with price action conecpts(eg. support and resistance) as they play important role in any market.
Buy and sell signals are not really accurate. I would personally look for trend shift in WMA middle line and confirmation from CCI dots at bottom. For example. If middle line turns green and within recent 3-4 candles (or next 3-4 candles) dots tunrns green also, that means momentum has been rised in the direction of bulls.
pls, take s/r concepts first when working. I am thinking to add more precise buy sell signal method to make it easier to trade.
Good luck with your trades :)
