Automatic MTF PivotsAutomatic MTF Pivots plots horizontal lines at Daily, Weekly, and Monthly Pivots as well as Support and Resistance Levels. In the Input Panel, you can select which levels to be flagged on the chart as well as their colors.
It can be shown on any timeframes with any symbols and provide reliable support and resistance.
Automatic MTF Pivots can be used in isolation or work with any other trading systems. Especially when combined with the AccuTrade System, it can provide solid R/S Levels to further confirm the signals.
Cerca negli script per "mtf"

Apex Wallet - MTF Trend Monitor: Unified Indicator DashboardOverview The Apex Wallet MTF Trend Meter is a powerful Multi-Timeframe (MTF) dashboard designed to provide a bird's-eye view of market conditions across several time intervals simultaneously. Instead of switching between charts, this tool presents a clean, real-time table directly on your workspace, allowing you to identify high-probability trade setups through timeframe alignment.
Multi-Layered Analysis The dashboard monitors and categorizes technical data into actionable color-coded cells:
Timeframe Master Trend: Tracks the core market direction using EMA filters (adjustable for Scalping, Day, or Swing trading).
Oscillator Confluence: Instant status of Stochastic (STO), RSI, MACD, and TDI.
Andean Oscillator: Specialized tracking for market states including Bullish, Bearish, Consolidating, or Reversing.
Market Volume Delta: Real-time institutional flow tracking with customizable modes (Buy/Sell, Neutral, or Auto).
Key Features:
Fully Customizable Grid: Toggle individual timeframes (from 1m up to 4h) and specific indicators to match your trading strategy.
Smart Adaptive Presets: One-click selection for Scalping, Day-Trading, or Swing-Trading automatically updates all internal indicator periods for optimized performance.
Trend-Filtered Signals: Momentum indicators are filtered by the master trend EMA to ensure signals are displayed only when aligned with the broader market direction.
Compact UI: Designed for efficiency, the dashboard sits discreetly on your chart while providing maximum data density.
How to Use: Identify "Vertical Confluence" where multiple timeframes align with the same color, indicating a high-conviction trend continuation or breakout.

SOFT Speed & Linearity Strategy (MTF) LIVE & BACKTESTSOFT Speed × Linearity Strategy (MTF – LIVE & BACKTEST)
This strategy detects clean impulsive moves by combining real-time price speed with directional quality (linearity).
It is designed for intraday markets such as Gold (XAUUSD), Nasdaq, and Crypto (ETH, BTC), where acceleration quality matters more than raw indicators.
🔹 Core Concepts
1️⃣ Speed ($ per second)
Measures how fast price is moving
Expressed in $/second, not points or ticks
Two execution modes:
LIVE → real-time intra-candle speed using elapsed seconds
BACKTEST → historical approximation using (Close − Open) / candle duration
2️⃣ Linearity Score (1 → 5)
Evaluates movement quality inside the candle:
Net progress vs adverse excursion
Identifies one-way impulses vs noisy back-and-forth moves
Interpretation
1–2 → choppy / rotational
3 → acceptable
4–5 → clean impulse (higher continuation probability)
🔹 Visual Panel
Histogram bars = Speed × Linearity
Color reflects directional quality
Optional info label displays:
Execution mode (LIVE / BACKTEST)
Analysis timeframe
Linearity score
Direction
Speed ($/s)
No drawings are placed on candles.
🔹 Entry Logic
Configurable conditions:
Minimum linearity score
Minimum speed
Direction aligned with candle movement
Long / Short / Both modes
Optional cooldown between signals
⚠️ Speed thresholds are separated for LIVE and BACKTEST to reflect their different nature.
🔹 Exit Modes (Selectable)
A — Symmetric
Exit when entry conditions are no longer valid.
B — Hysteresis (default)
Exit only after controlled degradation:
Linearity falls below a lower threshold
Or speed drops below a lower threshold
C — Momentum
Exit when speed no longer supports the trade direction (speed ≤ 0).
Optional add-ons:
Exit on opposite signal
Exit on speed channel re-entry
🔹 Multi-Timeframe (MTF)
Default analysis timeframe: 15 minutes
Optional lock to chart timeframe
Safety rule for public use:
If chart timeframe < 15m, analysis remains on 15m
Prevents misleading ultra-fast recalculations
🔹 LIVE vs BACKTEST (Important)
LIVE mode uses true intra-candle acceleration
BACKTEST mode uses an approximation to allow reproducible historical testing
Results between LIVE and BACKTEST are not identical by design
This is intentional and clearly separated.
🔹 Alerts
Available alerts:
BUY
SELL
EXIT
Speed channel breakout
ALL events
Compatible with TradingView webhooks.
🔹 Intended Use
This is not a trend indicator.
This is not a prediction tool.
It is a momentum quality detector, useful to:
Validate breakouts
Filter false accelerations
Trade continuation, not anticipation
⚠️ Disclaimer
This script is for educational and research purposes only.
It does not constitute financial advice.
Always test, adapt parameters to your market, and manage risk.

Linear Regression Channel With Pearson's R (Multi Sigma & MTF)This indicator applies multi‑sigma linear regression across multiple institutional time horizons to quantify the line of best fit in equities and index markets. By combining multi‑timeframe presets with statistically derived deviation bands, it highlights trend structure, volatility expansion, and regime transitions with clarity.
What’s New in This Update
The original version of the indicator produced a linear regression channel with multiple deviation bands. However, the statistical values it displayed were not mathematically valid. The value labeled “r” was not Pearson’s correlation coefficient and could not be used to derive R² or any formal regression diagnostics.
This update introduces a fully correct statistical engine based on ordinary least squares (OLS).
NEW STATISTICAL OUTPUTS
• True Pearson’s r
• True R² (coefficient of determination)
• RSS (Residual Sum of Squares)
• TSS (Total Sum of Squares)
These values are mathematically valid, bounded, and directly tied to the regression line.
KEY IMPROVEMENTS
• Correct OLS intercept (removes the erroneous +slope term)
• Proper predicted values using ŷ = b₀ + b₁x
• Correct centering around the actual mean of the data
• Removal of correlation logic from the deviation engine
• Clean separation between statistical computation and volatility computation
• Regression channel visuals remain identical, but the underlying math is now fully accurate
These changes ensure that r and R² reflect true trend strength and model fit, enabling more reliable interpretation of long‑term and short‑term trend regimes.
CORE FEATURES (UNCHANGED)
• Auto‑Multi‑Timeframe presets aligned with institutional trend horizons
• Multi‑Sigma bands (+/‑1σ, +/‑2σ, +/‑3σ) for volatility structure and statistical extremes
• True least‑squares regression recalculated each bar
• Deviation mode toggle (Standard Deviation vs. Max Deviation)
• Full documentation and institutional use‑case examples available on GitHub
More information can be found here:
github.com

Ripster EMA Clouds with MTFCredits & Origins:
This script is a modification of the widely popular EMA Clouds system originally created by @Ripster47. Full credit goes to him for the strategy and original concept. This version simply adds a quality-of-life feature for traders who use multi-timeframe analysis.
What is this Indicator?
The Ripster EMA Clouds system uses overlapping Exponential Moving Averages (EMAs) to visualize trends, momentum, and dynamic support/resistance zones. The "clouds" differ in color to indicate bullish or bearish trends, acting as a visual guide for keeping you on the right side of the trade.
What is New in This Version? (MTF Capability)
The standard version of this indicator calculates EMAs based on your current chart timeframe. If you switch from a 10-minute chart to a 1-minute chart, the clouds change completely.
I have added a "Fixed Timeframe" variable/input that allows you to "lock" the clouds to a specific timeframe, regardless of what chart you are viewing.
Why is this useful? This allows for true Multi-Timeframe (MTF) scalping.
Example: You can set the clouds to look at the 10-minute trend (identifying major support levels) but execute your entries on a 1-minute chart.
The clouds will remain locked to the 10-minute data, giving you the "big picture" view while you trade the micro-movements.
How to Use
Open the indicator settings.
Go to the Inputs tab.
Find the "Fixed Timeframe" option at the top.
Leave Empty (Default): The indicator behaves exactly like the original (adjusts to your chart).
Select a Timeframe (e.g., 10 Minutes): The clouds will lock to the 10-minute EMAs, even if you switch your chart to 1-minute or 5-seconds.
Note on Visuals When viewing Higher Timeframe (HTF) clouds on a Lower Timeframe (LTF) chart, the clouds will appear to have a "stepped" or "ladder-like" appearance. This is normal and accurate. It represents the single EMA value holding constant for that entire higher-timeframe period. This helps you see the true support level rather than a smoothed, repainted line.

VWAP MTF 5-BandVWAP MTF Suite
Overview
The MTF Institutional VWAP Suite is a high-performance, multi-timeframe analysis tool designed for professional traders who require precise structural anchors. Built on the latest Pine Script v6 engine, this indicator allows for the simultaneous tracking of up to five independent VWAPs, each with its own volatility bands and customizable reset logic.
Unlike standard VWAP indicators that are limited to daily sessions, this suite provides institutional "magnets" across multiple horizons, allowing you to visualize where high-volume participants are positioned on a Daily, Weekly, Monthly, or Intraday basis.
Key Features
5 Independent VWAP Engines: Run up to five unique VWAPs concurrently without chart lag.
Multi-Timeframe Anchoring: Choose from hard-coded institutional pivots: Month, Week, Day, 12-Hour, 4-Hour, and 1-Hour.
Institutional Volatility Bands: Each VWAP includes an optional 1-Standard Deviation band calculated using cumulative variance logic for maximum precision.
Advanced UI Controls: Granular toggles for each instance allow you to display only the center line, only the bands, or the full shaded "value area" for any specific timeframe.
Modern Pine v6 Architecture: Utilizes the latest 2026 Pine Script optimizations, including method chaining and global-scope plot execution for a bug-free experience.
How to Use
Identify Value Clusters: When multiple VWAPs (e.g., Daily and Weekly) converge at a single price point, it creates a high-probability "Institutional Pivot" zone.
Mean Reversion: Use the 1-Standard Deviation bands to identify overextended price action. Institutional algorithms often mean-revert toward the VWAP when price reaches the exterior bands in a low-volatility environment.
Trend Confirmation: Use the slope and position of the 4-Hour or Daily VWAP to determine intraday bias. Trading above a rising VWAP confirms a "Long Gamma" or bullish trend.
Settings
Anchor Selection: Defines the starting point of the volume-weighted calculation.
Bands & Fill Toggles: Quickly clean up your chart by hiding the volatility bands or the background shading for specific timeframes.
Visual Customization: Full control over center line colors, global band colors, and label offsets to prevent text overlap on the right-hand scale.
Developer Notes
This script was optimized for the 2026 TradingView environment. It uses a custom variance-tracking function rather than the basic built-in ta.vwap to ensure that standard deviation bands remain mathematically accurate even when crossing multiple sessions or weekend gaps.

Unmitigated MTF High Low Pro - Cave Diving Bookmap Heatmap Plot
Unmitigated MTF High Low Pro - Cave Diving Bookmap Heatmap Plot
---
## 📖 Table of Contents
1. (#what-this-indicator-does)
2. (#core-concepts)
3. (#visual-components)
4. (#the-cave-diving-framework)
5. (#how-to-use-it-for-trading)
6. (#settings--customization)
7. (#best-practices)
8. (#common-scenarios)
---
## What This Indicator Does
The **Unmitigated MTF High Low v2.0** tracks unmitigated (untouch) high and low levels across multiple timeframes, helping you identify key support and resistance zones that the market hasn't revisited yet. Think of it as a sophisticated memory system for price action - it remembers where price has been, and more importantly, where it *hasn't been back to*.
### Why "Unmitigated" Matters
In futures trading, especially on instruments like NQ and ES, the market has a tendency to revisit levels where liquidity was left behind. An "unmitigated" level is one that hasn't been touched since it was formed. These levels often act as magnets for price, and understanding their age and proximity gives you a significant edge in:
- **Entry timing** - Waiting for price to approach tested levels
- **Exit planning** - Taking profits before ancient resistance/support
- **Risk management** - Avoiding entries when approaching multiple old levels
- **Liquidity mapping** - Visualizing where orders likely cluster
---
## Core Concepts
### 1. **Sessions & Age**
The indicator uses **New York trading sessions** (6:00 PM to 5:59 PM NY time) as the primary time measurement. This aligns with how futures markets naturally segment their activity.
**Age Categories:**
- 🟢 **New (0-1 sessions)** - Fresh levels, recently formed
- 🟡 **Medium (2-3 sessions)** - Tested by time, gaining significance
- 🔴 **Old (4-6 sessions)** - Highly significant, survived multiple days
- 🟣 **Ancient (7+ sessions)** - Extreme significance, major support/resistance
The longer a level remains unmitigated, the more significant it becomes. Think of it like compound interest - time adds weight to these zones.
### 2. **Multi-Timeframe Tracking**
You can set the indicator to track high/low levels from any timeframe (default is 15 minutes). This means you're watching for unmitigated 15-minute highs and lows while trading on, say, a 1-minute or 5-minute chart.
**Why this matters:**
- Higher timeframe levels have more weight
- You can see multiple timeframe structure simultaneously
- Helps you avoid fighting larger timeframe momentum
### 3. **Mitigation**
A level becomes "mitigated" (deactivated) when price touches it:
- **High levels** are mitigated when price reaches or exceeds them
- **Low levels** are mitigated when price reaches or goes below them
Once mitigated, the level disappears from view. The indicator only shows you the untouch levels that still matter.
---
## Visual Components
### 📊 The Dashboard Table
Located in the corner of your chart (configurable), the table shows:
```
┌─────────┬───────────┬────────┬─────┬───────┐
│ Level │ Price │ Points │ Age │ % │
├─────────┼───────────┼────────┼─────┼───────┤
│ ↑↑↑↑↑ │ 21,450.25 │ +45.50 │ 8 │ +0.21%│ ← 5th High (Ancient)
│ ↑↑↑↑ │ 21,430.00 │ +25.25 │ 5 │ +0.12%│ ← 4th High (Old)
│ ↑↑↑ │ 21,420.50 │ +15.75 │ 3 │ +0.07%│ ← 3rd High (Medium)
│ ↑↑ │ 21,412.00 │ +7.25 │ 1 │ +0.03%│ ← 2nd High (New)
│ ↑ ⚠️ │ 21,408.25 │ +3.50 │ 0 │ +0.02%│ ← 1st High (Proximity Alert!)
├─────────┼───────────┼────────┼─────┼───────┤
│ 15 mins │ 🟢 │ Δ 8.75 │ 2U │ │ ← Status Row
├─────────┼───────────┼────────┼─────┼───────┤
│ ↓ ⚠️ │ 21,399.50 │ -5.25 │ 0 │ -0.02%│ ← 1st Low (Proximity Alert!)
│ ↓↓ │ 21,395.00 │ -9.75 │ 2 │ -0.05%│ ← 2nd Low (Medium)
│ ↓↓↓ │ 21,385.25 │ -19.50 │ 4 │ -0.09%│ ← 3rd Low (Old)
│ ↓↓↓↓ │ 21,370.00 │ -34.75 │ 6 │ -0.16%│ ← 4th Low (Old)
│ ↓↓↓↓↓ │ 21,350.75 │ -54.00 │ 9 │ -0.25%│ ← 5th Low (Ancient)
├─────────┼───────────┼────────┼─────┼───────┤
│ 📊 15↑ / 12↓ │ ← Statistics (optional)
└─────────┴───────────┴────────┴─────┴───────┘
```
**Reading the Table:**
- **Level Column**: Number of arrows indicates position (1-5), color shows age
- **Price**: The actual price level
- **Points**: Distance from current price (+ for highs, - for lows)
- **Age**: Number of full sessions since creation
- **%**: Percentage distance from current price
- **⚠️**: Proximity alert - price is within threshold distance
- **Status Row**: Shows timeframe, direction (🟢 bullish/🔴 bearish), tunnel width (Δ), and Strat pattern
### 📈 Visual Elements on Chart
**1. Level Lines**
- Horizontal lines showing each unmitigated level
- **Color-coded by age**: Bright colors = new, darker = older, deep purple/teal = ancient
- **Line style**: Customizable (solid, dashed, dotted)
- Automatically turn **yellow** when price gets close (proximity alert)
**2. Price Labels**
- Show the exact price and age: "21,450.25 (8d)"
- Fixed at small size for clean readability
- Positioned with configurable offset from current bar
**3. Bands (Optional)**
- Shaded zones between pairs of unmitigated levels
- Default: Between 1st and 2nd levels (the "tunnel")
- Can switch to 1st-3rd, 2nd-3rd, or disable entirely
- **Upper band** (pink/maroon) - Between unmitigated highs
- **Lower band** (blue/teal) - Between unmitigated lows
- These represent the "no man's land" or consolidation zones
---
## The Cave Diving Framework
This indicator is designed around the **Cave Diving Trading Framework** - a psychological and technical approach that maps cave diving safety protocols to futures trading risk management.
### 🤿 The Core Metaphor
**Cave diving has clear danger zones based on depth and overhead environment. Your trading should too.**
#### Shallow Water (New Levels, 0-1 Sessions)
- **Light**: Bright colors (bright red highs, bright green lows)
- **Psychology**: Fresh territory, recently tested
- **Trading**: Be aware but not overly concerned
- **Cave Diving Parallel**: You can see the surface, easy exit
#### Penetration Depth (Medium Levels, 2-3 Sessions)
- **Light**: Medium intensity colors
- **Psychology**: Building significance, market memory forming
- **Trading**: Start respecting these levels for entries/exits
- **Cave Diving Parallel**: Deeper in, need to track your line back
#### Deep Dive Zone (Old Levels, 4-6 Sessions)
- **Light**: Dark colors (deep maroon, dark blue)
- **Psychology**: Highly tested support/resistance
- **Trading**: Major decision points, plan accordingly
- **Cave Diving Parallel**: Significant overhead, careful navigation required
#### Overhead Environment (Ancient Levels, 7+ Sessions)
- **Light**: Very dark, purple/deep teal
- **Psychology**: Extreme caution required, major liquidity zones
- **Trading**: These are your "turn back" signals - don't fight ancient levels
- **Cave Diving Parallel**: Maximum danger, no room for error
### 🎯 The Proximity Alert System
Just like a cave diver's depth gauge that warns at critical thresholds, the proximity alerts (⚠️) tell you when you're entering a danger zone. When price gets within your configured threshold (default 5 points), the indicator:
- Highlights the level in **yellow** on the chart
- Shows **⚠️** in the table
- Signals: "You're entering a high-significance zone - adjust your position accordingly"
This prevents the trading equivalent of going deeper into a cave without checking your air supply.
---
## How to Use It for Trading
### 🎯 Entry Strategies
**1. The "Bounce Setup" (Mean Reversion)**
- Wait for price to approach an old or ancient unmitigated level
- Look for confluence: multiple levels nearby, bands narrowing
- Enter when price shows rejection (reversal candle patterns)
- **Example**: Price drops to a 6-session-old low, shows bullish engulfing → Long entry
**2. The "Break and Retest" (Trend Following)**
- Wait for price to break through an unmitigated level (mitigates it)
- Enter on the retest of the newly broken level
- **Example**: Price breaks above 4-session-old high → Wait for pullback to that level → Long entry
**3. The "Tunnel Trade" (Range Trading)**
- When bands are active, trade the range between 1st-2nd levels
- Short near upper band resistance, long near lower band support
- Exit at opposite side or when bands break
### 🚨 Risk Management Rules
**The Ancient Level Rule**
> Never fight ancient levels (7+ sessions). If you're long and approaching an ancient high, take profits. If you're short and approaching an ancient low, take profits.
These levels have survived a full trading week without being touched - there's likely significant liquidity and institutional interest there.
**The Proximity Exit Rule**
> When you see ⚠️ proximity alerts on multiple levels above/below your position, tighten stops or scale out.
This is your "overhead environment" warning. You're in dangerous territory.
**The New Level Filter**
> Be cautious taking positions based solely on new levels (0-1 sessions). Wait for them to age or combine with other confluence.
Fresh levels haven't been tested by time. They're like unconfirmed support/resistance.
### 📊 Reading Market Structure
**Bullish Structure (🟢 in status row)**
- Unmitigated lows are aging and holding
- Price respecting the lower band
- Old lows below acting as strong support
- **Bias**: Look for long entries at lower levels
**Bearish Structure (🔴 in status row)**
- Unmitigated highs are aging and holding
- Price respecting the upper band
- Old highs above acting as strong resistance
- **Bias**: Look for short entries at higher levels
**The Tunnel Compression**
- When the Δ (delta) in the status row is small, levels are tight
- This often precedes a breakout
- **Trading**: Wait for breakout direction, then trade the break
### 🔄 Strat Integration
The indicator shows Strat patterns in the status row:
- **1** - Inside bar (consolidation)
- **2U** - Broke high only (bullish)
- **2D** - Broke low only (bearish)
- **3** - Broke both (wide range, volatility)
Use these with the unmitigated levels:
- **2U near old high** → Potential resistance, watch for rejection
- **2D near old low** → Potential support, watch for bounce
- **3 pattern** → High volatility, respect wider stops
---
## Settings & Customization
### 📅 Session & Timeframe Settings
**HL Interval** (Default: 15 minutes)
- The timeframe for high/low calculation
- **Lower (1m, 5m)**: More levels, more noise, good for scalping
- **Higher (30m, 1H, 4H)**: Fewer levels, stronger significance, good for swing trading
- **Recommendation for NQ/ES**: 15m or 30m for day trading, 1H for swing trading
**Session Age Threshold** (Default: 2)
- How many sessions before a level is considered "old"
- Lower = more levels classified as old
- Higher = stricter definition of significance
### 📊 Level Display Options
**Show Level Lines**
- Toggle: Display horizontal lines for each level
- **Turn off** if you prefer a cleaner chart and only want the table
**Show Level Labels**
- Toggle: Display price labels on the chart
- **Turn off** for minimal visual clutter
**Label Offset**
- Distance (in bars) from current price bar to place labels
- Increase if labels overlap with price action
**Level Line Width & Style**
- Customize visual appearance
- **Thin solid**: Minimal distraction
- **Thick dashed**: High visibility
### 🎨 Age-Based Color Coding
Customize colors for each age category (high and low separately):
- **New (0-1 sessions)**: Default bright red/green
- **Medium (2-3 sessions)**: Default medium intensity
- **Old (4+ sessions)**: Default dark red/blue
- **Ancient (7+ sessions)**: Default deep purple/teal
**Color Strategy Tips:**
- Keep ancient levels in highly contrasting colors
- Use opacity (transparency) if you want subtler lines
- Match your chart's color scheme for aesthetic coherence
### 🎯 Band Settings
**Band Mode**
- **1st-2nd** (Default): The primary "tunnel" between most recent levels
- **1st-3rd**: Wider band, more room for price action
- **2nd-3rd**: Band between less immediate levels
- **Disabled**: No bands, lines only
**Band Colors & Borders**
- Customize fill color and border separately
- **Tip**: Keep bands very transparent (90-95% transparency) to avoid obscuring price action
### ⚠️ Proximity Alert Settings
**Enable Proximity Alerts**
- Toggle: Turn on/off the warning system
- When enabled, levels within threshold distance show ⚠️ and turn yellow
**Alert Threshold** (Default: 5.0 points)
- Distance in points to trigger the alert
- **For NQ**: 5-10 points is reasonable
- **For ES**: 2-5 points is reasonable
- **For MES/MNQ**: Scale down proportionally
**Alert Highlight Color**
- The color lines/labels turn when proximity is triggered
- Default: Yellow (high visibility)
### 📋 Table Settings
**Show Table**
- Toggle: Display the dashboard table
**Table Location**
- Top Left, Top Right, Bottom Left, Bottom Right
- Choose based on your chart layout and other indicators
**Text Size**
- Tiny, Small, Normal, Large
- **Recommendation**: Normal for 1080p monitors, Small for 4K
**Show % Distance**
- Toggle: Add percentage distance column to table
- Useful for comparing relative distances across different price ranges
**Show Statistics Row**
- Toggle: Show total count of unmitigated highs/lows
- Format: "📊 15↑ / 12↓" (15 unmitigated highs, 12 unmitigated lows)
- Useful for gauging overall market structure
### ⚡ Performance Settings
**Enable Level Cleanup**
- Automatically remove very old levels to maintain performance
- **Keep on** unless you want unlimited history
**Max Lookback Levels** (Default: 10,000)
- Maximum number of levels to track
- 10,000 ≈ 6+ months of 15-minute bars
- **Increase** if you want more history
- **Decrease** if experiencing performance issues
**Max Boxes Per Band** (Default: 245)
- TradingView limit is 500 total boxes
- With 2 bands, 245 each = 490 total (safe maximum)
---
## Best Practices
### 🎯 Position Management
**1. Scaling In Near Old Levels**
```
Price approaching 5-session-old low:
- First position: 30% size at proximity alert (⚠️)
- Second position: 40% size at exact level
- Third position: 30% size if it shows strong rejection
```
**2. Scaling Out Near Ancient Levels**
```
Holding long position, approaching 8-session-old high:
- Exit 50% at proximity alert (⚠️)
- Exit 30% at exact level
- Trail stop on remaining 20%
```
### 🧠 Trading Psychology Integration
Drawing from principles in *The Mountain Is You*, this indicator helps you:
**1. Recognize Self-Sabotage Patterns**
- **The Premature Entry**: Entering before price reaches your planned level
- **Solution**: Set alerts at unmitigated levels, wait for proximity warnings
- **The Profit-Taking Problem**: Exiting too early from fear
- **Solution**: Identify the next unmitigated level and commit to holding until proximity alert
- **The Loss Holding**: Refusing to exit losing trades
- **Solution**: When price breaks through and mitigates your entry level, it's telling you the structure changed
**2. Building Better Habits**
The color-coded age system trains your brain to:
- Respect levels that have proven themselves over time
- Distinguish between noise (new levels) and structure (old levels)
- Make decisions based on objective data, not fear or greed
**3. Emotional Regulation**
The proximity alerts serve as:
- **Circuit breakers** - Forcing you to re-evaluate before dangerous zones
- **Permission to act** - Giving you objective signals to exit without second-guessing
- **Validation** - Confirming when you're in alignment with market structure
### 📝 Pre-Market Routine
**Daily Setup Checklist:**
1. ✅ Identify the 3 nearest unmitigated highs above current price
2. ✅ Identify the 3 nearest unmitigated lows below current price
3. ✅ Note which are ancient (7+) - these are your "no-go" zones
4. ✅ Check the tunnel width (Δ in status row) - tight or wide?
5. ✅ Set alerts at the 1st high and 1st low for proximity warnings
6. ✅ Plan: "If we go up, I exit at ___. If we go down, I enter at ___."
### 🔄 Timeframe Confluence
**Multi-Timeframe Strategy:**
Run the indicator on **three instances**:
- **15-minute** (short-term structure)
- **1-hour** (intermediate structure)
- **4-hour** (major structure)
**Strong Setup**: When all three timeframes show unmitigated levels converging at the same price zone.
**Example:**
- 15m: Old low at 21,400
- 1H: Ancient low at 21,398
- 4H: Ancient low at 21,395
- **Result**: 21,395-21,400 is a monster support zone
### ⚠️ What This Indicator Doesn't Do
**Not a Crystal Ball**
- It doesn't predict where price will go
- It shows you where price *hasn't been* and how long it's been avoided
- The trading decisions are still yours
**Not an Entry Signal Generator**
- It provides context and structure
- You need to combine it with your entry methodology (price action, indicators, order flow, etc.)
**Not Foolproof**
- Ancient levels get broken
- Proximity alerts can trigger early in strong trends
- The market doesn't "owe" you a reversal at any level
---
## Common Scenarios
### Scenario 1: "Level Cluster Ahead"
**Situation**: You're long at 21,400. The table shows:
- 1st High: 21,425 (2 sessions old)
- 2nd High: 21,428 (3 sessions old)
- 3rd High: 21,435 (6 sessions old)
**Interpretation**: There's a resistance cluster just 25-35 points away. The 6-session-old level is particularly significant.
**Action**:
- Set first profit target at 21,420 (before the cluster)
- Set second target at 21,426 (between 1st and 2nd)
- Trail remaining position, but be ready to exit on rejection at 21,435
**Cave Diving Analogy**: You're approaching an overhead section with limited clearance. Lighten your load (reduce position) before entering.
---
### Scenario 2: "Ancient Level Approaches"
**Situation**: The market is grinding higher. You see ⚠️ appear next to a 9-session-old high at 21,500.
**Interpretation**: This level has survived over a week without being touched. Massive potential liquidity zone.
**Action**:
- If long, this is your absolute exit zone. Take profits before or at level.
- If looking to short, wait for clear rejection (price taps and reverses)
- Don't try to buy the breakout until it clearly breaks and retests
**Cave Diving Analogy**: Your dive computer is beeping - you've reached your planned turn-back depth. No matter how interesting it looks ahead, honor your plan.
---
### Scenario 3: "Mitigated Levels Create New Structure"
**Situation**: Price breaks and mitigates the 1st High. The previous 2nd High becomes the new 1st High.
**Interpretation**: The structure just shifted. What was the 2nd level is now most relevant.
**Action**:
- Watch how price reacts to the newly-mitigated level
- If it holds below (acts as resistance), bearish
- If it reclaims and holds above (acts as support), bullish
- The NEW 1st High is your next target/resistance
**Cave Diving Analogy**: You've passed through a restriction - the cave layout ahead is different now. Update your mental map.
---
### Scenario 4: "Tight Tunnel, Upcoming Breakout"
**Situation**: The Δ in the status row shows 3.25 points (very tight). Bands are converging.
**Interpretation**: Price is consolidating between very close unmitigated levels. Breakout likely.
**Action**:
- Don't try to predict direction
- Set alerts above 1st High and below 1st Low
- When break occurs, trade the retest
- Expect volatility - use wider stops
**Cave Diving Analogy**: You're in a narrow passage. Movement will be sudden and directional once it starts.
---
### Scenario 5: "Imbalanced Structure"
**Situation**: The statistics row shows "📊 22↑ / 7↓"
**Interpretation**: There are many more unmitigated highs than lows. This suggests:
- Price has been declining (hitting lows, leaving highs behind)
- Potential bullish reversal zone (lots of overhead supply mitigated)
- Or continued bearish structure (resistance everywhere above)
**Action**:
- Look at the age of those 22 highs
- If mostly new (0-2 sessions): Just a recent downmove, not significant yet
- If many old/ancient: Strong overhead resistance, be cautious on longs
- Compare to price action: Is price respecting the remaining lows?
**Cave Diving Analogy**: You've swam deeper than your starting point - most of your markers are above you now. Are you planning the ascent or going deeper?
---
## Final Thoughts: The Philosophy
This indicator is built on a simple but powerful principle: **The market has memory, and that memory has weight.**
Every unmitigated level represents:
- Liquidity left behind
- Orders waiting to be filled
- Institutional interest potentially parked
- Psychological significance for participants
The longer a level remains unmitigated, the more "charged" it becomes. When price finally revisits it, something significant usually happens - either a strong reversal or a definitive break.
Your job as a trader isn't to predict which outcome will occur. Your job is to:
1. **Recognize** when you're approaching these charged zones
2. **Respect** them by adjusting position size and risk
3. **React** appropriately based on how price behaves at them
4. **Remember** that ancient levels (like ancient wisdom) deserve extra reverence
The Cave Diving Framework embedded in this indicator serves as a constant reminder: Trading, like cave diving, requires rigorous respect for environmental hazards, meticulous planning, and the discipline to turn back when your limits are reached.
**Every proximity alert is the market asking you**: *"Do you really want to go deeper?"*
Sometimes the answer is yes - when your setup, confluence, and risk management all align.
Often, the answer should be no - and that's the trader avoiding the accident that would have happened to the gambler.
---
### 🎯 Quick Reference Card
**Color System:**
- 🟢 Bright colors = New (0-1 sessions) = Shallow water
- 🟡 Medium colors = Medium (2-3 sessions) = Penetration depth
- 🔴 Dark colors = Old (4-6 sessions) = Deep dive zone
- 🟣 Deep dark colors = Ancient (7+ sessions) = Overhead environment
**Symbols:**
- ↑ ↑↑ ↑↑↑ ↑↑↑↑ ↑↑↑↑↑ = High levels (1st through 5th)
- ↓ ↓↓ ↓↓↓ ↓↓↓↓ ↓↓↓↓↓ = Low levels (1st through 5th)
- ⚠️ = Proximity alert (danger zone)
- 🟢 = Bullish structure
- 🔴 = Bearish structure
- Δ = Tunnel width (distance between 1st high and 1st low)
**Critical Rules:**
1. Never fight ancient levels (7+ sessions)
2. Respect proximity alerts (⚠️)
3. Scale out near old/ancient resistance
4. Wait for confluence when entering
5. Let mitigated levels prove their new role
---
**Remember**: The indicator gives you structure. The trading edge comes from your discipline in respecting that structure.
Trade safe, trade smart, and always know your exit before your entry. 🎯
---
*"You don't become your best self by denying your patterns. You become your best self by recognizing them, understanding them, and choosing differently." - Adapted from The Mountain Is You*
In trading: You don't become profitable by ignoring market structure. You become profitable by recognizing it, understanding it, and choosing your entries accordingly.

Universe_Super MA [MTF & Multi-Type]**Overview**
"Universe_Super MA" is a comprehensive trend analysis tool designed to overcome indicator limits. Instead of adding 4 separate moving averages, this script allows you to monitor 4 distinct Moving Averages within a single indicator slot.
It features full **Multi-Timeframe (MTF)** capabilities, meaning you can view higher timeframe trends (e.g., Daily 200 SMA) while trading on lower timeframes (e.g., 15-minute chart).
**Default Configuration (Institutional Setup)**
The indicator comes pre-loaded with a powerful institutional trend setup:
1. **50 Period (Green):** Short-term trend and dynamic support.
2. **99 Period (Orange):** Medium-term trend filter.
3. **200 Period (Red):** The classic institutional dividing line between Bull and Bear markets.
4. **389 Period (Blue):** A long-term "Deep Trend" baseline used to identify major market cycles and heavy support/resistance levels.
**Key Features**
* **fully Customizable:** You can change the Length, Color, and Width of each line.
* **Multi-Timeframe (MTF):** Select any timeframe for any MA. (e.g., Keep MA1 on the "Chart" timeframe, but lock MA4 to the "Daily" timeframe).
* **6 MA Types:** Choose between SMA, EMA, WMA, HMA (Hull), RMA, and VWMA for each line independently.
* **Clean Interface:** Toggle any line On/Off via settings without removing the indicator.
**Usage & Interpretation**
* **Trend Identification:** The 200 (Red) and 389 (Blue) lines are designed to visualize the long-term market bias. In technical analysis, price action sustaining above these levels is generally considered a bullish context, while price below suggests a bearish context.
* **Crossover Monitoring:** The script facilitates the observation of interactions between short-term and long-term averages (e.g., the 50 crossing the 200), allowing users to easily spot common technical patterns like the "Golden Cross".
* **Dynamic Levels:** The 99 and 200-period lines act as dynamic levels that may align with technical support or resistance zones during market retracements.
**Settings**
* **Timeframe:** Leave empty to use the current chart's timeframe, or select a specific one (e.g., "1D" or "4H").
* **Type:** Select your preferred calculation method (SMA is default).
**Disclaimer**
This tool is for educational purposes and trend visualization only. Always manage your risk.

Optimal Daily MA Suite [MTF]Title: Optimal Daily MA Suite
Description: This is a comprehensive Multi-Timeframe (MTF) analysis suite designed to streamline chart layouts. Instead of loading multiple separate indicators to track various trend lines, this single tool allows traders to overlay higher-timeframe Moving Averages and key support/resistance levels directly onto their intraday charts.
Utility & Workflow: Swing traders and day traders often need to monitor "Big Picture" Daily Moving Averages (like the Daily 200 SMA or Daily 50 EMA) while executing trades on lower timeframes like the 15m or 1H. This tool automates that process, ensuring the major trend context is always visible without cluttering the indicator list.
Key Features:
Multi-Timeframe Engine: By default, all MAs are calculated on the Daily ("D") timeframe, regardless of the chart's current timeframe. This creates a stable "anchor" for trend analysis. The timeframe is fully customizable in the settings (e.g., set to "W" for Weekly analysis).
10 Customizable Slots: Toggle up to 10 different Moving Averages on/off individually.
Flexible Calculation Types: Supports SMA, EMA, WMA, VWMA, RMA (SMMA), and SWMA for every single line.
Trend Cloud Crossovers: Includes two dedicated "Cloud" setups to visualize crossovers (e.g., Golden Cross or Death Cross) with fill shading between the fast and slow lines.
Price Action Crossovers: Optional markers to highlight when the closing price crosses specific MAs.
Contextual Levels: Includes Previous Day High (PDH) and Previous Day Low (PDL) markers for immediate intraday support/resistance context.
How to Use:
Settings: Open the settings menu to select your "Indicator Timeframe" (Default: Daily).
Customization: Enable only the MAs relevant to your strategy (e.g., Enable MA 8 for the 50 SMA and MA 10 for the 200 SMA).
Clouds: Use the "Crossover Set" inputs to define a Bullish/Bearish trend cloud between two moving averages of your choice.
Technical Note: This script uses request.security with lookahead=barmerge.lookahead_off to ensure no repainting of historical data while providing accurate higher-timeframe values on closed bars.
Credits: Standard Moving Average calculations based on TradingView built-in functions.

Unmitigated MTF High Low - Cave Diving Plot
IntroductionThe Unmitigated MTF High Low -
Cave Diving Plot is a multi-timeframe (MTF) indicator designed for NQ and ES futures traders who want to identify high-probability entry and exit zones based on unmitigated price levels. The "Cave Diving" visualization helps you navigate between support (floor) and resistance (ceiling) zones, while the integrated Strat analysis provides directional context.
Who Is This For?
Futures traders (NQ, ES) trading during ETH and RTH sessions
Scalpers and day traders looking for precise entry/exit levels
Traders using The Strat methodology for directional analysis
Anyone seeking confluence between price action and key levels
Core Concepts
1. Unmitigated Level:
An unmitigated level is a price high or low that has been created but not yet tested (touched) by price. These levels act as magnets - price often returns to test them.Key Properties:
Resistance (Highs): Price has created a high but hasn't revisited it
Support (Lows): Price has created a low but hasn't revisited it
Mitigation: When price touches a level, it becomes "mitigated" and loses strength
2. The Cave Diving MetaphorThink of trading as cave diving between two zones:
┌─────────────────────────────────┐
│ CEILING (Upper Band) │ ← 1st & 2nd Unmitigated Highs
│ 🟥 Resistance Zone │
├─────────────────────────────────┤
│ │
│ THE TUNNEL │ ← Price navigates here
│ (Trading Channel) │
│ │
├─────────────────────────────────┤
│ 🟢 Support Zone │
│ FLOOR (Lower Band) │ ← 1st & 2nd Unmitigated Lows
└─────────────────────────────────┘
Trading Concept:
Ceiling: Formed by the 1st and 2nd most recent unmitigated highs
Floor: Formed by the 1st and 2nd most recent unmitigated lows
Tunnel: The space between ceiling and floor where price operates
Cave Diving: Navigating between these zones for entries and exits
3. Session-Based Age TrackingLevels are tracked by session age:
Session: 6:00 PM to 5:00 PM NY time (23-hour window)
Age 0: Created in the current session (today)
Age 1: Created 1 session ago (yesterday)
Age 2+: Older levels (more significant)
Why Age Matters:
Older unmitigated levels are typically stronger magnets
Fresh levels (Age 0) may be weaker and easier to break
Age 2+ levels often provide high-probability reversal zones
Indicator Components
Visual Elements
1. Colored Bands (Cave Zones)Upper Band (Pink/Maroon - 95% transparency)
Space between 1st and 2nd unmitigated highs
Acts as resistance zone
Price often hesitates or reverses here
Lower Band (Teal - 95% transparency)
Space between 1st and 2nd unmitigated lows
Acts as support zone
Price often finds buyers here
2. Information Table Located in your chosen corner (default: Bottom Right), the table displays:
5 most recent unmitigated highs (top section)
Tunnel row (middle separator)
5 most recent unmitigated lows (bottom section)
Reading the TableTable Structure
┌────────┬──────────┬────────┬───────┐
│ Level │ $ │ Points │ Age │
├────────┼──────────┼────────┼───────┤
│ ↑↑↑↑↑ │ 21,450.25│ +45.30 │ 3 │ ← 5th High (oldest)
│ ↑↑↑↑ │ 21,425.50│ +32.75 │ 2 │ ← 4th High
│ ↑↑↑ │ 21,410.00│ +25.00 │ 1 │ ← 3rd High
│ ↑↑ │ 21,400.75│ +18.50 │ 1 │ ← 2nd High
│ ↑ │ 21,395.25│ +12.00 │ 0 │ ← 1st High (newest)
├────────┼──────────┼────────┼───────┤
│ Tunnel │ 🟢 │ Δ 85.50│ 2U │ ← Current State
├────────┼──────────┼────────┼───────┤
│ ↓ │ 21,310.00│ -15.25 │ 0 │ ← 1st Low (newest)
│ ↓↓ │ 21,295.50│ -22.75 │ 1 │ ← 2nd Low
│ ↓↓↓ │ 21,280.25│ -30.00 │ 1 │ ← 3rd Low
│ ↓↓↓↓ │ 21,265.75│ -38.50 │ 2 │ ← 4th Low
│ ↓↓↓↓↓ │ 21,250.00│ -45.00 │ 3 │ ← 5th Low (oldest)
└────────┴──────────┴────────┴───────┘Column
Breakdown
Column 1: Level (Arrows)
Green arrows (↑): Resistance levels above current price
Red arrows (↓): Support levels below current price
Arrow count: Indicates recency (1 arrow = newest, 5 arrows = oldest)
Why This Matters:
More arrows = older level = stronger magnet for price
Column 2: $ (Price)
Exact price of the unmitigated level
Use this for limit orders and stop placement
Column 3: Points (Distance)
Positive (+) for highs: Points above current price
Negative (-) for lows: Points below current price
Helps gauge proximity to key levels
Trading Application:
If you're +2.50 points from resistance, a reversal may be imminent
If you're -45.00 points from support, you're far from the floor
Column 4: Age (Sessions)
Number of full 6pm-5pm sessions the level has survived
Age 0: Created today (current session)
Age 1+: Created in previous sessions
Significance Ladder:
Age 0: Weak, may break easily
Age 1-2: Medium strength
Age 3+: Strong, high-probability reaction zone
Tunnel Row (Critical Information)│ Tunnel │ 🟢 │ Δ 85.50│ 2U │
└─┬─┘ └─┬─┘ └──┬──┘ └─┬─┘
│ │ │ │
Label Direction Range Strat
1. Tunnel Label: Identifies the separator row
2. Direction Indicator (🟢/🔴)
🟢 Green Circle: Current 15m bar closed bullish (above previous close)
🔴 Red Circle: Current 15m bar closed bearish (below previous close)
3. Δ (Delta/Range)
Distance in points between 1st High and 1st Low
Shows the tunnel width (trading range)
Example: Δ 85.50 = 85.50 points between ceiling and floor
Trading Use:
Wide tunnel (>100 points): More room to trade, consider range strategies
Narrow tunnel (<50 points): Tight range, expect breakout
4. Strat Pattern
1: Inside bar (consolidation)
2U: 2 Up (bullish directional bar)
2D: 2 Down (bearish directional bar)
3: Outside bar (expansion/volatility)
Color Coding:
Green: 2U (bullish)
Red: 2D (bearish)
Yellow: 3 (expansion)
Gray: 1 (inside/neutral)

SuperTrend Oscillator MTF█ OVERVIEW
SuperTrend Oscillator MTF is a multi-timeframe version of the classic SuperTrend converted into an oscillator. Instead of drawing the SuperTrend line on the price chart, it displays the distance of the close from the SuperTrend line simultaneously for the current timeframe and two additional timeframes. This allows you to instantly see the trend direction and strength across three selected timeframes in a single window.
█ CONCEPT
The classic SuperTrend value is subtracted from price and normalized so that trend direction can be directly compared across different timeframes without switching charts.
- Value above zero = price below SuperTrend line → bearish trend
- Value below zero = price above SuperTrend line → bullish trend
- The further away from zero, the stronger the trend.
█ FEATURES
- Three SuperTrend Oscillator lines: current TF, TF1 and TF2
- Automatic detection of 3-timeframe agreement
- BUY and SELL labels that appear only when all three timeframes turn in the same direction at the same moment
- Circle signals on every zero-line cross of the current timeframe
- Configurable soft gradient fill (can be disabled)
- Zero line changes color (green/red/gray) depending on 3-TF agreement
- Fully customizable colors for each timeframe
- Built-in alerts for all signal types
█ HOW TO USE
Add the indicator to the chart → set two additional timeframes and adjust ATR Period and Factor to suit your trading style.
Main settings:
- ATR Period → default 10
- Factor → default 3.0 (higher = fewer signals)
- TF 1 and TF 2 → any timeframes (e.g. 1H+4H, 4H+D, D+W, etc.)
- Enable gradient → turn fill on/off
- Show BUY/SELL labels (3 TF agreement) → enable/disable the strongest signals
Interpretation:
Two types of signals:
- Green/red circles → current timeframe changes trend direction (faster signal)
- BUY/SELL labels → all three timeframes simultaneously switch to the same direction (strongest confluence)
- Additionally, the zero line turns green or red when all three trends are aligned.
█ APPLICATIONS
Perfect for:
- Trend-following with multi-timeframe confirmation
- Filtering false breakouts on lower timeframes
- Scalping & day trading (use fast circle signals)
- Swing & position trading (wait for full 3-TF agreement)
Best combined with:
- Support/resistance levels and supply/demand zones – enter long after a confirmed breakout and retest of a key level (e.g. Change of Character, Break of Structure, Order Block, 0.618–0.786 Fibonacci) only when the oscillator shows 3-TF agreement or at least a bullish circle. Hold the trade to the next significant resistance/supply zone.
- Volume and Volume Profile – confirm move strength with rising volume and high-volume nodes at the breakout level. Declining volume while moving away from zero may signal trend exhaustion.
- Classic oscillators (RSI, Stochastic, MACD) – use primarily for spotting divergences and overbought/oversold conditions. One of the safest exits is when a regular or hidden divergence appears on RSI/Stochastic in an extreme zone, even if SuperTrend Oscillator MTF still shows alignment.
█ NOTES
- Works on all markets and all timeframes
- BUY/SELL labels (3-TF agreement) are the cleanest and strongest signals
- Circle signals are faster but more prone to noise
- Higher ATR Period = fewer signals, higher quality

Dual MTF Confirmed Trend Strategy (5m Entry / 15m MACD & RSI) v1That is a detailed Dual Multi-Timeframe (MTF) Confirmed Trend Strategy written in Pine Script for TradingView. The core idea of this strategy is to only take entry signals on a faster timeframe (5-minute) when the trend is strongly confirmed on a slower, higher timeframe (15-minute). This aims to reduce false signals and trade in the direction of the dominant trend. Here is an explanation of how the strategy works, broken down by section:
1. 5-Minute Entry Filters 🚀This section calculates several indicators on the current 5-minute chart to identify potential trade setups. A position is only considered if all 5-minute conditions align.
Supertrend: A trend-following indicator based on Average True Range (ATR).
Long Condition: The closing price must be above the Supertrend line.
Short Condition: The closing price must be below the Supertrend line.
Gann Hi-Lo (GHL): A trend indicator using Simple Moving Averages (SMA) of the high and low prices. GHL Line: Switches between the SMA of the Highs and the SMA of the Lows based on price action.
Long Condition: The closing price must be above the GHL line.
Short Condition: The closing price must be below the GHL line.
Exponential Moving Averages (EMAs): It uses a 50-period EMA and a 100-period EMA to confirm the short-term trend direction.
Long Condition: The closing price must be above both the 50 EMA and the 100 EMA.
Short Condition: The closing price must be below both the 50 EMA and the 100 EMA.
2. 15-Minute MTF Confirmation Filters ⏳This is the crucial step where the strategy verifies the trend on the slower, 15-minute timeframe using the request security function. This step acts as a gatekeeper to ensure the 5-minute trade aligns with the larger trend.
MACD Histogram (12, 26, 9): The difference between the MACD Line and the Signal Line.
Long Confirmation: The 15m MACD Histogram must be greater than 0 (MACD line is above the Signal line, indicating bullish momentum).
Short Confirmation: The 15m MACD Histogram must be less than 0 (MACD line is below the Signal line, indicating bearish momentum).
RSI (Relative Strength Index) (14): A momentum oscillator. The 50 level is often used to determine the general market trend.
Long Confirmation: The 15m RSI must be greater than 50 (indicating stronger bullish momentum).
Short Confirmation: The 15m RSI must be less than 50 (indicating stronger bearish momentum).
The Total 15m Confirmation is only true if both the MACD and the RSI confirmation signals align.
3. Trade Orders (Entry Logic) ⚖️
The strategy only executes a trade when the 5-minute entry conditions are met AND the 15-minute confirmation conditions are met.
Final Long Condition:
5m Conditions (Supertrend, GHL, EMA alignment) AND
15m Confirmation (MACD Hist > 0 AND RSI > 50)
Final Short Condition:
5m Conditions (Supertrend, GHL, EMA alignment) AND
15m Confirmation (MACD Hist < 0 AND RSI < 50)
When a trade signal is generated, the strategy:
Closes any opposite position (e.g., closes a "Short" trade if a "Long" signal appears).
Enters the new position (e.g., enters a "Long" trade).
This is designed as a reversal strategy where a new entry automatically closes the previous opposing trade.
In Summary
The strategy operates on a principle of Trend Alignment:
5-Minute Chart: Is used for Signal Timing (when exactly to enter the market).
15-Minute Chart: Is used for Trend Validation (is the overall market momentum supporting the signal?).
It's an attempt to capture short-term moves (5m signals) that are backed by strong medium-term momentum (15m confirmation), thereby aiming for higher probability trades.
This is not investment advice; it is recommended to perform optimization and backtesting for the assets intended for implementation.

Strat Reversal MTF TableStrat Reversal MTF Table — Your Complete Multi-Timeframe Strat Command Center
Take your Strat trading to the next level with an indicator that shows every reversal, on every timeframe, in one powerful visual dashboard.
Designed for traders who demand speed, clarity, and full Strat alignment, the Strat Reversal MTF Table instantly identifies all major bullish and bearish reversal patterns:
Bullish Patterns
2-1-2
3-1-2
1-3-2
3-2-2
Bearish Patterns
2-1-2
3-1-2
1-3-2
3-2-2
Each signal is displayed with:
Clear pattern name (e.g., “2-1-2 Bull”)
Automatic trigger price
Timeframe label
Color-coded background (Bullish / Bearish / Neutral)
Whether you trade options, equities, futures, or crypto, this indicator makes it effortless to see what’s flipping — and where the strongest setups are emerging.
🔥 Key Features
📊 Multi-Timeframe Scanning (1 min → Daily)
Monitor 7 customizable timeframes at once.
From scalping to swing trading, you always know which timeframe is turning.
⚡ Real-Time OR Close-Confirmed Logic
Choose your style:
Realtime (Wick Mode) → Fast entries
Close-Confirmed → Stronger validation
Ideal for traders who want precision on any timeframe.
🎨 Clean & Customizable Dashboard
Move the table anywhere on the chart
Adjust text size
Choose your own colors
Lightweight and non-intrusive
A perfect blend of simplicity and power.
📩 Instant Alerts, Built In
Get notified instantly when:
Any timeframe reverses
A specific timeframe flips
Multiple reversals fire across the stack
The indicator works great with TradingView’s push notifications, email, and webhooks.
🎯 What This Helps You Do
✔ Catch Strat reversals as they happen
✔ Quickly spot full-timeframe alignment
✔ Improve your entries for options plays
✔ Avoid chop by reading higher-timeframe intent
✔ Trade more confidently with automated trigger levels
This indicator is built for Strat traders who want to trade smarter, faster, and cleaner.
✨ Perfect For
Strat Traders
Options Traders
Futures Scalpers
Intraday & Swing Traders
Quant/Algo-inspired traders
Anyone following Rob Smith’s methodology

Turtle System 1 Long & Short (Donchian + N-Stop) + MTF Table V6 Turtle Trading Long & Short (System 1 – 20/10 Donchian + True 2N Trailing Stop) + Multi-Timeframe Dashboard – Pine Script v6This indicator is a 100 % faithful implementation of the famous original Turtle Trading System 1 (Richard Dennis & William Eckhardt) with the following genuine rules:Entry: 20-period Donchian Channel breakout (using the high/low of the previous completed bars only → )
Exit: Classic 10-period Donchian opposite breakout OR hit of the volatility-based stop
Risk Management: True 2N trailing stop (N = 20-period ATR). The stop is pulled tighter on every new favorable extreme (real Turtle trailing – not fixed!)
Fully dynamic position tracking (Long / Short / Flat) on the chart’s timeframe
Visual signals: green/red triangles for entries, diamonds for exits, trailing stop line, entry labels with current N and stop price
Unique Feature – Multi-Timeframe (MTF) Status Table
A clean table in the top-right corner instantly shows the current Turtle position status on five higher timeframes simultaneously:Turtle MTF
1H
4H
8H
1D
1W
Status
LONG / SHORT / FLAT (color-coded)
This allows you to see at a glance whether higher timeframes are already in a Turtle trend – perfect for trend confirmation, filtering, or multi-timeframe trading.Key Visual ElementsLime upper Donchian line (20-period high)
Red lower Donchian line (10-period low)
Gray channel fill
Fuchsia trailing 2N stop line (moves only in favorable direction)
Entry labels showing current N-value and exact stop price
Arrows and diamonds for entries/exits
Alerts
Two ready-to-use alert conditions:“Turtle Long Entry”
“Turtle Short Entry”
Works on any market and any chart timeframe (stocks, forex, futures, crypto).
Completely written and tested in Pine Script version 6.A true, clean, no-nonsense Turtle System 1 with real trailing volatility stops and a powerful higher-timeframe dashboard – exactly how the original Turtles traded (only better visualized)! Enjoy the trends!

EMA MTF Trend Dashboard (Cross & Bias Modes)EMA MTF Trend Dashboard (Cross & Bias Modes)
A clean, multi-timeframe trend-alignment tool designed to support disciplined entries and higher-probability trades.
________________________________________
🔍 What This Dashboard Does
The EMA MTF Trend Dashboard provides a clear, structured view of trend direction across seven key timeframes:
1m • 5m • 15m • 30m • 1H • 4H • Daily
It highlights your execution timeframe, displays EMA-based trend direction per timeframe, and produces a plain-English directional bias using either Single EMA mode or Dual EMA Cross mode.
This makes it useful for scalpers, intraday traders, swing traders, and anyone who wants clarity before executing a trade.
________________________________________
🧠 How to Read the Dashboard
1. Execution Timeframe (Blue Row)
The blue row is your execution timeframe — the timeframe used to calculate the final bias.
• In Chart mode, it automatically matches your current chart timeframe.
• In Locked mode, it remains fixed, even if you switch to other chart timeframes.
This ensures consistency and removes any ambiguity before entering a trade.
________________________________________
2. EMA Mode (Use Any Length You Like)
You’re free to choose any EMA lengths — the dashboard adapts to your strategy.
• Smaller EMAs (5–20):
React quickly and highlight short-term momentum changes or early trend shifts.
• Larger EMAs (50–200+):
Move more slowly and provide a smoother read of overall trend structure, filtering out low-timeframe noise.
This flexibility lets you tune the dashboard to your preferred approach — whether you want fast tactical signals or slower, more stable directional structure.
________________________________________
3. Cross & Bias Modes
The dashboard supports two core engines:
✔ Single EMA Mode (Price vs EMA + ATR Neutral Buffer)
A trend-following model that avoids false signals when price is close to the EMA.
✔ Dual EMA Cross Mode (Fast vs Slow EMA)
A crossover-based trend engine ideal for traders who prefer structure shifts based on EMA alignment.
You can switch modes instantly from the settings.
________________________________________
4. Bias (Plain-English Trend Assessment)
The bias row at the bottom shows the overall directional bias for the blue timeframe, calculated using weighted multi-timeframe logic:
• Strong Bull
• Bullish
• Neutral
• Bearish
• Strong Bear
This provides instant clarity on whether market conditions support (or conflict with) your trade idea.
________________________________________
5. Trend Table (Heatmap View)
Each timeframe shows:
• ▲ Bullish
• ▼ Bearish
• – Neutral
Colour coded for clarity:
• Green = bullish
• Red = bearish
• Grey = neutral
• Blue = execution timeframe highlight
This creates a clean, at-a-glance trend heatmap.
________________________________________
⚙️ Customisation Options
• Fully adjustable EMA lengths
• Single EMA mode (with ATR neutral zone)
• Dual EMA Cross mode (fast/slow)
• Selectable text colour (dark/light theme friendly)
• Execution timeframe mode: Chart or Locked
• Compact and visually clear table layout
________________________________________
✔ Why This Tool Helps
This dashboard gives traders a structured, rule-aligned view of trend direction by:
• Keeping you aligned with broader multi-timeframe structure
• Reducing counter-trend mistakes
• Clarifying trend shifts and momentum changes
• Making decision-making faster and more consistent
• Supporting any systematic or rule-based trading plan
It is a decision-support tool, not a buy/sell signal — making it useful for all trading styles.
________________________________________
📌 Notes for Users
• Non-repainting (uses confirmed closes)
• Works universally: Forex, crypto, indices, commodities
• Suitable for scalpers, day-traders, swing traders
________________________________________
💬 Feedback & Future Enhancements
If you’d like to see additional timeframes, alternative trend engines, an ultra-compact mode, or alert integrations, feel free to request upgrades.

VPG – MTF PrevClose Dashboard (Horizontal 6TF, Bottom Right, VPG – MTF PrevClose Dashboard is a lightweight, real-time visual indicator that displays the current price position across six key timeframes — Weekly (W), Daily (D), 4H, 1H, 30m, and 15m.
It compares the current market price to the previous candle close and shows whether the price is:
🟢 RALLY → higher than the previous close
🔵 BASE → roughly equal (sideways / consolidation)
🔴 DROP → lower than the previous close
Designed as a clean, horizontal dashboard fixed at the bottom-right corner of your chart, it provides instant multi-timeframe insight without cluttering your workspace.
⚙️ Key Features
🔹 Real-time monitoring of six key timeframes (W, D, 4H, 1H, 30m, 15m)
🔹 Clear and intuitive color scheme: Green = RALLY, Blue = BASE, Red = DROP
🔹 Fixed bottom-right placement for consistent visibility
🔹 Horizontal layout for compact, at-a-glance analysis
🔹 Adjustable tolerance to define how “equal” prices are classified as BASE
🔹 No alerts or labels — clean, fast, and resource-light
📊 Best For
Multi-timeframe traders who need quick directional context
Scalpers, intraday, and swing traders doing top-down analysis
Dashboard lovers who want a minimalist, data-driven overview
Confirming short-term price moves against higher-timeframe trends
💡 How to Use
Add VPG – MTF PrevClose Dashboard to any chart (Forex, Crypto, Stocks, Gold, Indices, etc.).
Adjust the tolerance parameter if you want a wider or stricter “BASE” range.
Watch the table in the bottom-right corner — it updates live with every price move.
🧠 About the Author
Nizar M — Developer of VPG indicators focused on clarity, momentum visualization, and fast market interpretation for real-time decision-making.

Wyckoff Stage Approximator (MTF Alerts)Wyckoff Stage Approximator (MTF Context)
This indicator is a powerful tool designed for traders who use a top-down, multi-timeframe approach based on Wyckoff principles. Its primary function is to identify the market's current stage—consolidation (Stage 1) or trend (Stage 2)—on a higher Context (C) timeframe and project that analysis onto your lower Validation (V) and Entry (E) charts.
This ensures you are always trading in alignment with the "big picture" trend, preventing you from taking low-probability trades based on lower-timeframe noise.
Core Concept: Top-Down Analysis
The script solves a common problem for multi-timeframe traders: losing sight of the primary trend. By locking the background color to your chosen Context timeframe (e.g., 15-minute), you are constantly reminded of the market's true state.
🟡 Yellow Background (Stage 1): The Context timeframe is in consolidation. This is a time to be patient and wait for a clear directional bias to emerge.
🟢 Green Background (Stage 2 - Markup): The Context timeframe is in a confirmed uptrend. This is your green light to look for bullish pullback opportunities on your lower timeframes.
🔴 Red Background (Stage 2 - Markdown): The Context timeframe is in a confirmed downtrend. This is your signal to look for bearish rally opportunities.
How It Works
The indicator uses a combination of moving averages and trend strength to objectively define each stage:
Trend Alignment: It checks if the 5 EMA, 10 EMA, and 20 EMA are properly stacked above or below the 50 SMA to determine the potential trend direction.
Trend Strength: It uses the ADX to measure the strength of the trend. A trend is only confirmed as Stage 2 if the ADX is above a user-defined threshold (default is 23), filtering out weak or choppy moves.
Stage Definition: Any period that is not a confirmed, strong Stage 2 Markup or Markdown is classified as a Stage 1 consolidation phase.
Key Features
Multi-Timeframe (MTF) Projection: Select your master "Context" timeframe, and its analysis will be displayed on any chart you view.
Customizable Inputs: Easily adjust the moving average lengths and ADX threshold to fit your specific strategy and the asset you are trading.
Clear Visual Cues: The intuitive background coloring makes it easy to assess the market environment at a glance.
Stage Transition Alerts: Set up specific alerts to be notified the moment your Context timeframe shifts from a Stage 1 consolidation to a Stage 2 trend, ensuring you never miss a potential setup.
How to Use This Indicator
Add the indicator to your chart.
In the settings, set the "Context Timeframe" to your highest timeframe (e.g., "15" for 15-minute).
Create alerts for the "Stage 1 -> Stage 2" conditions.
When you receive an alert, it signals that a potential trend is beginning on your Context chart.
Switch to your lower Validation and Entry timeframes. The background color will confirm the higher-timeframe trend, giving you the confidence to look for your specific entry patterns.
Disclaimer: This tool is designed for confluence and environmental analysis. It is not a standalone signal generator. It should be used in conjunction with your own price action, volume, or order flow analysis to validate trade entries.
Parabolic SAR MTF LinesThe indicator shows the Parabolic SAR sign (price above or below the indicator) for several timeframes at once. You can see at a glance how the price is trending across higher and lower timeframes.
Note that, for lower timeframes, the line becomes yellow to the left because history is limited and there are not enough bars to calculate.
Other features (can be enabled in settings):
* each line can be enabled or disabled individually, so that unused ones can be hidden.
* simple trend detection based on the number of bullish and bearish timeframes; threshold can be changed in Settings.
* "Score" output: counting the net number of bullish and bearish timeframes
* "Trend" output: changes to bullish or bearish as the score goes over or under the threshold
* background color (green or red according to trend).
* alert for trend change.
* another alert with a separate threshold score for flexibility.
* score weights for further customization of trend detection and alerts. Input parameters are set in terms of score values instead of number of lines.
* input options to choose alert modes for trend and extra alerts. The options are "once per bar close" (default), "once per bar", "every time".
This indicator was based on MACD MTF Lines where all the logic and features came from.

Swing Dashboard - Pro Trader Metrics with MTF & Enhanced VolumeDESCRIPTION:
A comprehensive real-time dashboard designed for swing traders and active investors trading US equities. Displays all critical metrics in one customizable panel overlay - no need to clutter your chart with multiple indicators.
KEY FEATURES:
📊 Relative Strength Analysis:
Stock vs Market (SPY/QQQ/IWM/DIA)
Stock vs Sector (automatic sector ETF detection)
Sector vs Market comparison
Customizable lookback period (5-60 days)
📈 Price & Range Metrics:
Daily range, change, and gap percentages
Distance from SMA20, SMA50, VWAP
52-week position percentage
ATR% and ADR% for volatility assessment
Range/ADR ratio for breakout detection
💪 Advanced Volume Analysis:
RVOL (full day volume vs 20-day average)
Volume Strength (bar-by-bar analysis)
Volume Trend (5-day vs 20-day momentum)
Customizable RVOL alert thresholds
Non-repainting volume calculations
⚙️ Multi-Timeframe (MTF) Mode:
View daily charts with 5-min or 15-min metric updates
Perfect for monitoring positions without switching timeframes
All calculations remain accurate across timeframes
🎨 Fully Customizable:
Choose which metrics to display
9 position options for the dashboard
Adjustable text size and colors
Toggle individual metrics on/off
Sector-specific ETF mapping for accurate RS calculations
TECHNICAL SPECIFICATIONS:
✅ Non-repainting - all calculations use confirmed bar data
✅ No lookahead bias or future data
✅ Optimized for US stocks with proper sector mapping
✅ Works on any timeframe (best on 5m-Daily)
✅ Pine Script v6 with best practices
✅ Handles edge cases and missing data gracefully
IDEAL FOR:
Swing traders monitoring multiple positions
Day traders needing quick metric overview
Investors tracking relative strength and momentum
Anyone who wants institutional-grade metrics in one place
SECTOR ETF MAPPING:
Automatically maps to correct sector ETFs: XLK, XLF, XLV, XLY, XLP, XLE, XLB, XLI, XLRE, XLC, XLU
HOW TO USE:
Green = Positive/Strong | Red = Negative/Weak | White = Neutral
RS > 0 = Outperforming benchmark/sector
RVOL > 1.5x = High volume day
VWAP% negative = Price below VWAP (mean reversion opportunity)
R/ADR > 100% = Extended range (potential exhaustion)
Perfect for traders who need professional-grade analysis without chart clutter.
TAGS:
dashboard, swing, relativestrengrh, sectoranalysis, volume, rvol, multitimeframe, mtf, tradingdashboard, metrics, daytrading, swingtrading, momentum, vwap, atr, volatility, volumeanalysis

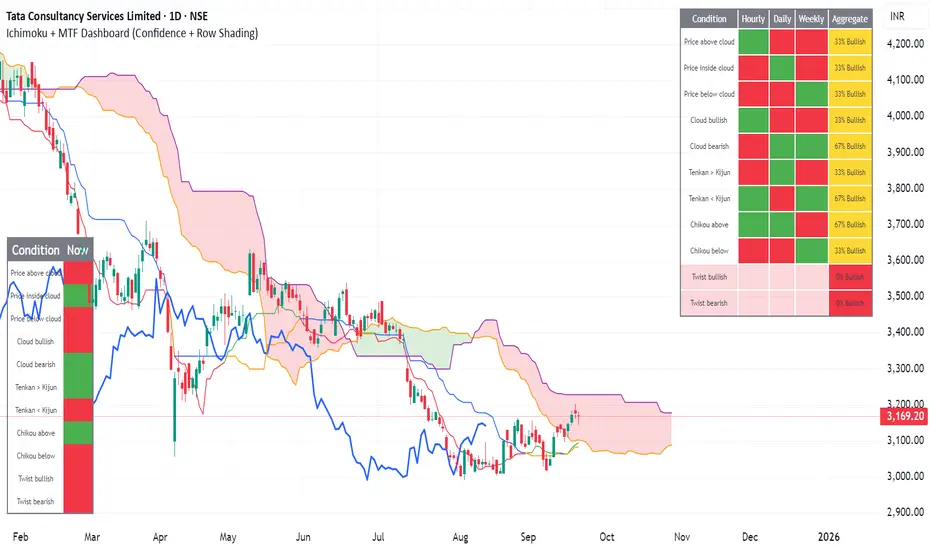
Ichimoku + MTF Dashboard (Confidence + Row Shading)Name: Ichimoku + Multi-Timeframe (MTF) Dashboard
Purpose
This indicator is designed to give a complete trend, momentum, and alignment picture of a stock across multiple timeframes (hourly, daily, weekly) using the Ichimoku Kinko Hyo system. It combines:
Classic Ichimoku signals: Tenkan/Kijun crossovers, cloud position (Kumo), Chikou span, and cloud twists.
MTF Dashboard: Aggregates hourly, daily, and weekly Ichimoku conditions into a clean visual table.
Dynamic coloring: Each signal is represented with green/red fills, and rows are shaded for full alignment. Aggregate column highlights mixed signals in yellow.
Smart MTF S/R Levels[BullByte]
Smart MTF S/R Levels
Introduction & Motivation
Support and Resistance (S/R) levels are the backbone of technical analysis. However, most traders face two major challenges:
Manual S/R Marking: Drawing S/R levels by hand is time-consuming, subjective, and often inconsistent.
Multi-Timeframe Blind Spots: Key S/R levels from higher or lower timeframes are often missed, leading to surprise reversals or missed opportunities.
Smart MTF S/R Levels was created to solve these problems. It is a fully automated, multi-timeframe, multi-method S/R detection and visualization tool, designed to give traders a complete, objective, and actionable view of the market’s most important price zones.
What Makes This Indicator Unique?
Multi-Timeframe Analysis: Simultaneously analyzes up to three user-selected timeframes, ensuring you never miss a critical S/R level from any timeframe.
Multi-Method Confluence: Integrates several respected S/R detection methods—Swings, Pivots, Fibonacci, Order Blocks, and Volume Profile—into a single, unified system.
Zone Clustering: Automatically merges nearby levels into “zones” to reduce clutter and highlight areas of true market consensus.
Confluence Scoring: Each zone is scored by the number of methods and timeframes in agreement, helping you instantly spot the most significant S/R areas.
Reaction Counting: Tracks how many times price has recently interacted with each zone, providing a real-world measure of its importance.
Customizable Dashboard: A real-time, on-chart table summarizes all key S/R zones, their origins, confluence, and proximity to price.
Smart Alerts: Get notified when price approaches high-confluence zones, so you never miss a critical trading opportunity.
Why Should a Trader Use This?
Objectivity: Removes subjectivity from S/R analysis by using algorithmic detection and clustering.
Efficiency: Saves hours of manual charting and reduces analysis fatigue.
Comprehensiveness: Ensures you are always aware of the most relevant S/R zones, regardless of your trading timeframe.
Actionability: The dashboard and alerts make it easy to act on the most important levels, improving trade timing and risk management.
Adaptability: Works for all asset classes (stocks, forex, crypto, futures) and all trading styles (scalping, swing, position).
The Gap This Indicator Fills
Most S/R indicators focus on a single method or timeframe, leading to incomplete analysis. Manual S/R marking is error-prone and inconsistent. This indicator fills the gap by:
Automating S/R detection across multiple timeframes and methods
Objectively scoring and ranking zones by confluence and reaction
Presenting all this information in a clear, actionable dashboard
How Does It Work? (Technical Logic)
1. Level Detection
For each selected timeframe, the script detects S/R levels using:
SW (Swing High/Low): Recent price pivots where reversals occurred.
Pivot: Classic floor trader pivots (P, S1, R1).
Fib (Fibonacci): Key retracement levels (0.236, 0.382, 0.5, 0.618, 0.786) over the last 50 bars.
Bull OB / Bear OB: Institutional price zones based on bullish/bearish engulfing patterns.
VWAP / POC: Volume Weighted Average Price and Point of Control over the last 50 bars.
2. Level Clustering
Levels within a user-defined % distance are merged into a single “zone.”
Each zone records which methods and timeframes contributed to it.
3. Confluence & Reaction Scoring
Confluence: The number of unique methods/timeframes in agreement for a zone.
Reactions: The number of times price has touched or reversed at the zone in the recent past (user-defined lookback).
4. Filtering & Sorting
Only zones within a user-defined % of the current price are shown (to focus on actionable areas).
Zones can be sorted by confluence, reaction count, or proximity to price.
5. Visualization
Zones: Shaded boxes on the chart (green for support, red for resistance, blue for mixed).
Lines: Mark the exact level of each zone.
Labels: Show level, methods by timeframe (e.g., 15m (3 SW), 30m (1 VWAP)), and (if applicable) Fibonacci ratios.
Dashboard Table: Lists all nearby zones with full details.
6. Alerts
Optional alerts trigger when price approaches a zone with confluence above a user-set threshold.
Inputs & Customization (Explained for All Users)
Show Timeframe 1/2/3: Enable/disable analysis for each timeframe (e.g., 15m, 30m, 1h).
Show Swings/Pivots/Fibonacci/Order Blocks/Volume Profile: Select which S/R methods to include.
Show levels within X% of price: Only display zones near the current price (default: 3%).
How many swing highs/lows to show: Number of recent swings to include (default: 3).
Cluster levels within X%: Merge levels close together into a single zone (default: 0.25%).
Show Top N Zones: Limit the number of zones displayed (default: 8).
Bars to check for reactions: How far back to count price reactions (default: 100).
Sort Zones By: Choose how to rank zones in the dashboard (Confluence, Reactions, Distance).
Alert if Confluence >=: Set the minimum confluence score for alerts (default: 3).
Zone Box Width/Line Length/Label Offset: Control the appearance of zones and labels.
Dashboard Size/Location: Customize the dashboard table.
How to Read the Output
Shaded Boxes: Represent S/R zones. The color indicates type (green = support, red = resistance, blue = mixed).
Lines: Mark the precise level of each zone.
Labels: Show the level, methods by timeframe (e.g., 15m (3 SW), 30m (1 VWAP)), and (if applicable) Fibonacci ratios.
Dashboard Table: Columns include:
Level: Price of the zone
Methods (by TF): Which S/R methods and how many, per timeframe (see abbreviation key below)
Type: Support, Resistance, or Mixed
Confl.: Confluence score (higher = more significant)
React.: Number of recent price reactions
Dist %: Distance from current price (in %)
Abbreviations Used
SW = Swing High/Low (recent price pivots where reversals occurred)
Fib = Fibonacci Level (key retracement levels such as 0.236, 0.382, 0.5, 0.618, 0.786)
VWAP = Volume Weighted Average Price (price level weighted by volume)
POC = Point of Control (price level with the highest traded volume)
Bull OB = Bullish Order Block (institutional support zone from bullish price action)
Bear OB = Bearish Order Block (institutional resistance zone from bearish price action)
Pivot = Pivot Point (classic floor trader pivots: P, S1, R1)
These abbreviations appear in the dashboard and chart labels for clarity.
Example: How to Read the Dashboard and Labels (from the chart above)
Suppose you are trading BTCUSDT on a 15-minute chart. The dashboard at the top right shows several S/R zones, each with a breakdown of which timeframes and methods contributed to their detection:
Resistance zone at 119257.11:
The dashboard shows:
5m (1 SW), 15m (2 SW), 1h (3 SW)
This means the level 119257.11 was identified as a resistance zone by one swing high (SW) on the 5-minute timeframe, two swing highs on the 15-minute timeframe, and three swing highs on the 1-hour timeframe. The confluence score is 6 (total number of method/timeframe hits), and there has been 1 recent price reaction at this level. This suggests 119257.11 is a strong resistance zone, confirmed by multiple swing highs across all selected timeframes.
Mixed zone at 118767.97:
The dashboard shows:
5m (2 SW), 15m (2 SW)
This means the level 118767.97 was identified by two swing points on both the 5-minute and 15-minute timeframes. The confluence score is 4, and there have been 19 recent price reactions at this level, indicating it is a highly reactive zone.
Support zone at 117411.35:
The dashboard shows:
5m (2 SW), 1h (2 SW)
This means the level 117411.35 was identified as a support zone by two swing lows on the 5-minute timeframe and two swing lows on the 1-hour timeframe. The confluence score is 4, and there have been 2 recent price reactions at this level.
Mixed zone at 118291.45:
The dashboard shows:
15m (1 SW, 1 VWAP), 5m (1 VWAP), 1h (1 VWAP)
This means the level 118291.45 was identified by a swing and VWAP on the 15-minute timeframe, and by VWAP on both the 5-minute and 1-hour timeframes. The confluence score is 4, and there have been 12 recent price reactions at this level.
Support zone at 117103.10:
The dashboard shows:
15m (1 SW), 1h (1 SW)
This means the level 117103.10 was identified by a single swing low on both the 15-minute and 1-hour timeframes. The confluence score is 2, and there have been no recent price reactions at this level.
Resistance zone at 117899.33:
The dashboard shows:
5m (1 SW)
This means the level 117899.33 was identified by a single swing high on the 5-minute timeframe. The confluence score is 1, and there have been no recent price reactions at this level.
How to use this:
Zones with higher confluence (more methods and timeframes in agreement) and more recent reactions are generally more significant. For example, the resistance at 119257.11 is much stronger than the resistance at 117899.33, and the mixed zone at 118767.97 has shown the most recent price reactions, making it a key area to watch for potential reversals or breakouts.
Tip:
“SW” stands for Swing High/Low, and “VWAP” stands for Volume Weighted Average Price.
The format 15m (2 SW) means two swing points were detected on the 15-minute timeframe.
Best Practices & Recommendations
Use with Other Tools: This indicator is most powerful when combined with your own price action analysis and risk management.
Adjust Settings: Experiment with timeframes, clustering, and methods to suit your trading style and the asset’s volatility.
Watch for High Confluence: Zones with higher confluence and more reactions are generally more significant.
Limitations
No Future Prediction: The indicator does not predict future price movement; it highlights areas where price is statistically more likely to react.
Not a Standalone System: Should be used as part of a broader trading plan.
Historical Data: Reaction counts are based on historical price action and may not always repeat.
Disclaimer
This indicator is a technical analysis tool and does not constitute financial advice or a recommendation to buy or sell any asset. Trading involves risk, and past performance is not indicative of future results. Always use proper risk management and consult a financial advisor if needed.

RSI Overbought/Oversold MTFRSI Overbought / Oversold MTF — Dashboard & Alerts
What it does
This script scans up to 13 symbols at once and shows their RSI readings on three lower‑time‑frames (1 min, 5 min, 15 min).
If all three RSIs for a symbol are simultaneously above the overbought threshold or below the oversold threshold, the script:
Prints the condition (“Overbought” / “Oversold”) in a color‑coded dashboard table.
Fires a one‑per‑bar alert so you never miss the move.
Key features
Feature Details
Multi‑symbol Default list includes BTC, ETH, SOL, BNB, XRP, ADA, AVAX, AVAAI, DOGE, VIRTUAL, SUI, ALCH, LAYER (all Binance pairs). Replace or reorder in the inputs.
Triple‑time‑frame check RSI is calculated on 1 m, 5 m, 15 m for each symbol.
Customizable thresholds Set your own RSI Period, Overbought and Oversold levels. Defaults: 14 / 70 / 30.
Color‑coded dashboard Top‑right table shows:
• Symbol name
• RSI 1 m / 5 m / 15 m (red = overbought, green = oversold, white = neutral)
• Overall Status column (“Overbought”, “Oversold”, “Mixed”).
Alerts built in Triggers once per bar whenever a symbol is overbought or oversold on all three time‑frames simultaneously.
Typical use cases
Scalp alignment — Enter when all short TFs agree on overbought/oversold extremes.
Mean‑reversion spotting — Identify stretched conditions across multiple coins without switching charts.
Quick sentiment scan — Glance at the dashboard to see where momentum is heating up or cooling down.
How to use
Add to chart (overlay = false; it sits in its own pane).
Adjust symbols & thresholds in the Settings panel.
Create alerts → choose “RSI Overbought/Oversold MTF” → “Any Alert() Function Call” to receive push, email, or webhook notifications.
Note: The script queries many symbols each bar; use on lower time‑frames only if your data limits allow.
For educational purposes only — not financial advice. Always test on paper before trading live.
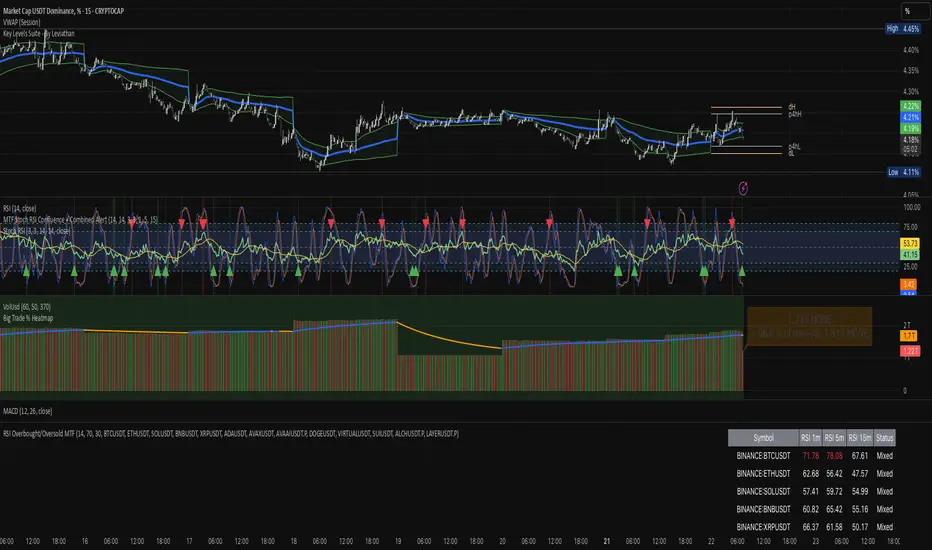
EMA-Pack MTFEMA-Pack MTF
This TradingView Pine Script defines a custom indicator called "EMA-Pack MTF" that overlays various types of moving averages and Bollinger Bands across multiple timeframes on a chart. It begins by importing the built-in technical analysis library and defining a custom ma function that calculates several types of moving averages (SMA, EMA, TEMA, DEMA, HMA, and ALMA) based on user input. The ema function is the core logic, retrieving market data for the specified timeframe and calculating fast, mid, slow, 50, 100, and 200-period moving averages along with Bollinger Band components (basis, upper, and lower bands). The function adjusts values to the nearest valid price tick and returns them.
User input fields allow customization of timeframes, source data, moving average types, and Bollinger Band parameters. The script calls the ema function for each selected timeframe (1 minute, 5 minutes, 15 minutes, 1 hour, 4 hours, and 1 day), storing their respective computed values. It then plots the calculated moving averages and Bollinger Band basis lines on the chart, using different colors and line widths to distinguish between them. Some plots are hidden by default (display.none) to reduce chart clutter. This script is useful for multi-timeframe trend analysis using customizable moving averages and Bollinger Bands.
