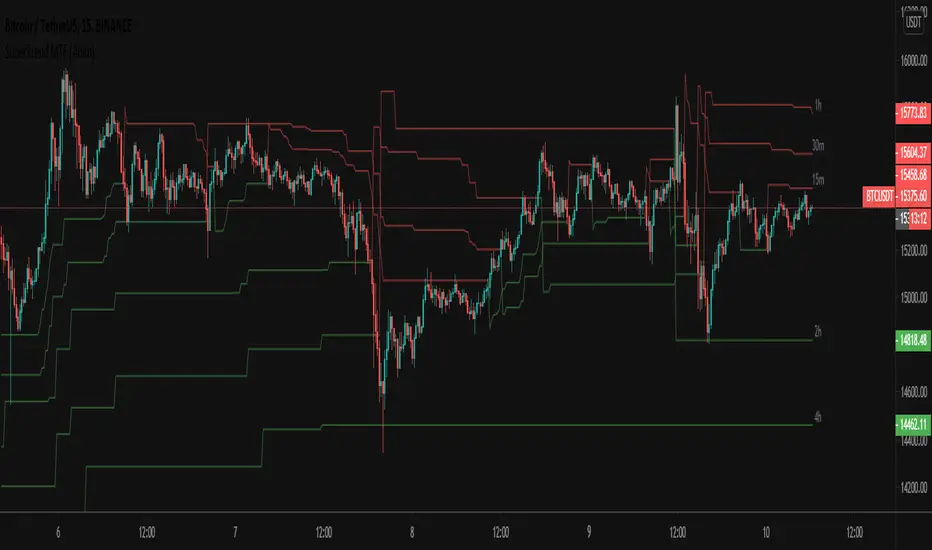
SuperTrend MTF [Anan]Hello friends,
As per many experts, supertrend indicator is best to use in combination with other indicators like MACD and RSI.
The best thing about supertrend it sends out accurate signals on precise time. The indicator offers quickest technical analysis to enable the intraday traders to make faster decisions. It is extremely simple to use and understand.
However, the indicator is not appropriate for all the situations. It works when the market is trending. Hence it is best to use for short-term technical analysis. Supertrend uses only the two parameters of ATR and multiplier which are not sufficient under certain conditions to predict the accurate direction of the market.
Understanding and identifying Bull and Bear signals in supertrend is the main crux for the intraday traders. Both the downtrends as well uptrends are represented by the indicator. The flipping of the indicator over the closing price indicates signal. A Bull signal is indicated in green color whereas Bear signal is given as the indicator turns red.
Options:
- Change calculation source ( default SuperTrend uses: hl2)
- Change calculation method (default SuperTrend uses: RMA)
- Additional six multi-time frames SuperTrends
Cerca negli script per "mtf"
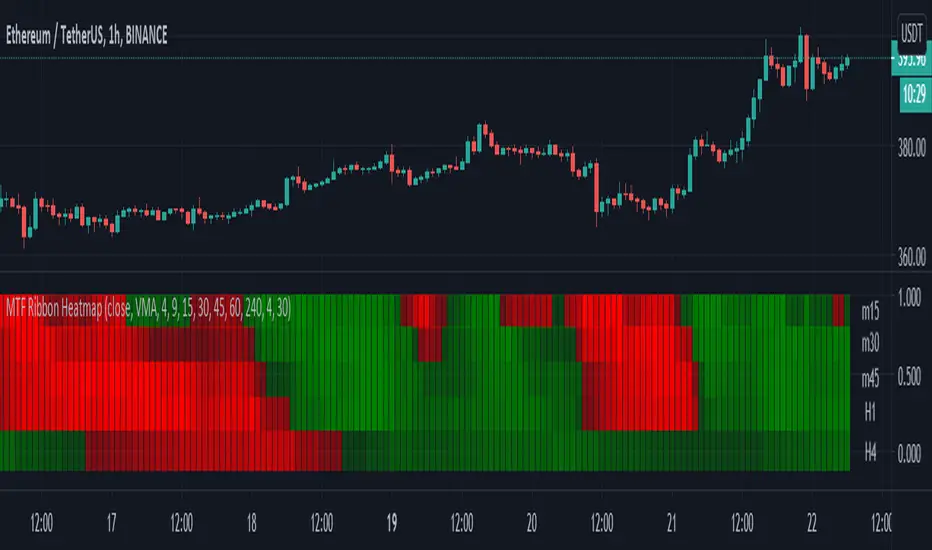
Moving Averages - 5 Ribbon MTF HeatmapThis is a 5 Ribbon heatmap moving averages indicator where each represents a different time frame, The RED or GREEN color palette is also affected by asset velocity using ATR.
Supports various moving averages including VMA (Default), Zero Lag, TSF (Time Series Forecast).
A single ribbon is set to GREEN when fast MA (moving average) is above the slower MA and RED when fast MA is below the slower MA.
In the settings you can set the ATR length (Average True Range) which will affect the velocity calculation for the colors, higher ATR length will smooth the coloring more (Less color changes), while lower ATR will show more instant changes.
HOW TO USE?
The brighter the GREEN is the stronger the up trend.
The brighter the RED is the stronger the down trend.
A weakening GREEN color can be a sign for a down reversal.
A weakening RED color can be a sign for a up reversal .
Supports alerts when fast moving average crosses slow moving average from all time frames, either way, up or down.
Comments/Suggested/Positive feedbacks are welcome and can make this indicator even better.
Follow for upcoming indicators: www.tradingview.com
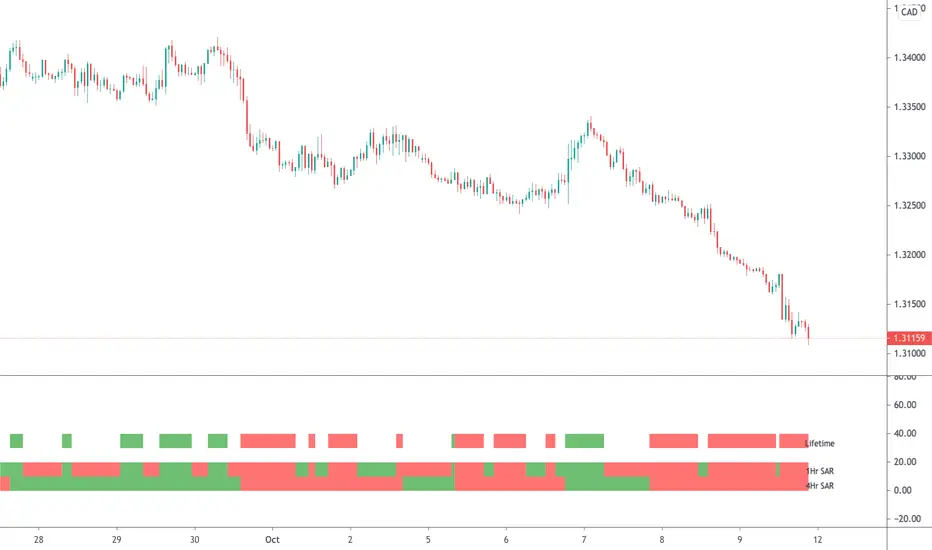
Parabolic SAR (MTF)This is a multi-timeframe Parabolic SAR indicator which uses 1 and 4 hour charts.
Using this indicator is simple, if the LifeTime line is green then buy, if red then sell OR don't trade. So...
Green Line - This strategy is in a buy position
Red Line - This strategy is in a sell position
Any other colour - DON'T TRADE
The traders approach is simple, when all indicators are green or red, then take the trade. As soon as one indicator changes, then re-evaluate using your normal process, such as price action, to determine whether to close the trade or continue.
If you require any further information or script modifications, please message me.
PLEASE CHECK OUT MY OTHER SCRIPTS
MA MTF Momentum HistogramMy own interpretation indicator which i call multi time frame moving averages momentum with NO LAG EMA support (Optional).
The indicator is calculated by subtracting the long-term EMA from the short-term EMA .
This pretty much resembles the MACD moving averages calculation but without the smoothing of the histogram.
Can also be used to find divergences.
The background shows the main trend with higher time frame which can be set in the settings.
Aimed to use with Higher time frame (Double or more) but can also work with lower time frame.
How to use the indicator?
==Histogram==
Green: Momentum of asset is positive and increasing.
Lighter Green: Momentum of asset is still positive but decreasing and can revert to negative momentum.
Red: Momentum of asset is negative and increasing.
Lighter Red: Momentum of asset is still negative but increasing and revert to positive momentum.
==Background Color - Main Trend==
Green: HTF (Higher time frame) momentum is positive.
RED: HTF momentum is negative.
Feel free to comment and Follow to stay updated with upcoming scripts: www.tradingview.com
NOTE: BARS ARE COLORED BY DEFAULT WITH HISTOGRAM COLORS! (Can be changed in settings)

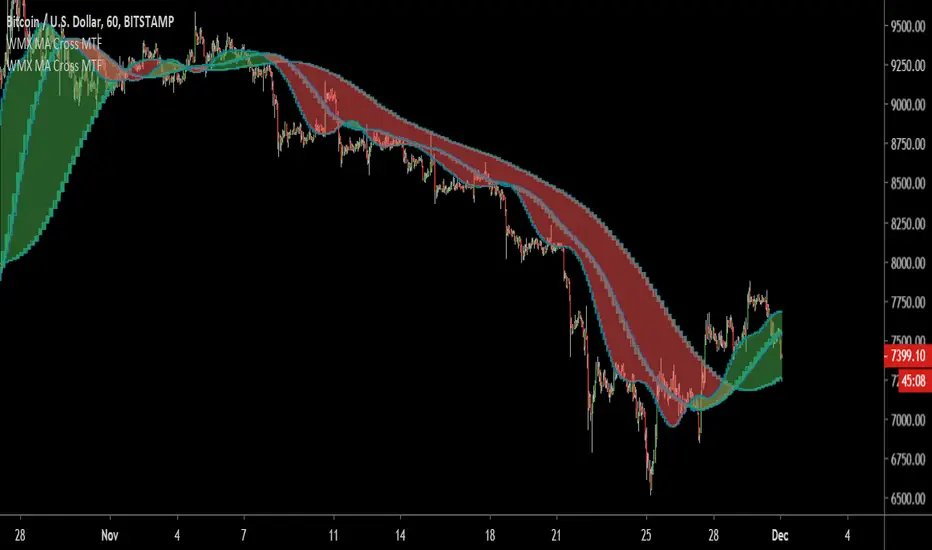
MA Cross - Multi-Timeframe The MA cross is probably one of my favourite strategies because of its simplicity but it often gets overlooked for more complex strategies.
The original author of this script is ChartArt, I have just added some extra controls and functions which are outlined below. I would just like to add that this is my first published script, everything I have learned about coding has been from studying and tinkering with many of the publicly available scripts on TV so I would like thank all the authors who give out this knowledge so freely!
Updates
- Converted to v4
- Made some graphical changes and provided more control over plots
- Added RMA and VWMA
- Added alerts
Original script can be found here
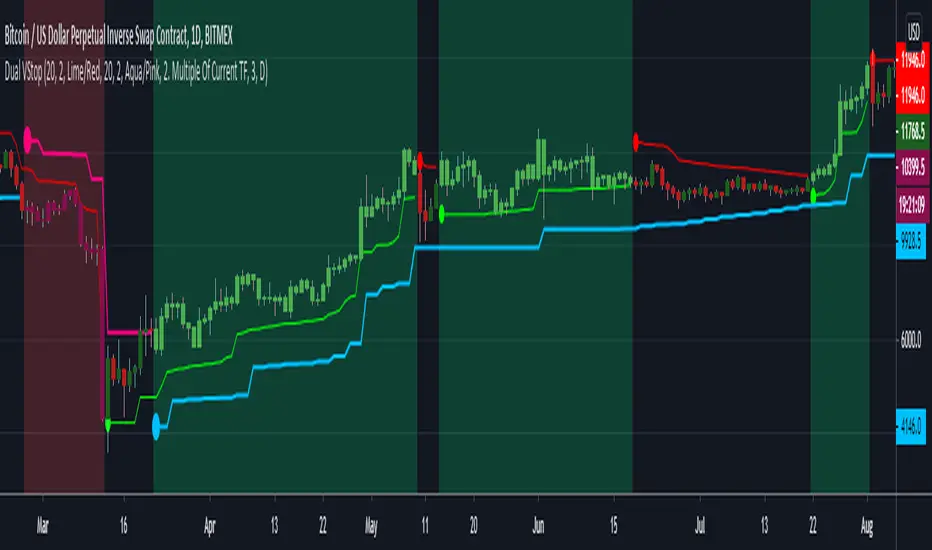
Dual Volatility StopThis merges Volatility Stop & its MTF version both published by u/TradingView . Background is colored green or red when both the current timeframe Vstop and higher timeframe Vstop point in same direction. Aim is to take the standard Vstop script which differentiates market from only uptrend/downtrend to uptrend/downtrend/sideways. There is a tradeoff with this, that there is no need for the Vstop to be always in a position which reduces trade time & frees up capital. However this leads to situations where it takes slightly more time to catch on to a trend after a reversal.
Green Background = Buy
Red Background = Sell
No Background = Flat
Kal's MTF OBV Haar Version 3Kal’s Multi-Time-Frame On-Balance-Volume Haar, also known as Kal’s MTF OBV Haar is a method/study for finding trending volume levels on stocks, indexes and cryptocurrencies using OBV, CMF and CCI over different time-frames (10Min, 1H, 4H, 1D, 1W, 1Month).
Upon adding to the 10Min chart, the sample Image in Tradingview looks as follows:
Note: Always check your time-frame(TF). Compare current TF to a row’s(bead row’s) time-frame. Ensure current TF is lower than a row’s time-frame when looking at it and higher time-frame rows above it. For instance, if you choose your chart’s time-frame at 1D, the lower time-frame rows(i.e. 10Min, 1H, 4H) don’t make sense.
For cryptocurrencies, one week is 7 periods, two weeks is 14 periods
For stocks, one week is 5 periods, two weeks is 10 periods
For the study of stocks, I used
9-period EMA over OBV for time-frames (10Min, 1H, 4H, D)
4-period EMA over OBV for time-frames (W, M)
For the study of cryptocurrencies, I would update EMAs as follows:
13-period EMA over OBV for time-frames (10Min, 1H, 4H, D)
6-period EMA over OBV for time-frames (W, M)
These days I'm finding the following parameters have better fitting
19-period EMA over OBV for time-frames (10Min, 1H, 4H, D)
9-period EMA over OBV for time-frames (W, M)
Description:
---------------
In the study plot, the lowest row is 10Min, the row above 10Min is 1H, then 4H, then 1D, then 1W and the highest row is 1M
Note: Always check your time-frame(TF). Compare current TF to a row’s(bead row’s) time-frame. Ensure current TF is lower than a row’s time-frame when looking at it and higher time-frame rows above it. For instance, if you choose your chart’s time-frame at 1D, the lower time-frame rows(i.e. 10Min, 1H, 4H) don’t make sense.
Lime( Bright Green) dot implies Trending Uptrend for that time-frame
Red dot implies Trending Downward for that time-frame
It’s best to wait and research for possibility of Trend Reversal during the following dots/bricks:
Silver dot implies indecisive up
Orange dot implies indecisive downtrend
Lime Brick implies CCI is near Zero line( between 15 and 0)
Red Brick implies CCI is near Zero line( between -15 and 0)
Purple dot implies CCI zero rejection to possibly/probably continue trend UP
Yellow dot implies CCI zero rejection to possibly/probably continue trend Down
Aqua dot implies that trend is overbought or oversold. This dot usually happens between red dots or green dots. Therefore, it’s best to wait for pull-back especially in lower time frames.
Safe Trading!
Kal Gandikota
Legal Disclaimer: This script is published here so I get replies from fellow viewers to educate myself. Hence, if anyone uses this script for making their financial decisions, I am not responsible for any failures incurred. If you have questions or improvements related to this script, please feel free to leave comments and as time permits, will respond to those comments.

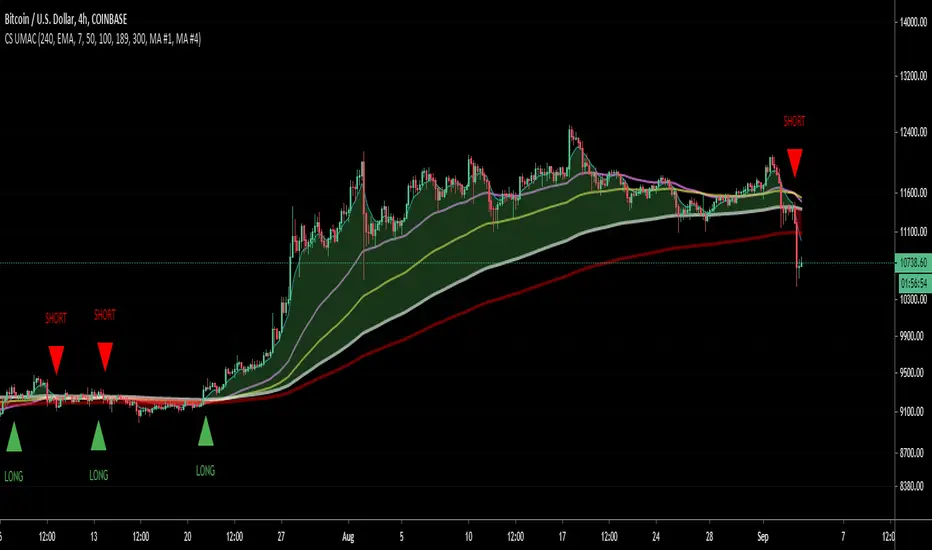
CS Ultimate MA CrossThis indicator adds 5 Moving Averages on your chart. You can select the MA Type: SMA, EMA, RMA or VWMA.
By selecting a Fast MA and a Slow MA you can also draw a cloud to make the Bull or Bear bias more visual. Possibility to add on the chart Long/Short signal.
MTF possible by changing the range which is particularly useful for HTF analysis while looking a LTF price action.
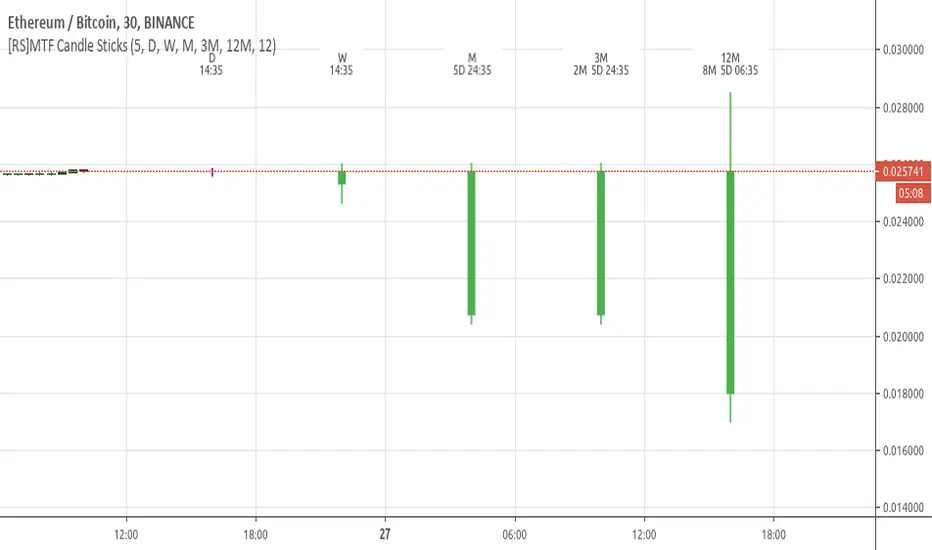
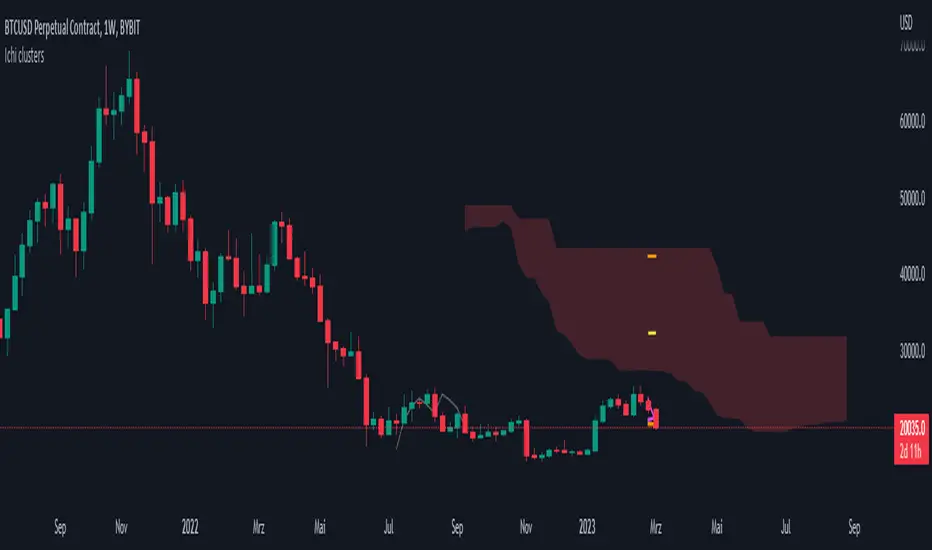
Ichimoku Kinko Hyo - mtf clustersThis script can show mtf-clusters from higher time frames. Tenkan-sen, Kijun-sen, Senko-span A and Senko-span B are displayed in the current time frame from higher time frames (the range is from 1 minute to the monthly time frame). Sometimes these levels form clusters that act as strong levels of support and resistance.
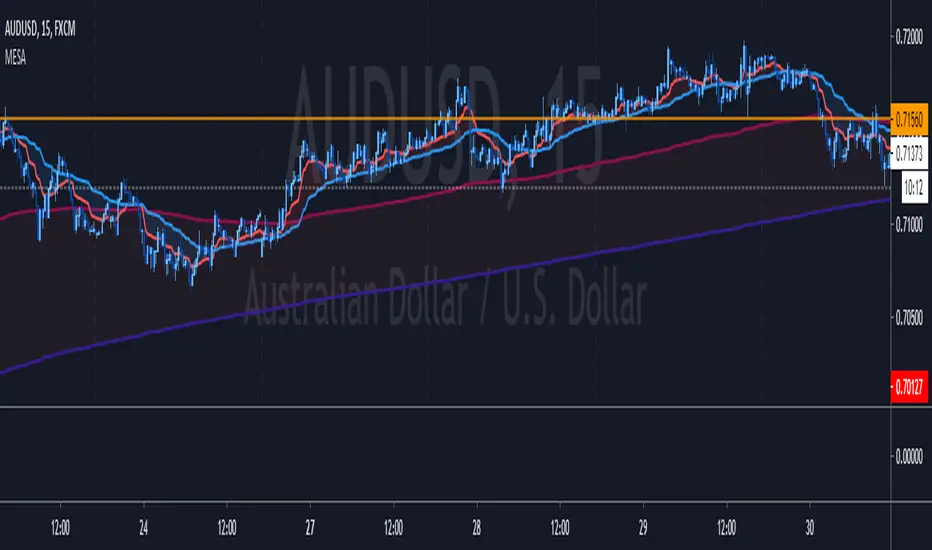
MESA Adaptive Moving Average - Improved MTFThis indicator is a huge upgrade to my original MTF MESA
Plots are now extremely smooth and accurate on all timeframes **
Missing data points are automatically filled with the "best fit"
This is a Trend indicator and should be used to trade "top-down" aka:
Start with the Daily chart to confirm a trend
Move to 4H
2H
Etc...
Use your favorite entry method or simply watch for wicks forming when the price gets near the MESA adaptive moving average.
This is one of the few indicators that I've been using for years with success. Being able to plot both the current & higher timeframe MESA
can sometimes feel like cheating.
Due to the nature of the recursive calculation, you may notice slight differences between this version of MESA and others that either
approximate higher timeframes with fewer samples or make use of the latest "Resolution" argument in Pinescript V4. Both of which are
fine, until you start looking at M5 charts while plotting the Daily MESA.
As always, happy trading!
** Currently supports
M 1,3,5,15,30,45
H 1,2,3,4
Day 1
Week 1
Month 1
Meander Indicator + fibo MTFI made Meander Indicator with fibo.
It also has MTF.
I haven't made the actual strategy yet, but it reacts quite well to short term, hourly or more.
Have a good day :)

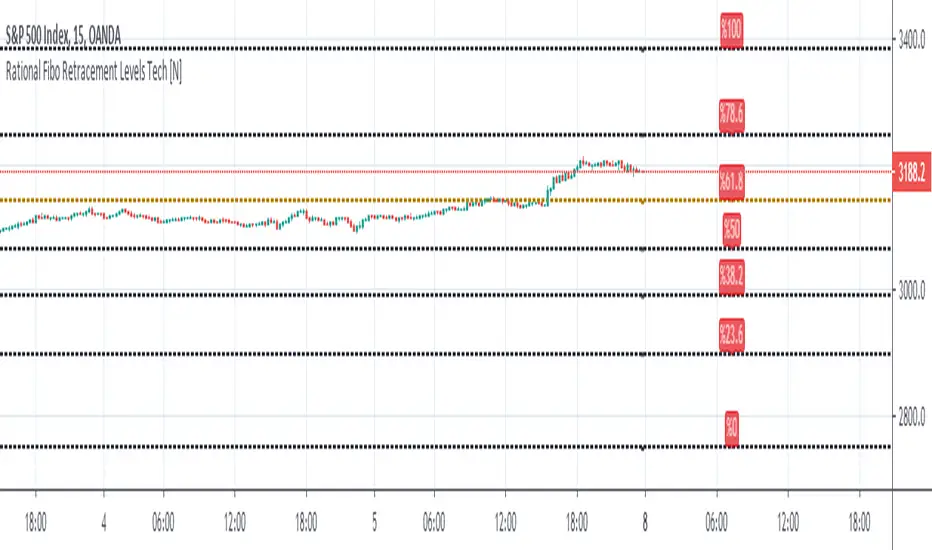
Rational MTF Auto - Fibonacci Retracement Levels Hello, this script automatically draws rational Support - Resistance Levels as multi time frame. (MTF)
In this way, we see reasonable levels ahead of us.
As of the date of birth: The first year after Lehmann Brother's fall was determined after January 1, 2009.
One feature of this script (which I deliberately left this way) :
If the security and support-resistance levels are equal, it will show you NA value and say wait.
Because it is based on a weekly basis for region selection, I think that it should enter a region and support-resistance levels should be drawn accordingly.
That's why I left it this way.
NOTE :
This script was inspired by the following publication :
Regards.
security free MTF example - JDThis script is not intended for trading purposes but gives some examples how you can get values
from previous candles in other timeframes, without using security calls.
NOTE: the "open", "high" and "low" values are calculated "on the fly", as the bar progresses,
the "close" is determined at the end of the timeframe, so it's only know at the first bar of the next time period
JD.
#NotTradingAdvice #DYOR
Disclaimer.
I AM NOT A FINANCIAL ADVISOR.
THESE IDEAS ARE NOT ADVICE AND ARE FOR EDUCATION PURPOSES ONLY.
ALWAYS DO YOUR OWN RESEARCH!

Combing in MACD and MTFHi all, I'm trying to wedge in the MACD into a multiple timeframe. Scope is to create:
1) an alert when the MACD across all timeframes is positive,
2) an alert when the MACD across all timeframes is negative, and
3) one when neither of them is applicable.
Would anyone be so kind to give it some thoughts, please?
//@version=2
strategy(" Easy MTF Strategy", overlay=false)
TF_1_time = input("3", "Timeframe 1")
TF_2_time = input("5", "Timeframe 2")
TF_3_time = input("15", "Timeframe 3")
TF_4_time = input("30", "Timeframe 4")
fastLen = input(title="Fast Length", type=integer, defval=12)
slowLen = input(title="Slow Length", type=integer, defval=26)
sigLen = input(title="Signal Length", type=integer, defval=9)
= macd(close, fastLen, slowLen, sigLen)
width = 5
upcolor = green
downcolor = red
neutralcolor = blue
linestyle = line
TF_1 = security(tickerid, TF_1_time, open) < security(tickerid, TF_1_time, close) ? true:false
TF_1_color = TF_1 ? upcolor:downcolor
TF_2 = security(tickerid, TF_2_time, open) < security(tickerid, TF_2_time, close) ? true:false
TF_2_color = TF_2 ? upcolor:downcolor
TF_3 = security(tickerid, TF_3_time, open) < security(tickerid, TF_3_time, close) ? true:false
TF_3_color = TF_3 ? upcolor:downcolor
TF_4 = security(tickerid, TF_4_time, open) < security(tickerid, TF_4_time, close) ? true:false
TF_4_color = TF_4 ? upcolor:downcolor
TF_global = TF_1 and TF_2 and TF_3 and TF_4
TF_global_bear = TF_1 == false and TF_2 == false and TF_3 == false and TF_4 == false
TF_global_color = TF_global ? green : TF_global_bear ? red : white
TF_trigger_width = TF_global ? 6 : width
plot(1, style=linestyle, linewidth=width, color=TF_1_color)
plot(5, style=linestyle, linewidth=width, color=TF_2_color)
plot(10, style=linestyle, linewidth=width, color=TF_3_color)
plot(15, style=linestyle, linewidth=width, color=TF_4_color)
plot(25, style=linestyle, linewidth=4, color=TF_global_color)
exitCondition_Long = TF_global_bear
exitCondition_Short = TF_global
longCondition = TF_global
if (longCondition)
strategy.entry("MTF_Long", strategy.long)
shortCondition = TF_global_bear
if (shortCondition)
strategy.entry("MTF_Short", strategy.short)
strategy.close("MTF_Long", when=exitCondition_Long)
strategy.close("MTF_Short", when=exitCondition_Short)

(NKC) MTF Squeeze Pro MultiTimeframe Squeeze Momentum Pro
Dots indicate squeeze
Fills indicate momentum

Percent Change MtFThis plots the selected resolution's percent change from open to close. Easy way to check the previous period's range with less noise. Note the latest period is calculating on a bar that hasn't closed so it won't update unless you refresh/change timeframes to prevent incorrect reporting.

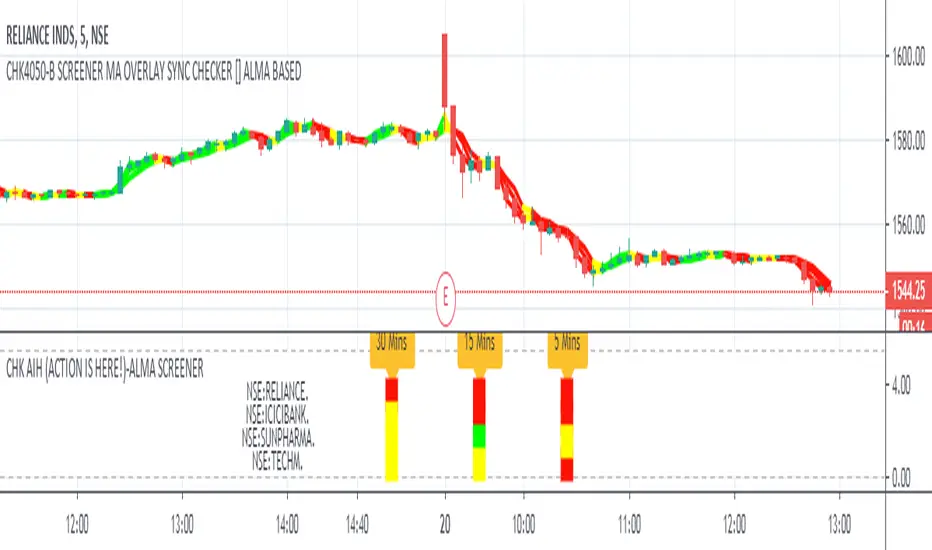
CHK AIH (ACTION IS HERE!)-ALMA SCREENERWe do not like to stare at the screen whole day, instead we like to jump where the
action is.... The Screener was written with this in mind
CHK AIH (ACTION IS HERE!)-ALMA BASED SCREENER
FEATURES
User can enter 3 Resolutions of his/her choice
User can select 3 Mov Avg Length of his her choice, which would be identical for all the three timeframes
User can enter stock basis his/her region's stock exchange
User can shift the screener left or right if not visible in a Multiscreen mode
Uses ALMA (Arnaud Legoux Mov Avg) as it smooth and reactive
Code is also provided below of MTF ALMA Moving Average OVERLAY on which this screener is based
LOGIC
For a particular timeframe If all the Moving Average are calibrated in one direction, it will show the requisite color.
For Example in an ideal scenario for a bull trend ALMA(5)> ALMA(13) > ALMA(21), once such a situation is identified, the screener will show green.
Yellow means lack of Calibration.
When 3 timeframes are calibrated, it becomes a high Probability Trade
BUGS
It is not allowing to enter the D/W/M timeframes, timeframe in numbers ...5/15/60 is working fine. If somebody can fix it
it would be great
LIMITATIONS
Because of TV's limitations only 4 scrips can be entered, however one add the indicator again with new scrips
//////////// CREDITS ////////////////////////////////////////////////////////////////////////////////////
//// hxxps://www.tradingview.com/script/rwdgyEZe/
/// Thank You Inno14 for graciously sharing your work. Your work has helped immensely !!!
////////////////////////////////////////////////////////////////////////////////////////////////////////
ICICIBANK
TECHMAHINDRA
YESBANK
Ichimoku Kinkō hyō Keizen 改MTF善The script is not finnished yet and show's an other interpretation of how it could be scripted
Step -1 is complete... Basic Ichimoku with asjutable length and editable lines colors and visibilities.
Step -2 in progress... Adding ability to une multiple Spans, sens and Kumo on higher and lower timeframe.
Your Step : Like and Share ;) have a good year 2020 !
2020-01-06 /--------/ -R.V.
Jan 06
Release Notes: The script is not finnished yet and show's an other interpretation of how it could be scripted
Step -1 is complete... Basic Ichimoku with asjutable length and editable lines colors and visibilities.
Step -2 in progress... Adding ability to une multiple Spans, sens and Kumo on higher and lower timeframe.
Your Step : Like and Share ;) have a good year 2020 !
2020-01-06 /--------/ -R.V.
Jan 07
Jan 13
Release Notes: MTF Ichimoku is on it's way !!
Jan 17
Release Notes: The script is not finnished yet and show's an interpretation of how it could be scripted
Step -1 is complete... Basic Ichimoku with asjutable length and editable lines colors and visibilities.
Step -2 in complete... Adding ability to use multiple Spans, sens and Kumo on higher timeframe.
Step -3 in progress... Creating a UNIX based function to framgments actual chart periods in subcandles or "Subprices/periods" to plot multiple Spans, sens and Kumo on LOWER timeframe.
Your Step : Like and Share ;) have a good year 2020 !
/--------Coder--------/ -R.V.

ANN BTC MTF Golden Cross Period MACDHi, this is the MACD version of the ANN BTC Multi Timeframe Script.
The MACD Periods were approximated to the Golden Cross values.
MACD Lengths :
Signal Length = 25
Fast Length = 50
Slow Length = 200
Regards.

ANN BTC MTF CM Sling Shot SystemHi all, this script was created as a result of ANN training in all time frames of bitcoin data.
Trained data is built on Chris Moody's Sling Shot system.
CM Sling Shot System :
This system automatically generates the ANN output for all time periods.
Therefore, it has multi-time-frame feature.
Artificial Neural Networks training details:
Average Errors
1 minute = 0.005570
3 minutes = 0.006674
5 minutes = 0.007067
15 minutes = 0.010000
30 minutes = 0.009398
45 minutes = 0.010000
1 Hour = 0.006848
2 Hours = 0.006901
3 Hours = 0.009608
4 Hours = 0.009774
1 Day = 0.010000
1 Week = 0.010000
The results look good (All Average Error <= 0.01 ), the Sling Shot Method is also good, but you can also refer to historically slower period averages to filter these arrows a bit more. I leave the decision to you.
Best regards.

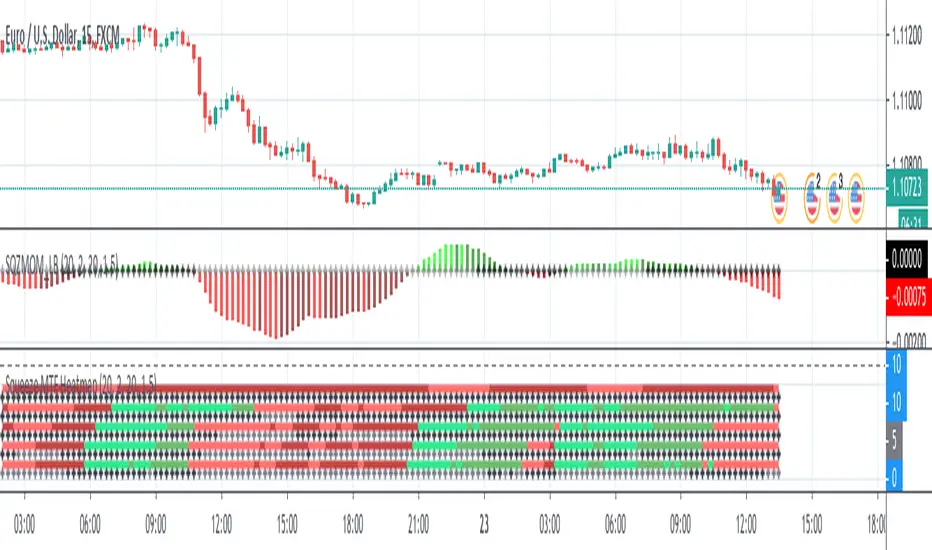
Squeeze MTF HeatmapHere is a multi-timeframe heat map using one of the most apreciated indicators in Tradingview: Squeeze Momentum Indicator by LazyBear.
Study shall be added to 15min chart.
It indicates squeeze and momentum at: 15 min, 30 min, 60 min, 240 min and 1 Day.
Thanks to © azimuthdynamics for inspiration and portion of code
Thanks to Lazy Bear for coding Squeeze Momentum Indicator