LinReg Bias MTF + Trading Scenario [Multi-Asset]LinReg Bias MTF + Trading Scenario
Advanced multi-timeframe linear regression indicator with automated trading scenarios for Forex, Commodities, and Indices.
KEY FEATURES:
Multi-timeframe bias analysis (H4, H1, M30/M15)
Linear regression channel with standard deviation bands
Pre-optimized profiles for Forex Majors, Gold, Crude Oil (CL), Copper, US Indices (ES/NQ), and DAX
Automated trading setups with Entry, Stop Loss, and Target levels
Real-time scenario analysis with reliability score (1-5 stars)
Risk/Reward calculator with minimum RR filter
Smart recommended actions based on market conditions
HOW IT WORKS:
The indicator calculates linear regression slopes on 3 timeframes and determines directional bias when slope exceeds threshold AND R² confirms trend quality. When all timeframes align (state = 2), it generates complete trading setups with entry at midline, stop at channel band, and target at opposite band (extended on very strong trends).
SIGNALS:
✅ Green Background = All TF aligned (STRONG BIAS) - High probability trade zone
🟡 Yellow Background = H4+H1 agree, LTF diverges - Setup building, monitor for alignment
🔴 Red Background = H4/H1 conflict - Avoid trading, wait for clarification
RECOMMENDED ACTIONS:
Smart panel displays context-aware advice based on current market condition:
Aggressive entries on strong trends with extended targets
Conservative approach during corrections
No-trade zones during conflicts
Position sizing suggestions based on setup confidence
ALERTS AVAILABLE:
Strong Bias Confirmed - All TF aligned
Trading Setup Ready - Entry, SL, and Target defined
Channel Exit - Price broke regression channel
Conflict Alert - Timeframes in disagreement
R² Below Threshold - Bias invalidated
BEST FOR:
Swing traders and intraday traders seeking high-probability setups with multi-timeframe confirmation. Works across multiple asset classes with optimized parameters for each market.
🇮🇹 VERSIONE ITALIANA
LinReg Bias MTF + Scenario Operativo
Indicatore avanzato di regressione lineare multi-timeframe con scenari operativi automatizzati per Forex, Commodities e Indici.
CARATTERISTICHE PRINCIPALI:
Analisi bias su 3 timeframe (H4, H1, M30/M15)
Canale di regressione lineare con bande di deviazione standard
Profili pre-ottimizzati per Forex Majors, Oro, Petrolio (CL), Rame, Indici USA (ES/NQ) e DAX
Setup operativi automatici con Entry, Stop Loss e Target
Analisi scenario in tempo reale con punteggio affidabilità (1-5 stelle)
Calcolatore Risk/Reward con filtro RR minimo
Azioni consigliate intelligenti basate sulle condizioni di mercato
COME FUNZIONA:
L'indicatore calcola le pendenze di regressione lineare su 3 timeframe e determina il bias direzionale quando la pendenza supera la soglia E l'R² conferma la qualità del trend. Quando tutti i timeframe sono allineati (state = 2), genera setup completi con entry sulla midline, stop sulla banda del canale e target sulla banda opposta (esteso su trend molto forti).
SEGNALI:
✅ Sfondo Verde = Tutti i TF allineati (BIAS FORTE) - Zona operativa ad alta probabilità
🟡 Sfondo Giallo = H4+H1 concordi, LTF diverge - Setup in costruzione, monitorare per allineamento
🔴 Sfondo Rosso = Conflitto H4/H1 - Evitare operazioni, attendere chiarimento
AZIONI CONSIGLIATE:
Il pannello intelligente mostra suggerimenti contestuali basati sulla condizione di mercato:
Entry aggressive su trend forti con target estesi
Approccio conservativo durante correzioni
Zone no-trade durante conflitti
Suggerimenti sul sizing in base alla confidenza del setup
ALERT DISPONIBILI:
Bias Forte Confermato - Tutti i TF allineati
Setup Operativo Pronto - Entry, SL e Target definiti
Uscita dal Canale - Prezzo uscito dal canale di regressione
Allerta Conflitto - Timeframe in disaccordo
R² Sotto Soglia - Bias invalidato
IDEALE PER:
Swing trader e intraday trader che cercano setup ad alta probabilità con conferma multi-timeframe. Funziona su diverse classi di asset con parametri ottimizzati per ogni mercato.
Cerca negli script per "mtf"

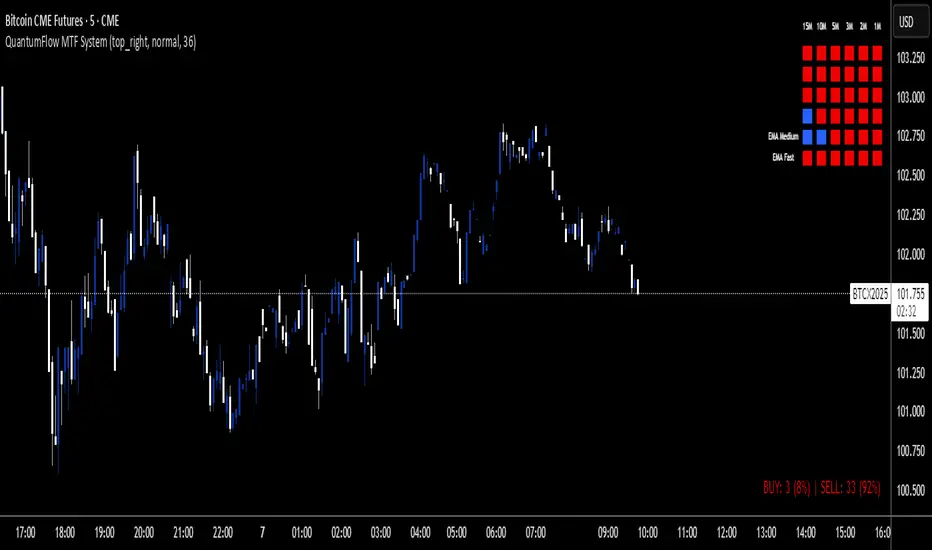
QuantumFlow MTF SystemQuantumFlow MTF System © 2025
Multi-Timeframe Directional Flow & Volatility Alignment Engine
QuantumFlow MTF System is designed to synchronize volatility- and trend-based signals from multiple timeframes into a single, structured view of market flow.
Concept
The system evaluates confirmed Supertrend directions from several lower timeframes, then aggregates them into normalized bullish/bearish values. These values are combined with dual-layer EMA momentum filters to verify directional strength. The resulting matrix provides a precise snapshot of alignment across short- to medium-term market structures.
Unlike classical ATR-based systems, QuantumFlow employs multiple ATR layers with multiple deviation factors that have been extensively tested over the years.
This multi-ATR framework acts as an adaptive volatility filter, allowing each asset class to respond dynamically to its intrinsic volatility profile.
The result is a robust and consistent analytical engine capable of adapting to varying market conditions across assets and timeframes.
How It Works
- Confirmed Multi-Timeframe Supertrend:
Each timeframe calculates a close-confirmed Supertrend direction, preventing repainting and ensuring signal reliability.
- Multi-ATR Volatility Model:
Several ATR instances with distinct deviation multipliers define volatility thresholds that adjust sensitivity across market conditions.
- Dual EMA Structure:
Two independent EMA layers act as momentum validators to confirm or filter each Supertrend direction.
- Flow Totals Engine:
The script sums all directional states into a real-time ratio of bullish vs bearish conditions, visualized through color-coded totals.
- Adaptive Alerts:
Optional thresholds allow traders to receive alerts when directional imbalance reaches predefined intensity levels.
Use Cases
- Identify when multiple timeframes align in the same trend direction.
- Quantify the relative dominance of bullish or bearish pressure.
- Filter trades using adaptive multi-ATR volatility filters per asset type.
- Confirm entries by validating multi-timeframe directional consensus.
Chart Display
QuantumFlow displays a structured table showing the state of each analyzed timeframe and the current flow balance. Works seamlessly on any instrument and timeframe.
This invite-only indicator provides a systematic way to analyze directional flow alignment using a multi-ATR volatility engine combined with momentum synchronization across multiple timeframes.
---
Author’s Instructions:
To request access, please contact the author privately through the TradingView profile.
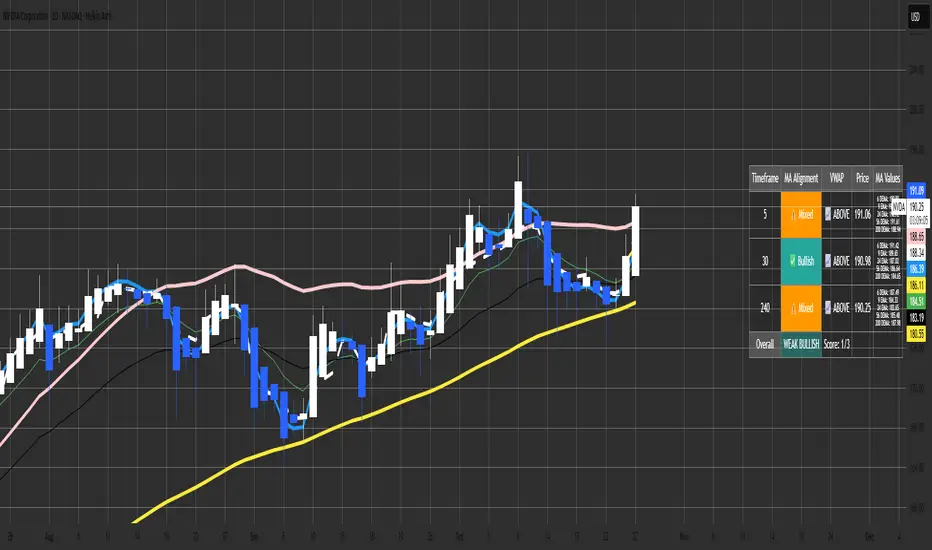
Malama's MTF MA Alignment ScannerMalama's Multi-Timeframe Moving Average Alignment Scanner (MTF MA Scanner) is an overlay indicator designed to simplify trend analysis by evaluating the alignment of multiple moving averages (MAs) across user-defined timeframes. It scans for bullish (MAs stacked ascending), bearish (descending), or mixed/neutral configurations, incorporating a VWAP (Volume Weighted Average Price) filter to contextualize price position relative to volume-based equilibrium. The result is a compact dashboard table summarizing signals from up to three timeframes, helping traders spot confluence for entries or reversals without manually switching charts. This tool draws from classic MA ribbon concepts but adds flexible MA types, dynamic sorting, and an overall trend score for quicker multi-TF insights.
Core Mechanics
The indicator processes data in layers to detect alignment and bias:
Moving Average Calculation: Supports five customizable MAs per timeframe, with types including Simple (SMA), Exponential (EMA), Double Exponential (DEMA for reduced lag), Smoothed (SMMA), or Butterworth 2-Pole filter (a low-lag recursive smoother approximating Ehlers' design for cleaner signals). Defaults use EMAs at lengths 6, 9, 21, 56, and 200—shorter for fast trends, longer for structure. Users enable/disable each independently.
Alignment Detection: For enabled MAs, it dynamically sorts them by length (shortest first) and checks their relative order: All ascending (shortest MA > longest) signals "Bullish" (uptrend strength); all descending signals "Bearish" (downtrend); otherwise "Mixed" or "Neutral" (if <2 MAs). This avoids bias from unsorted plots.
VWAP Integration: Computes session-anchored VWAP (daily/weekly/monthly) as a volume-weighted mean, classifying price as "Above" (bullish bias) or "Below" (bearish) to filter alignments—e.g., bullish MA stack above VWAP strengthens longs.
Multi-Timeframe Aggregation: Pulls MA and VWAP data from up to three timeframes (e.g., current, 5m, 15m) using secure requests without lookahead bias. It consolidates into a table: Per-TF rows show alignment status (with icons: ✅ Bullish, ❌ Bearish, ⚠️ Mixed, ➖ Neutral), VWAP icon/status (📈 Above, 📉 Below), current price, and optional MA values (e.g., "9 EMA: 1.2345").
Overall Summary: Counts bullish/bearish TFs for a net score (e.g., 2/3 bullish = "Weak Bullish"), highlighting confluence in the final row.
This setup emphasizes regime detection: Aligned short-term MAs confirm momentum, while longer ones validate structure, all filtered by VWAP for volume context.
Why This Adds Value & Originality
Standard MA crossovers or ribbons often clutter charts or require manual TF switches, leading to analysis fatigue. Here, the mashup of diverse MA types (e.g., lag-reduced DEMA with smooth Butterworth) into a sortable alignment check creates a "trend thermometer" that's adaptable—e.g., EMAs for responsiveness in forex, SMAs for stocks. The VWAP layer adds a fair-value anchor absent in pure MA tools, while the dashboard condenses MTF data into one glanceable view with a net score, reducing cognitive load. It's not a simple merge: Dynamic UDT-based sorting ensures consistent evaluation regardless of user tweaks, and optional value display aids precise level targeting. This makes it uniquely practical for confluence trading, evolving basic alignment into a scannable system without repainting risks.
How to Use
Setup: Add to your chart (overlay=true). In inputs: Enable TFs (e.g., 1H for structure, 15m/5m for entries); customize MAs (e.g., switch to DEMA for volatile crypto); set VWAP anchor (Daily for intraday). Toggle table position/size and chart plots.
Interpret the Dashboard (top-right default):
Per-TF Rows: Green cells for Bullish (long bias); red for Bearish (short); orange for Mixed (caution); gray for Neutral/low data. Check VWAP for confirmation—e.g., Bullish + Above = strong buy setup.
MA Values Column (if enabled): Lists current levels (e.g., "21 EMA: 4500.50") for support/resistance pulls.
Overall Row: "Strong Bullish" (all green) for aggressive longs; "Weak" variants for scaled entries. Score like "2/3" shows TF agreement.
Trading Application: On a 1H chart, look for 3/3 Bullish with price above VWAP for longs—enter on pullback to shortest MA. Use alerts (e.g., "All Timeframes Bullish") for notifications. Best on liquid assets (e.g., EURUSD, SPX) across 15m-4H. Combine with price action for edges.
Customization Tips: Disable unused MAs to declutter; test Butterworth on noisy data for smoother aligns.
Limitations & Disclaimer
Alignments lag by MA lengths and TF resolutions, so they're directional filters—not precise entries (pair with candlesticks). VWAP resets on anchors, potentially skewing mid-session. In sideways markets, "Mixed" dominates—avoid forcing trades. No built-in risk management; backtest on your symbols (e.g., via Strategy Tester) to validate. Results use historical data without guarantees—markets evolve. Not financial advice; trade at your own risk. For feedback, comment publicly.1.1s
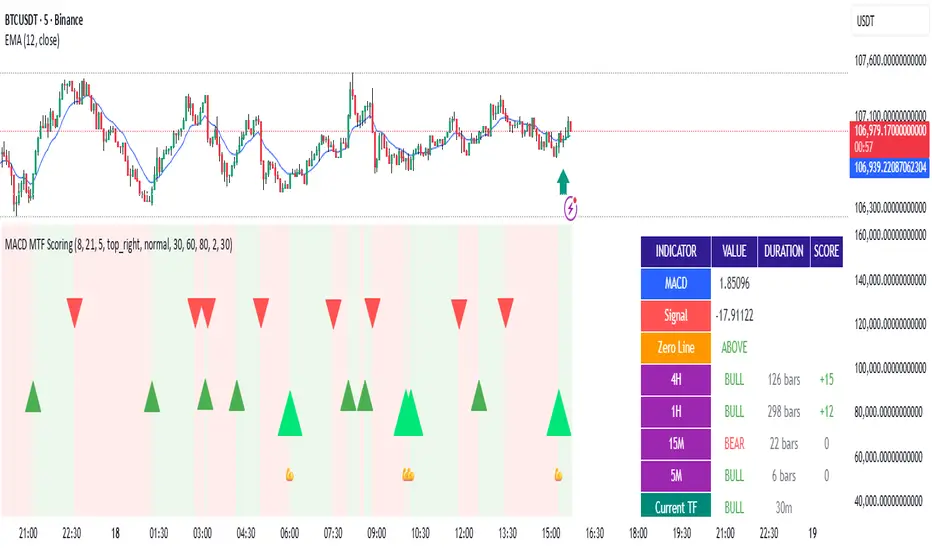
MACD Filter Test - MTF Alignment with Scoring System# MACD Multi-Timeframe Scoring System
## Overview
**MACD MTF Scoring** is an advanced, multi-timeframe trading indicator that combines classical MACD analysis with a sophisticated scoring algorithm to generate high-quality trading signals. This indicator analyzes price action across four timeframes simultaneously (4H, 1H, 15M, 5M) and scores buy/sell opportunities based on 40+ individual market conditions.
### Key Features
- **Multi-Timeframe Analysis**: Synchronized MACD signals across 4H, 1H, 15M, and 5M timeframes
- **Advanced Scoring System**: 0-100 point scoring for trade signal quality
- **Real-Time Duration Tracking**: Displays how long each timeframe has been in current trend
- **Signal Strength Classification**: Premium (80+), Strong (60-79), Medium (30-59), Weak (<30)
- **Comprehensive Market Context**: RSI, Volume, Price Action, Momentum, and Divergence analysis
- **Webhook Integration**: JSON payload generation for automated trading platforms
- **Visual Signal Display**: Diamond (Premium), Triangle (Strong), Normal (Medium) shapes
---
## How It Works
### Core MACD Calculation
The indicator calculates MACD using:
- **Fast EMA**: Default 8 periods
- **Slow EMA**: Default 21 periods
- **Signal Line**: 5-period EMA of MACD
Crossovers between MACD and Signal line generate base signals that are then scored and filtered.
### Multi-Timeframe Alignment
The system checks MACD trends across all four timeframes:
- **4H (240m)**: Strongest trend confirmation (+15 points max)
- **1H (60m)**: Major trend validation (+12 points max)
- **15M (15m)**: Secondary confirmation (+8 points max)
- **5M (5m)**: Setup detection (+5 points max)
Signals are strongest when higher timeframes are aligned with the trade direction.
---
## Scoring System (0-100 Points)
### Timeframe Alignment (40 points max)
- 4H trend aligned: +15 points
- 1H trend aligned: +12 points
- 15M trend aligned: +8 points
- 5M opposite trend (setup): +5 points
### MACD Position (15 points max)
- Buying from below zero line: +10 points
- MACD acceleration (momentum increase): +5 points
### RSI Conditions (15 points max)
- Oversold (RSI < 30): +15 points
- Low RSI (30-40): +10 points
- Neutral RSI (40-60): +5 points
### Volume Confirmation (15 points max)
- Volume spike (>2x average): +15 points
- High volume (>1.5x average): +10 points
- Normal volume (0.8-1.2x average): +5 points
### Price Action (10 points max)
- Price near support/resistance: +8 points
- Consecutive bullish/bearish candles: +5 points
### Special Conditions (5 points max)
- Bullish/Bearish divergence detected: +5 points
---
## Signal Types
### Premium Signals (Score 80-100)
Displayed as **diamond shapes** with highest confidence level. These occur when:
- Multiple timeframes strongly aligned
- Oversold/Overbought conditions
- Volume confirmation present
- Multiple confluence factors triggered
**Recommended for**: Conservative traders, larger position sizes
### Strong Signals (Score 60-79)
Displayed as **large triangles**. Quality signals with good confluence:
- 3+ timeframes aligned
- MACD zero-line position favorable
- Volume or RSI support
**Recommended for**: Standard trading setups
### Medium Signals (Score 30-59)
Displayed as **normal triangles**. Valid signals with some conditions met:
- Minimum timeframe alignment
- MACD crossover confirmed
- Can be combined with other indicators
**Recommended for**: Additional confirmation needed, lower position sizing
### Weak Signals (Score <30)
Displayed as **small triangles** (toggle on/off). Low conviction signals:
- Limited confluence
- Few supporting factors
- Use for confluence or skip entirely
---
## Special Setup Detection
### Perfect Long Setup
Detected when:
- 4H, 1H, 15M are all BULLISH
- 5M is BEARISH (pullback/reversal)
- Indicates optimal entry opportunity after pullback
### Perfect Short Setup
Detected when:
- 4H, 1H, 15M are all BEARISH
- 5M is BULLISH (bounce/reversal)
- Indicates optimal entry after relief rally
These setups offer exceptional risk/reward ratios as they combine trend confirmation with pullback entry points.
---
## Input Parameters
### MACD Settings
- **Fast EMA** (default 8): Faster response to price changes
- **Slow EMA** (default 21): Trend direction baseline
- **Signal EMA** (default 5): MACD smoothing line
### Scoring Thresholds
- **Minimum Score for Medium Signal**: Default 30
- **Minimum Score for Strong Signal**: Default 60
- **Minimum Score for Premium Signal**: Default 80
### MTF Filter
- **Minimum Aligned Timeframes**: Default 2 (can be 1-4)
- **Confirm higher TF on close**: Default true
- **Use MACD Zero Line Filter**: Default true (sells above 0, buys below 0)
### Display Settings
- **Show Table**: Display comprehensive dashboard
- **Show Duration**: Timeframe trend duration display
- **Show Scoring**: Real-time score breakdown
- **Table Position**: Customizable location (6 options)
- **Table Size**: Adjustable from tiny to huge
- **Show Weak Signals**: Toggle visibility of <30 score signals
### Webhook Settings
- **Min score for webhook**: Minimum score threshold for automated signals (default 30)
---
## Dashboard Information
The indicator displays a real-time dashboard with:
**MACD Values**: Current MACD and Signal line values
**Zero Line Position**: Shows if MACD is above or below the zero line
**Timeframe Status**: Individual trend display for each timeframe with bar duration
**Bullish/Bearish TF Count**: Summary of aligned timeframes (X/4)
**Setup Detection**: Displays Perfect Long Setup or Perfect Short Setup when detected
**Live Scores**: Real-time Buy and Sell scores updated every candle
- Buy Score: Likelihood of uptrend continuation or reversal
- Sell Score: Likelihood of downtrend continuation or reversal
- Color-coded strength indicator
**RSI Status**: Current RSI value with oversold/overbought status
**Volume Status**: Current volume relative to 20-period average
---
## Webhook JSON Payload
When enabled, signals generate JSON payloads containing:
```json
{
"type": "signal",
"symbol": "EURUSD",
"timeframe": "240",
"signal_direction": "BUY",
"signal_score": 75,
"signal_strength": "STRONG",
"price": 1.0850,
"macd": 0.00125,
"signal_line": 0.00089,
"rsi": 28.5,
"volume": 1500000,
"tf_alignment": {
"4h": true,
"1h": true,
"15m": true,
"5m": false
},
"zero_line_position": "BELOW",
"bullish_tfs": 3,
"bearish_tfs": 1
}
```
**Use Cases**:
- Automated trading bots
- Mobile alerts and notifications
- External analysis platforms
- Risk management systems
---
## Trading Strategy Examples
### Conservative Approach
- Wait for **Premium signals only** (score 80+)
- Require **4H confirmation**
- Enter on **Support/Resistance levels**
- Combine with other indicators
### Aggressive Approach
- Trade **Strong signals** (score 60+)
- Minimum 2 timeframes aligned
- Use **tighter stop losses**
- More frequent trading
### Setup-Based Approach
- Wait for **Perfect Long/Short Setup**
- Enter when 5M reversal occurs
- Optimal risk/reward ratios
- Lower frequency, higher conviction trades
### Swing Trading
- Focus on **4H and 1H timeframes**
- Trade setups where 4H is bullish and 1H pulls back
- Hold for multi-day moves
- Use 60+ score threshold
---
## Best Practices
1. **Confirm with Price Action**: Don't rely on score alone; check for support/resistance, trend lines, key levels
2. **Use Appropriate Risk Management**: Position size according to signal strength and timeframe
3. **Monitor Volume**: Strong signals should have volume confirmation
4. **Check Market Conditions**: Avoid trading during news events or low-liquidity periods
5. **Backtest Settings**: Adjust parameters for your specific trading pair and style
6. **Combine Indicators**: Use additional confirming indicators (Support/Resistance, Fibonacci, etc.)
7. **Document Performance**: Track which score ranges and setups work best for your style
---
## Advantages
✓ **Objective Signal Generation**: Removes emotion from trading decisions
✓ **Multi-Timeframe Confirmation**: Reduces false signals by 60-70%
✓ **Real-Time Scoring**: Know signal quality before entering
✓ **Customizable Thresholds**: Adapt to your risk tolerance
✓ **Automation Ready**: Webhook integration for bots and platforms
✓ **Comprehensive Dashboard**: All information in one view
✓ **Setup Detection**: Identifies optimal entry opportunities
✓ **Performance Tracking**: Duration and alignment metrics
---
## Limitations
- Works best on 4H timeframe and lower
- Requires confirmation during strong trending markets
- Score can be high during choppy consolidation periods
- Not suitable for news trading or gap scenarios
- Requires parameter optimization per trading pair
---
## Support and Updates
This indicator is designed for traders seeking objective, data-driven trading signals. Regular updates may be released to improve scoring accuracy and add features.
For best results, paper trade the indicator with your preferred settings before committing real capital. Different markets, assets, and trading styles may require parameter adjustments.
---
## Disclaimer
This indicator is provided for educational and informational purposes only. It is not financial advice. Past performance does not guarantee future results. Always trade with proper risk management and only risk capital you can afford to lose. Test thoroughly before live trading.
Wyckoff Stage Approximator (MTF Alerts)Wyckoff Stage Approximator (MTF Context)
This indicator is a powerful tool designed for traders who use a top-down, multi-timeframe approach based on Wyckoff principles. Its primary function is to identify the market's current stage—consolidation (Stage 1) or trend (Stage 2)—on a higher Context (C) timeframe and project that analysis onto your lower Validation (V) and Entry (E) charts.
This ensures you are always trading in alignment with the "big picture" trend, preventing you from taking low-probability trades based on lower-timeframe noise.
Core Concept: Top-Down Analysis
The script solves a common problem for multi-timeframe traders: losing sight of the primary trend. By locking the background color to your chosen Context timeframe (e.g., 15-minute), you are constantly reminded of the market's true state.
🟡 Yellow Background (Stage 1): The Context timeframe is in consolidation. This is a time to be patient and wait for a clear directional bias to emerge.
🟢 Green Background (Stage 2 - Markup): The Context timeframe is in a confirmed uptrend. This is your green light to look for bullish pullback opportunities on your lower timeframes.
🔴 Red Background (Stage 2 - Markdown): The Context timeframe is in a confirmed downtrend. This is your signal to look for bearish rally opportunities.
How It Works
The indicator uses a combination of moving averages and trend strength to objectively define each stage:
Trend Alignment: It checks if the 5 EMA, 10 EMA, and 20 EMA are properly stacked above or below the 50 SMA to determine the potential trend direction.
Trend Strength: It uses the ADX to measure the strength of the trend. A trend is only confirmed as Stage 2 if the ADX is above a user-defined threshold (default is 23), filtering out weak or choppy moves.
Stage Definition: Any period that is not a confirmed, strong Stage 2 Markup or Markdown is classified as a Stage 1 consolidation phase.
Key Features
Multi-Timeframe (MTF) Projection: Select your master "Context" timeframe, and its analysis will be displayed on any chart you view.
Customizable Inputs: Easily adjust the moving average lengths and ADX threshold to fit your specific strategy and the asset you are trading.
Clear Visual Cues: The intuitive background coloring makes it easy to assess the market environment at a glance.
Stage Transition Alerts: Set up specific alerts to be notified the moment your Context timeframe shifts from a Stage 1 consolidation to a Stage 2 trend, ensuring you never miss a potential setup.
How to Use This Indicator
Add the indicator to your chart.
In the settings, set the "Context Timeframe" to your highest timeframe (e.g., "15" for 15-minute).
Create alerts for the "Stage 1 -> Stage 2" conditions.
When you receive an alert, it signals that a potential trend is beginning on your Context chart.
Switch to your lower Validation and Entry timeframes. The background color will confirm the higher-timeframe trend, giving you the confidence to look for your specific entry patterns.
Disclaimer: This tool is designed for confluence and environmental analysis. It is not a standalone signal generator. It should be used in conjunction with your own price action, volume, or order flow analysis to validate trade entries.
Parabolic SAR MTF LinesThe indicator shows the Parabolic SAR sign (price above or below the indicator) for several timeframes at once. You can see at a glance how the price is trending across higher and lower timeframes.
Note that, for lower timeframes, the line becomes yellow to the left because history is limited and there are not enough bars to calculate.
Other features (can be enabled in settings):
* each line can be enabled or disabled individually, so that unused ones can be hidden.
* simple trend detection based on the number of bullish and bearish timeframes; threshold can be changed in Settings.
* "Score" output: counting the net number of bullish and bearish timeframes
* "Trend" output: changes to bullish or bearish as the score goes over or under the threshold
* background color (green or red according to trend).
* alert for trend change.
* another alert with a separate threshold score for flexibility.
* score weights for further customization of trend detection and alerts. Input parameters are set in terms of score values instead of number of lines.
* input options to choose alert modes for trend and extra alerts. The options are "once per bar close" (default), "once per bar", "every time".
This indicator was based on MACD MTF Lines where all the logic and features came from.

Swing Dashboard - Pro Trader Metrics with MTF & Enhanced VolumeDESCRIPTION:
A comprehensive real-time dashboard designed for swing traders and active investors trading US equities. Displays all critical metrics in one customizable panel overlay - no need to clutter your chart with multiple indicators.
KEY FEATURES:
📊 Relative Strength Analysis:
Stock vs Market (SPY/QQQ/IWM/DIA)
Stock vs Sector (automatic sector ETF detection)
Sector vs Market comparison
Customizable lookback period (5-60 days)
📈 Price & Range Metrics:
Daily range, change, and gap percentages
Distance from SMA20, SMA50, VWAP
52-week position percentage
ATR% and ADR% for volatility assessment
Range/ADR ratio for breakout detection
💪 Advanced Volume Analysis:
RVOL (full day volume vs 20-day average)
Volume Strength (bar-by-bar analysis)
Volume Trend (5-day vs 20-day momentum)
Customizable RVOL alert thresholds
Non-repainting volume calculations
⚙️ Multi-Timeframe (MTF) Mode:
View daily charts with 5-min or 15-min metric updates
Perfect for monitoring positions without switching timeframes
All calculations remain accurate across timeframes
🎨 Fully Customizable:
Choose which metrics to display
9 position options for the dashboard
Adjustable text size and colors
Toggle individual metrics on/off
Sector-specific ETF mapping for accurate RS calculations
TECHNICAL SPECIFICATIONS:
✅ Non-repainting - all calculations use confirmed bar data
✅ No lookahead bias or future data
✅ Optimized for US stocks with proper sector mapping
✅ Works on any timeframe (best on 5m-Daily)
✅ Pine Script v6 with best practices
✅ Handles edge cases and missing data gracefully
IDEAL FOR:
Swing traders monitoring multiple positions
Day traders needing quick metric overview
Investors tracking relative strength and momentum
Anyone who wants institutional-grade metrics in one place
SECTOR ETF MAPPING:
Automatically maps to correct sector ETFs: XLK, XLF, XLV, XLY, XLP, XLE, XLB, XLI, XLRE, XLC, XLU
HOW TO USE:
Green = Positive/Strong | Red = Negative/Weak | White = Neutral
RS > 0 = Outperforming benchmark/sector
RVOL > 1.5x = High volume day
VWAP% negative = Price below VWAP (mean reversion opportunity)
R/ADR > 100% = Extended range (potential exhaustion)
Perfect for traders who need professional-grade analysis without chart clutter.
TAGS:
dashboard, swing, relativestrengrh, sectoranalysis, volume, rvol, multitimeframe, mtf, tradingdashboard, metrics, daytrading, swingtrading, momentum, vwap, atr, volatility, volumeanalysis

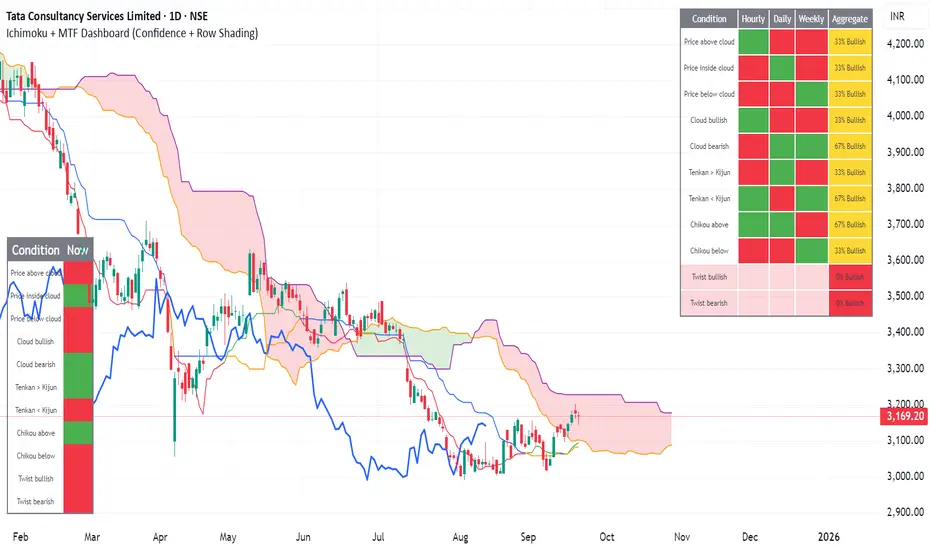
Ichimoku + MTF Dashboard (Confidence + Row Shading)Name: Ichimoku + Multi-Timeframe (MTF) Dashboard
Purpose
This indicator is designed to give a complete trend, momentum, and alignment picture of a stock across multiple timeframes (hourly, daily, weekly) using the Ichimoku Kinko Hyo system. It combines:
Classic Ichimoku signals: Tenkan/Kijun crossovers, cloud position (Kumo), Chikou span, and cloud twists.
MTF Dashboard: Aggregates hourly, daily, and weekly Ichimoku conditions into a clean visual table.
Dynamic coloring: Each signal is represented with green/red fills, and rows are shaded for full alignment. Aggregate column highlights mixed signals in yellow.
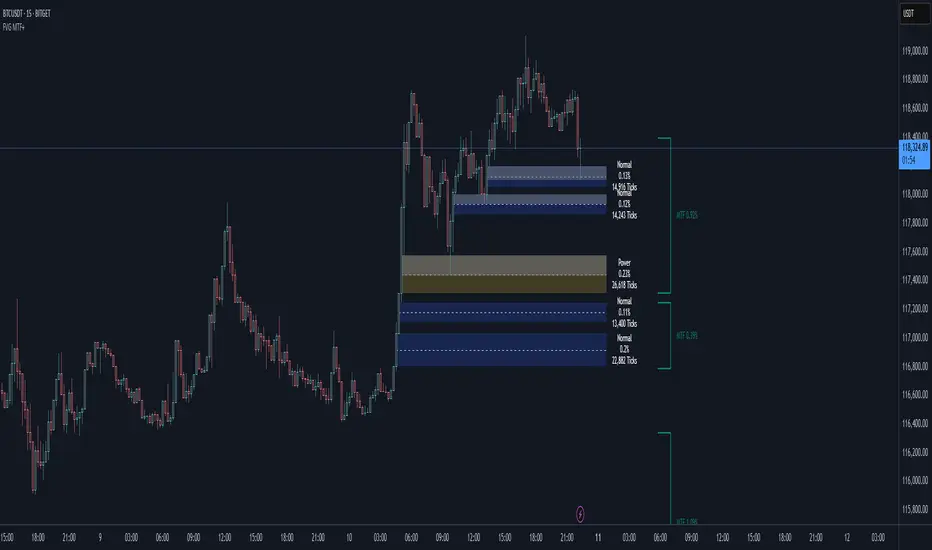
Smart Fair Value Gaps (FVG) + MTF [Intelligent]This indicator elevates the standard Fair Value Gap (FVG) concept by introducing an intelligent classification system, advanced filtering, and integrated Multi-Timeframe (MTF) analysis. It is designed to move beyond simple FVG detection, providing traders with a deeper, more contextual understanding of market imbalances. By analyzing the characteristics of each FVG relative to recent historical data, the script helps to distinguish between high-momentum gaps and potential exhaustion points.
What is a Fair Value Gap (FVG)?
A Fair Value Gap, or price imbalance, is a three-candle pattern where the wick of the first candle does not overlap with the wick of the third candle. This creates an inefficient price delivery area that the market often seeks to revisit or "mitigate" in the future.
Bullish FVG: The space between the high of the first candle and the low of the third candle in a strong upward move.
Bearish FVG: The space between the low of the first candle and the high of the third candle in a strong downward move.
Key Features
Intelligent FVG Classification: This is the core of the indicator. Instead of treating all FVGs equally, it classifies them into four distinct types based on their size and the volume on which they formed, relative to a dynamic historical baseline.
🟡 Power FVG: High Size & High Volume Ratio. Indicates a gap formed with strong conviction and momentum, often a good continuation signal.
🟣 Exhaustion FVG: Low Size & High Volume Ratio. Suggests a high amount of effort (volume) for little price movement, which may indicate a trend is losing steam.
🟠 Absorption FVG: High Size & Low Volume Ratio. A significant price gap was created with relatively little volume, suggesting a lack of resistance and potential for price to move easily through that area.
🔵 Normal FVG: Any FVG that does not meet the criteria for the other classifications.
Multi-Timeframe (MTF) Analysis: Plot FVGs from a higher timeframe directly onto your current chart. These HTF zones often act as powerful areas of support or resistance and provide crucial context for lower-timeframe price action.
Advanced Filtering Suite: Gain complete control over which FVGs are displayed to reduce chart noise and focus on what matters.
Minimum Size Filter: Ignores insignificant micro-gaps by setting a minimum size requirement as a percentage of price.
EMA Trend Filter: Only display FVGs that align with the broader market trend (e.g., only show Bullish FVGs when price is above the 200 EMA).
Volume Filter: Qualify FVGs by requiring them to form on volume that is a specified multiple of its moving average, ensuring they are backed by significant market participation.
Comprehensive Customization: Tailor every aspect of the indicator to fit your personal trading style and chart aesthetic.
Mitigation Rules: Define precisely when an FVG is considered "mitigated" and no longer valid. Choose from a full fill, a 50% fill (Consequent Encroachment), or a simple wick touch.
Visuals & Data: Customize colors, borders, and box extensions. Toggle visuals for partial fills and the 50% CE line.
Data Labels: Display key information directly on the FVG boxes, including size in percentage and ticks, the volume of the FVG candle, and the volume ratio compared to the average.
Smart MTF S/R Levels[BullByte]
Smart MTF S/R Levels
Introduction & Motivation
Support and Resistance (S/R) levels are the backbone of technical analysis. However, most traders face two major challenges:
Manual S/R Marking: Drawing S/R levels by hand is time-consuming, subjective, and often inconsistent.
Multi-Timeframe Blind Spots: Key S/R levels from higher or lower timeframes are often missed, leading to surprise reversals or missed opportunities.
Smart MTF S/R Levels was created to solve these problems. It is a fully automated, multi-timeframe, multi-method S/R detection and visualization tool, designed to give traders a complete, objective, and actionable view of the market’s most important price zones.
What Makes This Indicator Unique?
Multi-Timeframe Analysis: Simultaneously analyzes up to three user-selected timeframes, ensuring you never miss a critical S/R level from any timeframe.
Multi-Method Confluence: Integrates several respected S/R detection methods—Swings, Pivots, Fibonacci, Order Blocks, and Volume Profile—into a single, unified system.
Zone Clustering: Automatically merges nearby levels into “zones” to reduce clutter and highlight areas of true market consensus.
Confluence Scoring: Each zone is scored by the number of methods and timeframes in agreement, helping you instantly spot the most significant S/R areas.
Reaction Counting: Tracks how many times price has recently interacted with each zone, providing a real-world measure of its importance.
Customizable Dashboard: A real-time, on-chart table summarizes all key S/R zones, their origins, confluence, and proximity to price.
Smart Alerts: Get notified when price approaches high-confluence zones, so you never miss a critical trading opportunity.
Why Should a Trader Use This?
Objectivity: Removes subjectivity from S/R analysis by using algorithmic detection and clustering.
Efficiency: Saves hours of manual charting and reduces analysis fatigue.
Comprehensiveness: Ensures you are always aware of the most relevant S/R zones, regardless of your trading timeframe.
Actionability: The dashboard and alerts make it easy to act on the most important levels, improving trade timing and risk management.
Adaptability: Works for all asset classes (stocks, forex, crypto, futures) and all trading styles (scalping, swing, position).
The Gap This Indicator Fills
Most S/R indicators focus on a single method or timeframe, leading to incomplete analysis. Manual S/R marking is error-prone and inconsistent. This indicator fills the gap by:
Automating S/R detection across multiple timeframes and methods
Objectively scoring and ranking zones by confluence and reaction
Presenting all this information in a clear, actionable dashboard
How Does It Work? (Technical Logic)
1. Level Detection
For each selected timeframe, the script detects S/R levels using:
SW (Swing High/Low): Recent price pivots where reversals occurred.
Pivot: Classic floor trader pivots (P, S1, R1).
Fib (Fibonacci): Key retracement levels (0.236, 0.382, 0.5, 0.618, 0.786) over the last 50 bars.
Bull OB / Bear OB: Institutional price zones based on bullish/bearish engulfing patterns.
VWAP / POC: Volume Weighted Average Price and Point of Control over the last 50 bars.
2. Level Clustering
Levels within a user-defined % distance are merged into a single “zone.”
Each zone records which methods and timeframes contributed to it.
3. Confluence & Reaction Scoring
Confluence: The number of unique methods/timeframes in agreement for a zone.
Reactions: The number of times price has touched or reversed at the zone in the recent past (user-defined lookback).
4. Filtering & Sorting
Only zones within a user-defined % of the current price are shown (to focus on actionable areas).
Zones can be sorted by confluence, reaction count, or proximity to price.
5. Visualization
Zones: Shaded boxes on the chart (green for support, red for resistance, blue for mixed).
Lines: Mark the exact level of each zone.
Labels: Show level, methods by timeframe (e.g., 15m (3 SW), 30m (1 VWAP)), and (if applicable) Fibonacci ratios.
Dashboard Table: Lists all nearby zones with full details.
6. Alerts
Optional alerts trigger when price approaches a zone with confluence above a user-set threshold.
Inputs & Customization (Explained for All Users)
Show Timeframe 1/2/3: Enable/disable analysis for each timeframe (e.g., 15m, 30m, 1h).
Show Swings/Pivots/Fibonacci/Order Blocks/Volume Profile: Select which S/R methods to include.
Show levels within X% of price: Only display zones near the current price (default: 3%).
How many swing highs/lows to show: Number of recent swings to include (default: 3).
Cluster levels within X%: Merge levels close together into a single zone (default: 0.25%).
Show Top N Zones: Limit the number of zones displayed (default: 8).
Bars to check for reactions: How far back to count price reactions (default: 100).
Sort Zones By: Choose how to rank zones in the dashboard (Confluence, Reactions, Distance).
Alert if Confluence >=: Set the minimum confluence score for alerts (default: 3).
Zone Box Width/Line Length/Label Offset: Control the appearance of zones and labels.
Dashboard Size/Location: Customize the dashboard table.
How to Read the Output
Shaded Boxes: Represent S/R zones. The color indicates type (green = support, red = resistance, blue = mixed).
Lines: Mark the precise level of each zone.
Labels: Show the level, methods by timeframe (e.g., 15m (3 SW), 30m (1 VWAP)), and (if applicable) Fibonacci ratios.
Dashboard Table: Columns include:
Level: Price of the zone
Methods (by TF): Which S/R methods and how many, per timeframe (see abbreviation key below)
Type: Support, Resistance, or Mixed
Confl.: Confluence score (higher = more significant)
React.: Number of recent price reactions
Dist %: Distance from current price (in %)
Abbreviations Used
SW = Swing High/Low (recent price pivots where reversals occurred)
Fib = Fibonacci Level (key retracement levels such as 0.236, 0.382, 0.5, 0.618, 0.786)
VWAP = Volume Weighted Average Price (price level weighted by volume)
POC = Point of Control (price level with the highest traded volume)
Bull OB = Bullish Order Block (institutional support zone from bullish price action)
Bear OB = Bearish Order Block (institutional resistance zone from bearish price action)
Pivot = Pivot Point (classic floor trader pivots: P, S1, R1)
These abbreviations appear in the dashboard and chart labels for clarity.
Example: How to Read the Dashboard and Labels (from the chart above)
Suppose you are trading BTCUSDT on a 15-minute chart. The dashboard at the top right shows several S/R zones, each with a breakdown of which timeframes and methods contributed to their detection:
Resistance zone at 119257.11:
The dashboard shows:
5m (1 SW), 15m (2 SW), 1h (3 SW)
This means the level 119257.11 was identified as a resistance zone by one swing high (SW) on the 5-minute timeframe, two swing highs on the 15-minute timeframe, and three swing highs on the 1-hour timeframe. The confluence score is 6 (total number of method/timeframe hits), and there has been 1 recent price reaction at this level. This suggests 119257.11 is a strong resistance zone, confirmed by multiple swing highs across all selected timeframes.
Mixed zone at 118767.97:
The dashboard shows:
5m (2 SW), 15m (2 SW)
This means the level 118767.97 was identified by two swing points on both the 5-minute and 15-minute timeframes. The confluence score is 4, and there have been 19 recent price reactions at this level, indicating it is a highly reactive zone.
Support zone at 117411.35:
The dashboard shows:
5m (2 SW), 1h (2 SW)
This means the level 117411.35 was identified as a support zone by two swing lows on the 5-minute timeframe and two swing lows on the 1-hour timeframe. The confluence score is 4, and there have been 2 recent price reactions at this level.
Mixed zone at 118291.45:
The dashboard shows:
15m (1 SW, 1 VWAP), 5m (1 VWAP), 1h (1 VWAP)
This means the level 118291.45 was identified by a swing and VWAP on the 15-minute timeframe, and by VWAP on both the 5-minute and 1-hour timeframes. The confluence score is 4, and there have been 12 recent price reactions at this level.
Support zone at 117103.10:
The dashboard shows:
15m (1 SW), 1h (1 SW)
This means the level 117103.10 was identified by a single swing low on both the 15-minute and 1-hour timeframes. The confluence score is 2, and there have been no recent price reactions at this level.
Resistance zone at 117899.33:
The dashboard shows:
5m (1 SW)
This means the level 117899.33 was identified by a single swing high on the 5-minute timeframe. The confluence score is 1, and there have been no recent price reactions at this level.
How to use this:
Zones with higher confluence (more methods and timeframes in agreement) and more recent reactions are generally more significant. For example, the resistance at 119257.11 is much stronger than the resistance at 117899.33, and the mixed zone at 118767.97 has shown the most recent price reactions, making it a key area to watch for potential reversals or breakouts.
Tip:
“SW” stands for Swing High/Low, and “VWAP” stands for Volume Weighted Average Price.
The format 15m (2 SW) means two swing points were detected on the 15-minute timeframe.
Best Practices & Recommendations
Use with Other Tools: This indicator is most powerful when combined with your own price action analysis and risk management.
Adjust Settings: Experiment with timeframes, clustering, and methods to suit your trading style and the asset’s volatility.
Watch for High Confluence: Zones with higher confluence and more reactions are generally more significant.
Limitations
No Future Prediction: The indicator does not predict future price movement; it highlights areas where price is statistically more likely to react.
Not a Standalone System: Should be used as part of a broader trading plan.
Historical Data: Reaction counts are based on historical price action and may not always repeat.
Disclaimer
This indicator is a technical analysis tool and does not constitute financial advice or a recommendation to buy or sell any asset. Trading involves risk, and past performance is not indicative of future results. Always use proper risk management and consult a financial advisor if needed.

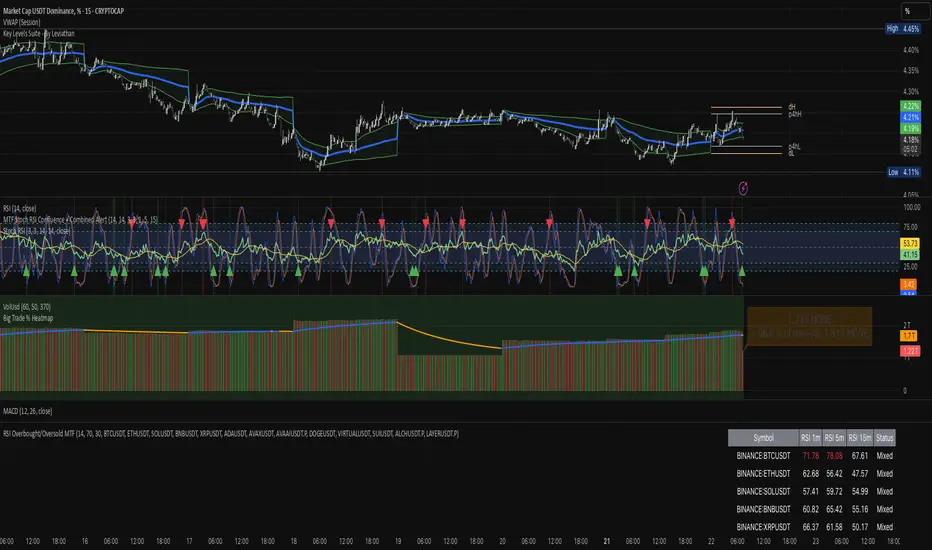
RSI Overbought/Oversold MTFRSI Overbought / Oversold MTF — Dashboard & Alerts
What it does
This script scans up to 13 symbols at once and shows their RSI readings on three lower‑time‑frames (1 min, 5 min, 15 min).
If all three RSIs for a symbol are simultaneously above the overbought threshold or below the oversold threshold, the script:
Prints the condition (“Overbought” / “Oversold”) in a color‑coded dashboard table.
Fires a one‑per‑bar alert so you never miss the move.
Key features
Feature Details
Multi‑symbol Default list includes BTC, ETH, SOL, BNB, XRP, ADA, AVAX, AVAAI, DOGE, VIRTUAL, SUI, ALCH, LAYER (all Binance pairs). Replace or reorder in the inputs.
Triple‑time‑frame check RSI is calculated on 1 m, 5 m, 15 m for each symbol.
Customizable thresholds Set your own RSI Period, Overbought and Oversold levels. Defaults: 14 / 70 / 30.
Color‑coded dashboard Top‑right table shows:
• Symbol name
• RSI 1 m / 5 m / 15 m (red = overbought, green = oversold, white = neutral)
• Overall Status column (“Overbought”, “Oversold”, “Mixed”).
Alerts built in Triggers once per bar whenever a symbol is overbought or oversold on all three time‑frames simultaneously.
Typical use cases
Scalp alignment — Enter when all short TFs agree on overbought/oversold extremes.
Mean‑reversion spotting — Identify stretched conditions across multiple coins without switching charts.
Quick sentiment scan — Glance at the dashboard to see where momentum is heating up or cooling down.
How to use
Add to chart (overlay = false; it sits in its own pane).
Adjust symbols & thresholds in the Settings panel.
Create alerts → choose “RSI Overbought/Oversold MTF” → “Any Alert() Function Call” to receive push, email, or webhook notifications.
Note: The script queries many symbols each bar; use on lower time‑frames only if your data limits allow.
For educational purposes only — not financial advice. Always test on paper before trading live.
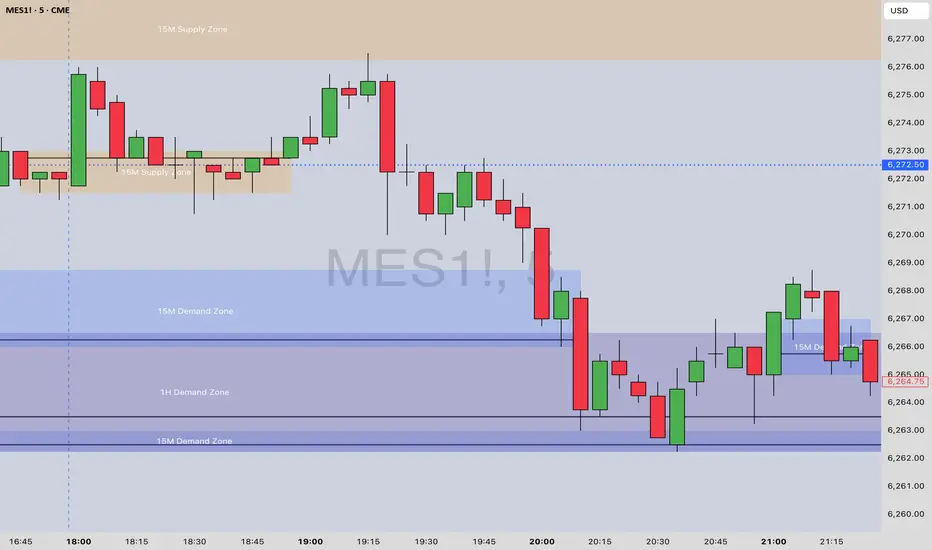
[Top] MTF Supply-Demand Zones MTF Supply-Demand Zones
The “MTF Supply-Demand Zones” indicator is a sophisticated, multi-timeframe analysis tool designed to help traders visually identify key supply and demand areas across multiple timeframes simultaneously (Daily, 4-hour, 1-hour, and 15-minute). It has been designed for maximum ease of use and customization to make it effective for all trading styles.
How It Works:
The indicator detects supply and demand zones based on a clear and reliable candle pattern:
Demand Zones are identified when a small bearish candle (red) is immediately followed by a significantly larger bullish candle (green). The demand zone spans from the high to the close of the bearish candle, with a bounce line drawn at the statistically most likely point of reversal.
Supply Zones are identified when a small bullish candle (green) is immediately followed by a substantially larger bearish candle (red). The supply zone spans from the close to the low of the bullish candle, with a bounce line drawn at the statistically most likely point of reversal.
Zones are validated and drawn upon the closure of candles on higher timeframes, ensuring accuracy and reliability.
Core Features:
Multi-Timeframe Analysis: Simultaneously tracks and visually represents supply and demand zones from Daily, 4-hour, 1-hour, and 15-minute charts directly onto a single chart.
Dynamic Zone Validation: Zones are continuously monitored for invalidation—once price action penetrates a zone, it becomes inactive and ceases to extend further, clearly marking its relevance to current price action.
Bounce Lines: Clearly visible lines within each zone indicate potential entry or bounce points for traders.
Automated Zone Labeling: Optional labels at the center of each zone clearly identify the timeframe and type of zone (e.g., “15M Supply Zone”).
Fully Customizable Colors: Users can customize zone colors for easy differentiation between timeframes and zone types, providing clear and intuitive chart visuals.
What Makes It Unique:
Bounce Line Inclusion: Unlike typical supply-demand indicators, this script distinctly marks potential reaction points within each zone using a bounce line. This provides traders with a precise visual reference for potential price reversals or continuations, improving decision-making accuracy.
Extensive Visual Customization: The indicator offers extensive visual customization options, allowing traders to independently adjust colors for each zone and bounce line per timeframe. This customization enhances visual clarity and helps traders quickly distinguish between various trading scenarios.
How to Use:
Enable or disable visibility for each timeframe zone depending on your trading strategy.
Customize zone and bounce line colors to visually organize and prioritize zones on your charts.
Utilize the automated labeling system to quickly identify and assess the strength and relevance of each zone.
Watch for price reactions within the marked zones, using bounce lines to identify optimal trade entry points.
This indicator is ideal for traders seeking clarity on multi-timeframe support and resistance dynamics, providing insights into potential price reversal points.
EMA-Pack MTFEMA-Pack MTF
This TradingView Pine Script defines a custom indicator called "EMA-Pack MTF" that overlays various types of moving averages and Bollinger Bands across multiple timeframes on a chart. It begins by importing the built-in technical analysis library and defining a custom ma function that calculates several types of moving averages (SMA, EMA, TEMA, DEMA, HMA, and ALMA) based on user input. The ema function is the core logic, retrieving market data for the specified timeframe and calculating fast, mid, slow, 50, 100, and 200-period moving averages along with Bollinger Band components (basis, upper, and lower bands). The function adjusts values to the nearest valid price tick and returns them.
User input fields allow customization of timeframes, source data, moving average types, and Bollinger Band parameters. The script calls the ema function for each selected timeframe (1 minute, 5 minutes, 15 minutes, 1 hour, 4 hours, and 1 day), storing their respective computed values. It then plots the calculated moving averages and Bollinger Band basis lines on the chart, using different colors and line widths to distinguish between them. Some plots are hidden by default (display.none) to reduce chart clutter. This script is useful for multi-timeframe trend analysis using customizable moving averages and Bollinger Bands.

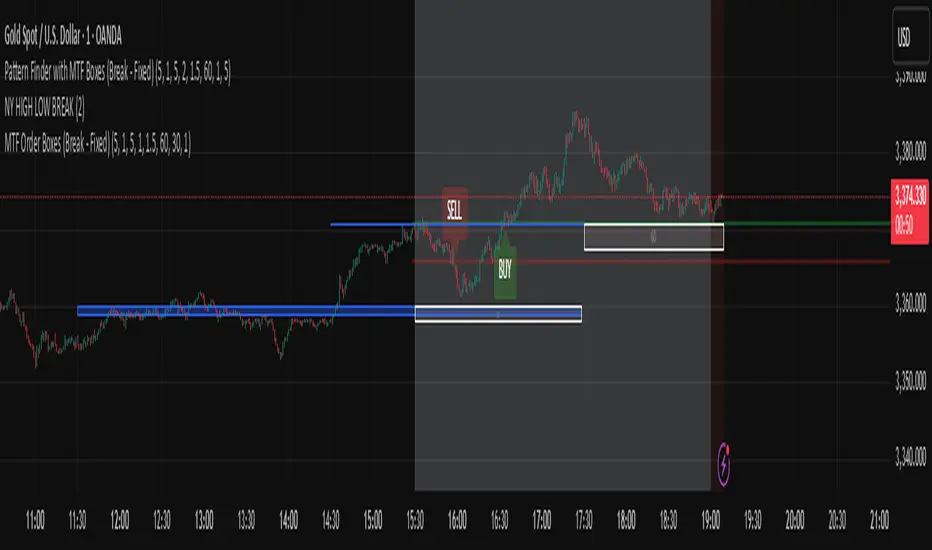
Pattern Finder with MTF Boxes (Break - Fixed)Script Title:
MTF Supply/Demand Zone Indicator with Candlestick Pattern Confirmation
Short Description:
This advanced strategy identifies key Supply and Demand zones (Order Blocks) on higher timeframes (30m & 1h) and then waits for a pullback to these zones on the current timeframe. The final entry signal is triggered upon the appearance of a valid candlestick pattern (e.g., Hammer, Engulfing) within these zones.
Full Description:
Introduction & Core Concept
This script is a powerful trading tool based on a combination of the following concepts:
Multi-Timeframe (MTF) Analysis: Identifying significant structures on higher timeframes to understand the bigger market picture.
Supply and Demand Zones: Finding areas where an imbalance between buyers and sellers has caused strong price movements.
Candlestick Patterns: Using classic candlestick patterns as the final confirmation for entering a trade at these key zones.
The main idea is to avoid trading blindly and instead wait for the price to react to a significant zone, then enter with a confirmation signal.
How the Strategy Works (Step-by-Step)
Identifying the Key Pattern on Higher Timeframes:
The script continuously monitors the 30-minute and 1-hour charts to find a specific pattern: a short consolidation period (usually 1-4 candles) immediately followed by a breakout with a powerful, high-momentum candle (Long Bar). This pattern indicates the formation of a fresh Supply or Demand Zone.
Drawing the Supply and Demand Boxes:
Green Box (Demand Zone): When a minor high is broken by a bullish Long Bar, this area is identified as potential support and marked with a green box.
Red Box (Supply Zone): When a minor low is broken by a bearish Long Bar, this area is identified as potential resistance and marked with a red box.
White Box (Long Bar / Trigger Zone): This box highlights the range of the Long Bar candle itself. A break of or return to this zone provides important signals.
Waiting for a Pullback:
After a zone is identified and drawn, the strategy waits for the price on your current chart to pull back into this box.
Entry Confirmation with Candlestick Patterns:
Once the price enters the box, the script looks for reversal candlestick patterns:
In a Demand Zone (Green Box): It looks for bullish patterns like the Hammer, Bullish Engulfing, Bullish Harami, and Morning Star. Upon detection, a BUY label appears on the chart.
In a Supply Zone (Red Box): It looks for bearish patterns like the Hanging Man, Shooting Star, Bearish Engulfing, Bearish Harami, and Evening Star. Upon detection, a SELL label appears.
Breakout Signal:
In addition to reversal signals, if the price breaks the White Box (Long Bar Zone) in the opposite direction, a breakout signal is generated, which could indicate a trend continuation.
Visual Elements on the Chart
Green/Red Boxes: The primary Supply and Demand zones from higher timeframes.
White Boxes: The range of the Long Bar candle that activated the primary zone.
BUY/SELL Labels: Trade signals that appear after a candlestick confirmation within the zones.
Moving Averages (SMA 100 & 200): Included to help identify the overall market trend. Trades aligned with the trend are generally more reliable.
Input Settings
period ATR & Bar multiplayer: Allow you to customize the definition of a "Long Bar" based on market volatility.
Number of candle for long bar avrage: The lookback period for calculating the average candle body size.
multiplayer for tp: A multiplier to calculate the take-profit based on the stop-loss size (Risk-to-Reward ratio).
How to Use This Strategy
Apply the script to your main trading timeframe (e.g., 5-minute or 15-minute).
Wait for a Supply (Red) or Demand (Green) zone to be drawn on your chart.
Be patient and wait for the price to return to this zone.
If a BUY or SELL label appears, consider it a valid entry signal.
Always combine these signals with your own analysis and the overall market context.
Disclaimer: This script is an analytical tool and should not be the sole basis for your trading decisions. Always practice proper risk management and thoroughly backtest its performance before using it in a live account.
Aqua MTF Trend Oscillator——————————————————————————————————————————————————————————
The Aqua Multi-Timeframe (MTF) Trend Oscillator is a comprehensive momentum and trend analysis tool designed to synthesize
complex market dynamics into a single, intuitive oscillator. It moves beyond single-timeframe analysis by aggregating
trend information from up to five distinct, user-configurable sources—spanning different timeframes, symbols, and
moving average types.
--- CORE CONCEPT ---
The strength and direction of a trend are rarely uniform across all market perspectives. This indicator's core
principle is to quantify and weigh the trend's character from multiple angles simultaneously. By blending these
perspectives, it generates a composite score that reflects the overall "consensus" of trend momentum, providing
a more robust view than any single moving average could offer alone.
--- METHODOLOGY ---
The indicator's power lies in its sophisticated, multi-step normalization process for each analysis slot:
1. **MA Calculation:** A standard moving average (e.g., EMA, SMA) is calculated for the specified source, symbol, and timeframe.
2. **Volatility-Normalized Distance:** It first measures the deviation of price from its moving average in terms
of Average True Range (ATR) units. This volatility-normalization step is crucial for comparing trend strength
across different timeframes or instruments, as it measures distance in a context-aware manner.
3. **Magnitude Squashing:** This ATR-based distance is then passed through a hyperbolic tangent (`tanh`) squashing
function. This elegantly transforms the potentially unbounded measurement into a standardized score oscillating
between -1 (maximum bearish magnitude) and +1 (maximum bullish magnitude). This prevents extreme outliers in one
timeframe from disproportionately skewing the final result.
4. **Weighted Aggregation:** Each of these normalized (-1 to +1) scores is then combined based on a user-defined
weight. The weighted average of all enabled slots produces the final composite score.
5. **Final Scaling & Smoothing:** The composite score is scaled to oscillate between -100 and +100. An optional
final smoothing pass can be applied to this master line to reduce noise and clarify the overall trend.
All higher-timeframe calculations are performed correctly within their native context to ensure the indicator is
non-repainting and provides a stable, reliable output on the chart.
--- KEY FEATURES ---
• **Five Independent Analysis Slots:** Fully customize up to five sources, each with its own symbol, timeframe, MA type, period, and weight.
• **Advanced Normalization:** Utilizes ATR and the hyperbolic tangent function for robust, comparable trend magnitude scores.
• **Correct MTF Calculation:** Employs best practices for non-repainting data requests, ensuring historical and real-time results are consistent.
• **Weighted Composite Score:** Assign importance to different timeframes to tailor the oscillator to your specific analytical needs.
• **Optional Master Smoothing:** Apply a final MA to the composite score line for enhanced clarity and signal filtering.
• **Clear Visualization:** A simple, color-coded oscillator line shows the final trend score, while individual component trends can also be plotted.
--- HOW TO INTERPRET ---
• **Zero Line Cross:** A cross above 0 indicates that the weighted balance of trend components has shifted to bullish. A cross below 0 signals a shift to bearish.
• **Oscillator Magnitude:** Values approaching +100 suggest a strong, broad-based uptrend consensus. Values nearing -100 indicate a strong downtrend consensus.
• **Slope:** The slope of the oscillator line indicates the accelerating or decelerating nature of the aggregate trend momentum.
• **Divergence:** As with any oscillator, watch for divergences between price action and the oscillator, which can signal a potential exhaustion of the prevailing trend.
Author: Aquaritek
——————————————————————————————————————————————————————————

Rapid ICT Suite - MTF Concepts & iFVGTitle: Rapid ICT Suite - MTF Concepts & iFVG
Overview
Unlock a new level of market analysis with the Rapid ICT Suite, a comprehensive, all-in-one indicator designed for the discerning price action trader. This powerful tool merges two distinct analytical engines into one seamless experience, allowing you to overlay critical Higher Timeframe (HTF) market structure onto your current chart while simultaneously tracking real-time Fair Value Gaps (FVGs) and their inversions (iFVGs).
Whether you are a scalper needing to respect 1H structure, a day trader aligning with the 4H bias, or a swing trader mapping the daily trend, this indicator provides the clarity and context you need to make higher-probability trading decisions. It was built from the ground up to solve common issues traders face, delivering stable, precise, and flexible analysis.
The Strategy: Targeting IRL with iFVG Entries
The Destination (The "Why"): Internal Range Liquidity (IRL)
On a Higher Timeframe (HTF), we will identify major Internal Range Liquidity (IRL) zones. In the context of ICT, IRL simply refers to unmitigated Fair Value Gaps (FVGs) that exist within a broader trading range.
These HTF FVGs act as powerful magnets for price. The market will often seek out these zones to rebalance before continuing its next major move. By plotting these on our chart, we establish a clear directional bias and a high-probability target. Our indicator will now label these HTF FVG boxes as "IRL".
The Entry Signal (The "How"): Inverted Fair Value Gaps (iFVG)
Once we have our HTF IRL target, we drop down to our Lower Timeframe (LTF) for execution.
We wait for price to create an Inverted Fair Value Gap (iFVG). An iFVG is a regular FVG that has failed and been traded through, signifying a shift in momentum.
An iFVG appearing on the LTF provides a high-precision entry signal to take a trade in the direction of the HTF IRL zone. It's our confirmation that the market is likely now making its move towards that destination.
Key Features
Multi-Timeframe Order Blocks (Boxes): Automatically identify and plot key HTF demand and supply zones (Order Blocks) onto your chart.
Multi-Timeframe Fair Value Gaps (Boxes): See where HTF imbalances exist, giving you a clear map of institutional reference points and potential targets.
Multi-Timeframe Liquidity Pools (Boxes): Pinpoint where buy-side and sell-side liquidity is likely resting, based on clusters of old highs and lows.
Current Timeframe FVG & iFVG (Lines/Labels): A second, independent engine tracks FVGs on your chosen timeframe, monitors them for mitigation, and automatically identifies when an FVG has been inverted (iFVG), a crucial shift in market dynamics.
The "Rapid" Advantage: Solving Trader Frustrations
This indicator was engineered to overcome three of the most common problems with technical indicators:
1. ✅ No More Flickering or "Ghost" Signals
The Problem: Many indicators show signals on the live, forming candle. This causes zones or signals to appear and disappear ("flicker"), leading to confusion and false entries.
The Solution: The Rapid ICT Suite uses 100% confirmed, closed-candle data for all its calculations (OB, FVG, and Liquidity). A zone will only appear on your chart after the price action that confirms it is complete. This means every signal is stable, reliable, and non-repainting.
2. ✅ Frame-Perfect, Precise Placement
The Problem: Indicators that use lookback logic often draw their signals one candle too late, causing a visual disconnect between the price pattern and the signal itself.
The Solution: We have corrected this common flaw. Every box and line is drawn starting from the exact confirmation candle of the pattern. This frame-perfect precision is critical for accurate analysis and planning your entries.
3. ✅ The Dual Analysis Engine: Uncluttered & Flexible
The Problem: Trying to analyze multiple timeframes at once can lead to cluttered charts and mental overload .
The Solution: This suite contains two independent parts that you can control separately.
Part 1 gives you the macro context—the HTF structure where big moves originate.
Part 2 gives you the micro details—the real-time FVG and iFVG story on your trading timeframe.
Use them together for a complete picture, or toggle one off to focus on a specific aspect of your strategy. This flexibility keeps your workspace clean and your analysis sharp.
How to Use & Settings Explained
The indicator settings are neatly organized into two main parts.
Part 1: MTF Concepts (OB, FVG, Liq)
This section controls the Higher Timeframe boxes that are overlaid onto your current chart.
Higher-TF for OB/FVG/Liq: This is the most important setting. Select the higher timeframe you want to analyze. For example, if you are trading on the 15-minute chart, you might set this to 240 (4-Hour) to see the key 4H zones.
Show Order-Blocks / FVGs / Liquidity: Simple toggles to turn each type of HTF zone on or off.
Max... Count: Controls how many of the most recent zones are displayed on the chart, preventing clutter from old, irrelevant zones.
Part 2: FVG & iFVG (Lines/Labels)
This section controls the second engine, which analyzes FVGs and iFVGs on its own selected timeframe.
Timeframe for FVG/iFVG: Choose the timeframe for this analysis. You can leave it blank to use your current chart's timeframe, or set it to a specific one.
Mitigation Type & Mitigation %: A powerful feature to define when an FVG is considered "used up."
Type: Choose if mitigation is counted from the candle's Wick or Close.
Percent: Set how far price must retrace into an FVG (e.g., 50%) before it is considered mitigated and the lines are removed from your chart.
FVG/iFVG Count: Controls how many of the most recent FVG/iFVG zones are displayed.
Style & Color Settings: Fully customize the appearance of the lines and labels to match your chart theme.
Final Words
This indicator was built to provide actionable clarity. By understanding the interplay between higher-timeframe structure and current price action, you can significantly enhance your trading edge. Thank you for choosing the Rapid ICT Suite.
Happy trading!

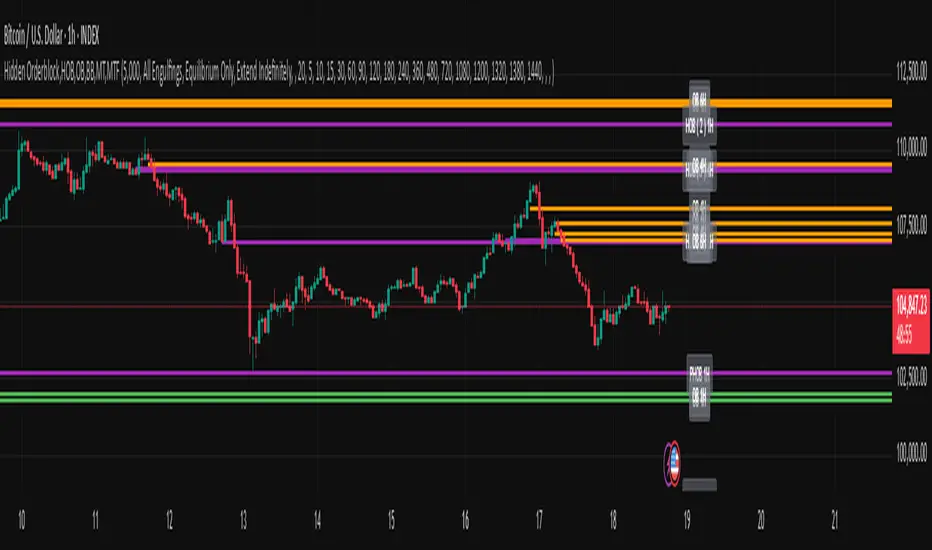
Hidden Orderblock,HOB,OB,BB,MT,MTF Hidden Order Block & Breaker Block (HOB/BB) Multi-Timeframe Analysis
A powerful tool for Smart Money traders and ICT-style practitioners seeking precision, confluence, and clean visual execution. This indicator identifies institutional price zones such as Hidden Order Blocks (HOB), Breaker Blocks (BB), Partial Hidden Order Blocks (PHOB), and traditional Order Blocks (OB)—all across multiple timeframes with minimal chart clutter.
✅ Key Features
1. Hidden Order Block (HOB) Detection
Identifies non-obvious order blocks often hidden within price action.
Requires the EQ (Equilibrium) of the block to pass through at least one Fair Value Gap (FVG).
Invalidation Rule: If price touches the EQ and then closes beyond it (depending on structure), the HOB is invalidated.
2. Breaker Block (BB) Detection
Highlights zones where price made a liquidity grab followed by a strong reversal.
Useful for anticipating support/resistance flips and high-probability reaction areas.
3. Partial Hidden Order Block (PHOB) Detection
A variation of HOBs where price only partially touches the EQ.
Often acts as an early warning zone for reversals or continuation.
Less strict than HOBs, but still institutionally relevant.
4. Traditional Order Block (OB) Detection
Identifies bullish/bearish OBs based on engulfing patterns and displacement.
Marks only the body of the engulfing candle, with the EQ line acting as a key validation/invalidation level.
Once the EQ is touched, the OB is considered invalidated.
5. Engulfing Filter Engine
Customizable logic for OB qualification.
“Easy Engulfing Mode” simplifies detection for newer traders or faster workflow.
Fine-tune aggressiveness and visual clarity with user-defined settings.
6. Multi-Timeframe (MTF) Visualization
Overlay OBs, HOBs, BBs, and PHOBs from higher timeframes (e.g., 4H, 1D) on lower timeframes (15m, 1H).
Enhances top-down confluence without switching charts.
Keeps the visual experience clean and intuitive.
7. Minimalist Visual Design
Only the zone boundaries and EQ lines are displayed.
No extra noise—perfect for both scalpers and swing traders.
Dynamic label positioning and styling for improved chart aesthetics.
8. Performance-Optimized Code
Lightweight, real-time rendering.
Designed for responsiveness—even on lower timeframes with dense historical data.
⚙️ How It Works (Simplified Logic)
Order Block Detection:
Scans for engulfing candles that show displacement.
Defines the OB as the body of the engulfing candle.
EQ line is marked and projected forward until invalidated.
Hidden Order Block Logic:
Starts from a traditional OB, but requires the EQ to pass through at least one FVG.
Upon a close beyond the EQ in the opposite direction, the HOB is invalidated.
PHOB Logic:
Similar to HOBs, but allows partial touches of the EQ before reacting.
Breaker Block Logic:
Identifies liquidity sweeps followed by impulsive moves.
Marks these zones as BBs for potential reaction areas.
📈 Use Cases
Detect institutional price zones with high precision.
Simplify decision-making with visual EQs and MTF overlays.
Integrate seamlessly into:
Smart Money Concepts (SMC)
ICT-style trading
Wyckoff methodology
Discretionary zone-to-zone strategies
🧠 Definitions Summary
OB (Order Block):
Engulfed candle body; EQ is the midpoint of the body. Invalid once EQ is touched.
HOB (Hidden Order Block):
Like OB, but EQ must pass through at least one FVG.
Invalidated when a candle touches EQ and closes beyond it.
PHOB (Partial Hidden Order Block):
Like HOB, but allows partial touch of the EQ to remain valid.
Apex Edge - MTF Confluence PanelApex Edge – MTF Confluence Panel
Description:
The Apex Edge – MTF Confluence Panel is a powerful multi-timeframe analysis tool built to streamline trade decision-making by aggregating key confluences across three user-defined timeframes. The panel visually presents the state of five core market signals—Trend, Momentum, Sweep, Structure, and Trap—alongside a unified Score column that summarizes directional bias with clarity.
Traders can customize the number of bullish/bearish conditions required to trigger a score signal, allowing the tool to be tailored for both conservative and aggressive trading styles. This script is designed for those who value a clean, structured, and objective approach to identifying market alignment—whether scalping or swing trading.
How it Works:
Across each of the three selected timeframes, the panel evaluates:
Trend: Based on a user-configurable Hull Moving Average (HMA), the script compares price relative to trend to determine bullish, bearish, or neutral bias.
Momentum: Uses OBV (On-Balance Volume) with volume spike detection to identify bursts of strong buying or selling pressure.
Sweep: Detects potential liquidity grabs by identifying price rejections beyond prior swing highs/lows. A break below a previous low with reversal signals bullish intent (and vice versa for bearish).
Structure: Uses dynamic pivot-based logic to identify market structure breaks (BOS) beyond recent confirmed swing levels.
Trap: Flags potential false moves by measuring RSI overbought/oversold signal clusters combined with minimal price movement—highlighting exhaustion or deceptive breaks.
Score: A weighted consensus of the above components. The number of required confluences to trigger a score (default: 3) can be set by the user via input, offering flexibility in signal sensitivity.
Why It’s Useful for Traders:
Quick Decision-Making: The color-coded panel provides instant visual feedback on whether confluences align across timeframes—ideal for fast-paced environments like scalping or high-volatility news sessions.
Multi-Timeframe Confidence: Helps eliminate guesswork by confirming whether higher and lower timeframe conditions support your trade idea.
Customizability: Adjustable confluence threshold means traders can fine-tune how sensitive the system is—more signals for faster entries, stricter confluence for higher conviction trades.
Built-In Alerts: Automated alerts for score alignment, trap detection, and liquidity sweeps allow traders to stay informed even when away from the screen.
Strategic Edge: Supports directional bias confirmation and trade filtering with logic designed to mimic professional decision-making workflows.
Features:
Clean, real-time confluence table across three user-selected timeframes
Configurable score sensitivity via “Minimum Confluences for Score” input
Cell-based colour coding for at-a-glance trade direction
Built-in alerts for score alignment, traps, and sweep triggers
Note - This Indicator works great in sync with Apex Edge - Session Sweep Pro
Useful levels for TP = previous session high/low boxes or fib levels.
⚠️ Disclaimer:
This script is for informational and educational purposes only and should not be considered financial advice. Always perform your own due diligence and practice proper risk management when trading.

DMI Percentile MTF📈 DMI Percentile MTF – Custom Technical Indicator
This indicator is an enhanced version of the classic Directional Movement Index (DMI), converting +DI, -DI, and ADX values into dynamic percentiles ranging from 0% to 100%, making it easier to interpret the strength and direction of a trend.
⚙️ Key Features:
Percentile Normalization: Calculates where current values stand within a historical range (default: 100 bars), providing clearer overbought/oversold context.
+DI (green): Indicates bullish directional strength.
-DI (orange): Indicates bearish directional strength.
ADX (fuchsia): Measures overall trend strength (rising = strong trend, falling = flat market).
20% / 80% reference lines: Help identify weak or strong conditions.
Multi-Timeframe (MTF) Support: Analyze a higher timeframe trend (e.g., daily) while viewing a lower timeframe chart (e.g., 1h).
📊 How to Read It:
+DI > -DI → bullish trend dominance.
-DI > +DI → bearish trend dominance.
ADX rising → strengthening trend (regardless of direction).
ADX falling → sideways or consolidating market.
Values above 80% → historically high / strong conditions.
Values below 20% → historically low / weak conditions or potential breakout setup.

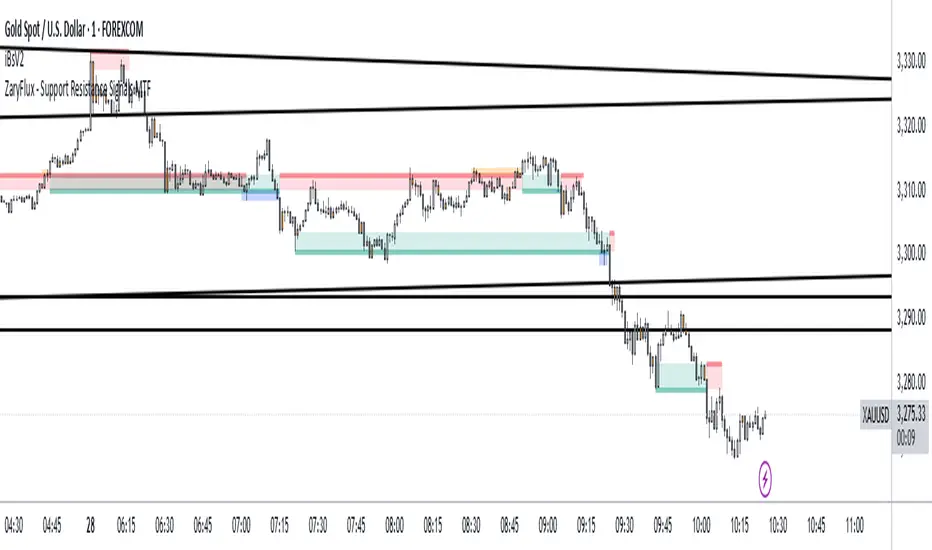
Support and Resistance Signals MTF [ZaryFlux]Support and Resistance Signals MTF is a powerful multi-timeframe (MTF) indicator designed to automatically detect key support and resistance levels across different timeframes.
It highlights significant price zones where reversals, breakouts, or trend continuations are most likely to occur — helping traders of all styles (scalping, swing, intraday) make smarter entries and exits.
Key Features :
Automatic plotting of dynamic support & resistance zones
Multi-Timeframe analysis: view higher timeframe zones directly on your current chart
Real-time alerts for price interactions with key levels
Customizable sensitivity for different trading strategies
Clean, non-cluttered design for easy readability
Whether you're trading Forex, crypto, stocks, or indices, this tool gives you a clearer view of market structure and high-probability trading zones.
Katsu mtf RSI CloudKatsu MTF RSI and Cloud
Multi-timeframe RSI-based analytical tool for advanced traders
The Katsu MTF RSI is a sophisticated indicator that combines two RSI signals from different timeframes into one powerful toolkit. It’s perfect for those looking for multi-timeframe confluence to make more precise trading decisions.
Key Features:
Dual RSI Setup (fully customizable timeframe and length):
The first RSI behaves in a traditional way.
The second RSI uses color-coding to visually indicate the dominant trend direction:
🟢 Green = Bullish, 🔴 Red = Bearish.
RSI EMA – Smoothed RSI Average:
Used to determine short-term direction. This moving average is essential for crafting entries and forming your overall trading strategy.
Dynamic Midline – Adaptive Overbought/Oversold Levels:
The overbought/oversold zones are not fixed (like 70/30), but are dynamically adjusted based on the RSI’s average behavior.
When RSI touches these adaptive levels, a small blue arrow appears, signaling a potential momentum shift.
This provides more precise signals than traditional static thresholds (e.g., 70/30 or 80/20).
RSI-Based Cloud Visualization:
The RSI is used to generate a visual cloud that reflects market structure:
When RSI breaks out above the cloud, followed by RSI2, it can signal a strong entry point.
When RSI enters the cloud and reverses, it may indicate a potential exit or reversal zone.
The cloud uses three distinct colors to represent momentum:
Green: RSI is above the cloud → Strong bullish pressure, price well above the trend zone.
Red: RSI is below the cloud → Strong bearish pressure, price well below the trend zone.
Yellow: RSI is inside the cloud → Sideways or corrective move, often a potential exit zone, as the trend may be stalling.
Visual Momentum Feedback (Background Highlight):
The background color shifts to indicate whether RSI is moving above or below 50, giving a quick read on bullish or bearish momentum.
This indicator is especially powerful for multi-timeframe strategies where entries are made on a lower timeframe, but confirmation comes from a higher one. It provides a dynamic, visual framework to stay in sync with the market’s rhythm.
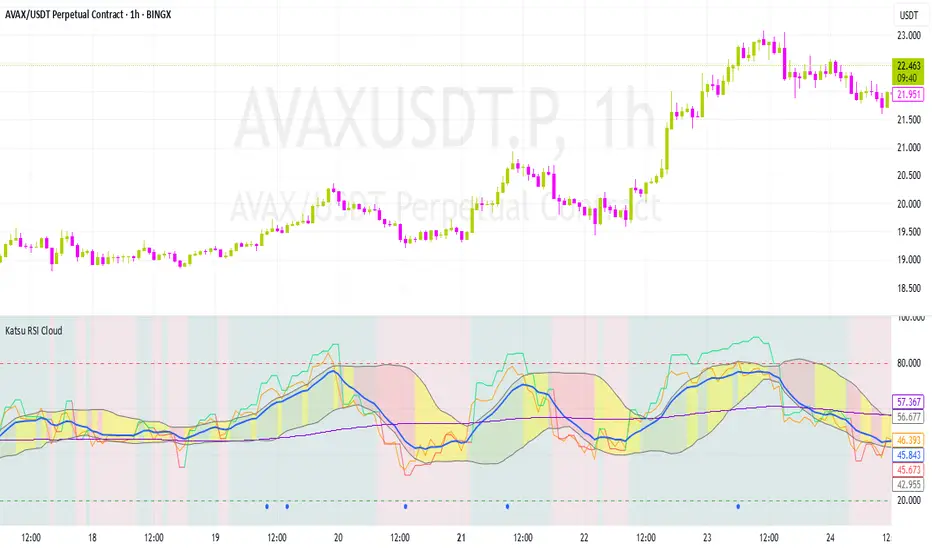
SuperTrend MTF Pro [Cometreon]The SuperTrend MTF Pro takes the classic SuperTrend to a whole new level of customization and accuracy. Unlike the standard version, this indicator allows you to select different moving averages, apply it to various chart types, and fine-tune every key parameter.
If you're looking for an advanced, non-repainting, and highly configurable SuperTrend, this is the right choice for you.
🔷 New Features and Improvements
🟩 Multi-MA SuperTrend
Now you can customize the SuperTrend calculation by choosing from 15 different moving averages:
SMA (Simple Moving Average)
EMA (Exponential Moving Average)
WMA (Weighted Moving Average)
RMA (Smoothed Moving Average)
HMA (Hull Moving Average)
JMA (Jurik Moving Average)
DEMA (Double Exponential Moving Average)
TEMA (Triple Exponential Moving Average)
LSMA (Least Squares Moving Average)
VWMA (Volume-Weighted Moving Average)
SMMA (Smoothed Moving Average)
KAMA (Kaufman’s Adaptive Moving Average)
ALMA (Arnaud Legoux Moving Average)
FRAMA (Fractal Adaptive Moving Average)
VIDYA (Variable Index Dynamic Average)
🟩 Multiple Chart Types
You're no longer limited to candlestick charts! Now you can use SuperTrend with different chart formats, including:
Heikin Ashi
Renko
Kagi
Line Break
Point & Figure
🟩 Customizable Timeframe
Now you can adjust the SuperTrend timeframe without repainting issues, avoiding signal distortions.
🔷 Technical Details and Customizable Inputs
SuperTrend offers multiple customization options to fit any trading strategy:
1️⃣ ATR Period – Defines the ATR length, affecting the indicator’s sensitivity.
2️⃣ Source – Selects the price value used for calculations (Close, HL2, Open, etc.).
3️⃣ ATR Mult – Multiplies the ATR to determine band distance. Higher values reduce false signals, lower values make it more reactive.
4️⃣ Change ATR Calculation Method – When enabled, uses the default ATR method; when disabled, allows selecting another Moving Average with "Use Different Type".
5️⃣ Source Break – Defines the price source for trend changes (Close for more stability, High/Low for more reactivity).
6️⃣ Use Different Type – Allows selecting an alternative Moving Average for ATR calculation if "Change ATR Calculation Method" is disabled.
7️⃣ SuperTrend Type – Advanced options for specific MAs (JMA, ALMA, FRAMA, VIDYA), with dedicated parameters like Phase, Sigma, and Offset for optimized responsiveness.
8️⃣ Ticker Settings – Customize parameters for special chart types such as Renko, Heikin Ashi, Kagi, Line Break, and Point & Figure, adjusting reversal, number of lines, and ATR length.
9️⃣ Timeframe – Enables using SuperTrend on a higher timeframe.
🔟 Wait for Timeframe Closes -
✅ Enabled – Prevents multiple signals, useful for precise alerts.
❌ Disabled – Displays SuperTrend smoothly without interruptions.
🔷 How to Use SuperTrend MTF Pro
🔍 Identifying Trends
SuperTrend follows the ongoing trend and provides clear visual signals:
When the price is above the line, the trend is bullish.
When the price is below the line, the trend is bearish.
📈 Interpreting Signals
Line color and position change → Possible trend reversal
Bounce off the line → Potential trend continuation
Strong breakout of the line → Possible reversal
🛠 Integration with Other Tools
RSI or MACD to filter false signals
Moving Averages to confirm trend direction
Support and Resistance to improve entry points
☄️ If you find this indicator useful, leave a Boost to support its development!
Every feedback helps to continuously improve the tool, offering an even more effective trading experience. Share your thoughts in the comments! 🚀🔥

ST -Dashboard Volume MTF , [Sese04]User Guide: ST - Dashboard Volume MTF
Introduction
This script displays a multi-timeframe (MTF) volume dashboard, tracking buy and sell volumes and the moving averages of volume. It is designed for traders using ICT (Inner Circle Trader) and SMC (Smart Money Concepts) to quickly visualize market dynamics across multiple timeframes.
Settings and Features
📌 User Inputs
Customizable settings allow traders to adjust the dashboard display and volume moving averages.
Volume Display per Timeframe
show_vol_1m: Show volume for 1-minute chart.
show_vol_5m: Show volume for 5-minute chart.
show_vol_15m: Show volume for 15-minute chart.
show_vol_1h: Show volume for 1-hour chart.
show_vol_4h: Show volume for 4-hour chart.
show_vol_1d: Show volume for 1-day chart.
Volume Moving Average Settings
ma_length_short: Length of the short-term moving average (default 5 periods).
ma_length_long: Length of the long-term moving average (default 14 periods).
Dashboard Customization
dashboard_position: Dashboard position (Bottom Right, Bottom Left, Top Right, Top Left).
text_color: Text color for the dashboard.
text_size: Text size (small, normal, large).
How the Script Works
🔹 1. Calculating Buy and Sell Volume
The calculate_buy_sell function separates buy and sell volume based on the candle's open and close price:
If the closing price is higher than the opening price → Buy volume 📈.
If the closing price is lower or equal to the opening price → Sell volume 📉.
🔹 2. Retrieving Volume Data Across Multiple Timeframes
The function get_volumes collects buy and sell volume data for different timeframes using request.security().
The available timeframes are: 1m, 5m, 15m, 1h, 4h, and 1d.
🔹 3. Calculating Volume Moving Averages
The script uses ta.sma() to compute moving averages for volume trends:
ma_vol_short: Short-term moving average (e.g., 5 periods).
ma_vol_long: Long-term moving average (e.g., 14 periods).
🔹 4. Creating and Displaying the Dashboard
A table (table.new()) is generated at the last bar (barstate.islast) to display the volume data:
A title “📊 Volume Dashboard (Buy vs Sell)” in purple.
Column headers:
TIMEFRAME (e.g., 1M, 5M, 15M, 1H, 4H, 1D).
BUY VOLUME (dark blue).
SELL VOLUME (dark red).
Buy and Sell Volume values are displayed in their respective cells for easy reading.
How to Use This Script on TradingView?
Adding the Script
Open TradingView.
Go to Pine Editor and paste the script.
Click "Add to Chart".
Configuring the Settings
Open the indicator settings.
Enable/disable the desired timeframes.
Adjust the moving average lengths if necessary.
Interpreting the Data
Increasing buy volume across timeframes may indicate bullish momentum.
Rising sell volume suggests a bearish reversal.
Crossovers of volume moving averages can help detect market shifts.
Conclusion
This script is a powerful tool for analyzing volume dynamics across multiple timeframes. It provides a quick overview of the balance between buyers and sellers, essential for ICT scalping and liquidity-based trading.
🚀 Pro Tip: Combine this dashboard with other SMC indicators (engulfing candles, pivot points) to refine your trading decisions.
