MTF BB Meow Mix [acatwithcharts]This script adds multi-timeframe support to full BB Meow Mix, with the full set of various moving average and stdev calculation types.
There is a tradeoff in that there is, to the best of my knowledge, no way to support both MTF and the default band settings menu in the same script, because the security() function in Pinescipt doesn't support variable lookback lengths and trying to plot everything independently instead maxes out the number of plots allowed per script. So, this version of the script doesn't include a menu of defaults.
My volatility indicators are available by subscription in several packages through SharkCharts.live.
Current pricing and subscription details will be kept up-to-date on SharkCharts.live
Cerca negli script per "mtf"

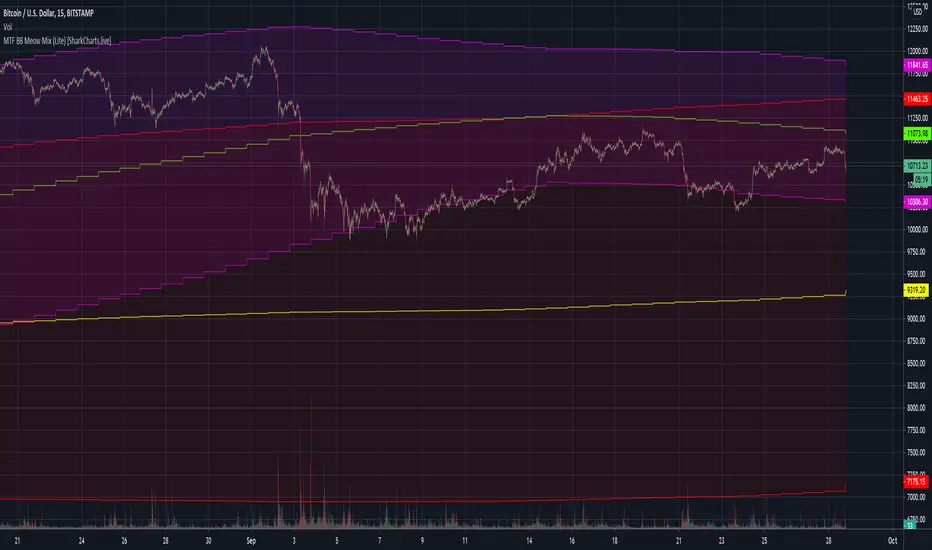
MTF BB Meow Mix (Lite) [acatwithcharts]This script adds multi-timeframe support to BB Meow Mix (Lite).
There is a tradeoff in that there is, to the best of my knowledge, no way to support both MTF and the default band settings menu in the same script, because the security() function in Pinescipt doesn't support variable lookback lengths and trying to plot everything independently instead maxes out the number of plots allowed per script. So, this version of the script doesn't include a menu of defaults.
My volatility indicators are available by subscription in several packages through SharkCharts.live.
Current pricing and subscription details will be kept up-to-date on SharkCharts.live
MTF candles by yatrader2Get higher time frame candles overlaid on a lower timeframe chart.
Add 1H candles on 1M or 1D on 30M
Overlaid candles feature wicks and multiple display options to customize appearance.
Add the indicator multiple times to get MTF (multiple time frames) all on one chart.

MTF RSI by Emiliano MesaA MTF RSI . It shows you either the RSI is oversold or overbought in up to 4 different timeframes which are all fully customizable by the user. Furthermore it allows you to set the oversold and overbought levels.
Green : Overbought
Red : Oversold
Gray : Neither overbought or oversold
MTF StochRSI Grid v2.0 - CryptoProToolsNew version has added the following :
- Custom Time Frames (not limited to TradingViews default resolution selection)
- Optional Medium Strength Signals (Matching 3 x OB or OS instead of the full 4)
- Toggle Highlight Bar Colors ON and OFF
- Signal arrows visible above and below the grid
Original Version Can Be Found Here :
Get Access To This + All of our other current and future indicator releases with a CryptoProTools Lifetime Membership
------------------------------------------------
Other Popular CryptoProTools Releases

MTF Center of Gravity Grid [checkm8]Hello and welcome to my multi-timeframe center of gravity (COG) grid.
Center of gravity is a zero-lag oscillator created by John Ehlers and to get a better understanding of it, you can read his original works here: www.mesasoftware.com
My oscillator features a grid from four timeframes (selected by the user), to show the whether the center of gravity line is above or below its relative EMA. You can use this indicator as a tool to spot potential changes in the trend as they occur. In addition to this, the oscillator displays the COG line, with its relative EMA, on the current timeframe.
By default:
1) The fill between the COG and the EMA will be navy blue when the COG is dominant, and maroon when the EMA is dominant.
2) The grid will show fuchsia-colored blocks when the COG is above its relative EMA on the selected MTF timeframe, and orange when the COG is below the EMA.
If you have any questions, suggestions, or concerns, feel free to reach out.
Happy trading!

MTF RSI Grid with MFI [checkm8]Hello and welcome to my version of the multi-timeframe RSI grid, with MFI.
This oscillator is relatively simple and plots four sets of timeframes (selected by the user) within the levels between 30 and 70. In addition to this, it plots the RSI from the current timeframe, as well as the MFI.
As per the default settings:
1) The grid will show lime-colored blocks when the RSI is below 20 and green blocks when RSI is below 30.
2) The grid will show red-colored blocks when RSI is above 80 and orange blocks when RSI is above 70.
3) The initial MTF setup is set to 1 Hour, 2 Hour, 3 Hour, and 4 Hour timeframes. You can adjust this to your preference in the oscillator settings.
4) The purple line is RSI, the teal line is MFI.
Note: the grid only displays RSI values, not MFI.
Happy trading!
MTF Donchian Quadrants [DW]This is a simple Donchian Channel variation that separates the the channels into quadrants, and enables MTF calculation.
Average open and close plots are included for additional confirmation of a trend.

MTF Trend 4 in 1 multi time frame consistence check indicatorPrice can be up trend and downtrend simultaneously in different timeframes.
Experienced traders know the importance of looking at Multiple Time Frames.
Analyzing multi time frame chart allows trader to have a greater view on the price action.
This MTF trend indicator shows the trend of current time frame and 3 higher time frames in a single chart. In addition, it will check the consistence of all 4 time frames. It will not repaint.
It will only work on time based charts. Tick and range charts are not supported.
The green dots represent uptrend, and the red dots represent downtrend.
The 'trend period' is used to measure the direction of price within the given number of bars.
The dots of value 1 at the bottom is the trend of 'timeframe 1'
The dots of value 2 is the trend of 'timeframe 2'
The dots of value 3 is the trend of 'timeframe 3'
The dots of value 4 is the trend of current timeframe.
If current and 3 higher time frames are in the same direction, the dots at the top will appear.
Otherwise, there will be no dots at value 6.
'timeframe1' 'timeframe2' and 'timeframe3' must be higher than current timeframe, if your chart is 15min, then 'timeframe1' 'timeframe2' and 'timeframe3' must be 15min or higher.
It will highlight bars when trends are inconsistent in different timeframes.
You can change the highlight color, or disable this feature.
The highlighted bars represent the situation where price may change its direction from previous trend, or in a short-term adjustment.

Multi SMA EMA WMA HMA BB (5x8 MAs Bollinger Bands) MAX MTF - RRBMulti SMA EMA WMA HMA 4x7 Moving Averages with Bollinger Bands MAX MTF by RagingRocketBull 2019
Version 1.0
All available MAX MTF versions are listed below (They are very similar and I don't want to publish them as separate indicators):
ver 1.0: 4x7 = 28 MTF MAs + 28 Levels + 3 BB = 59 < 64
ver 2.0: 5x6 = 30 MTF MAs + 30 Levels + 3 BB = 63 < 64
ver 3.0: 3x10 = 30 MTF MAs + 30 Levels + 3 BB = 63 < 64
ver 4.0: 5(4+1)x8 = 8 CurTF MAs + 32 MTF MAs + 20 Levels + 3 BB = 63 < 64
ver 5.0: 6(5+1)x6 = 6 CurTF MAs + 30 MTF MAs + 24 Levels + 3 BB = 63 < 64
ver 6.0: 4(3+1)x10 = 10 CurTF MAs + 30 MTF MAs + 20 Levels + 3 BB = 63 < 64
Fib numbers: 8, 13, 21, 34, 55, 89, 144, 233, 377
This indicator shows multiple MAs of any type SMA EMA WMA HMA etc with BB and MTF support, can show MAs as dynamically moving levels.
There are 4 MA groups + 1 BB group, a total of 4 TFs * 7 MAs = 28 MAs. You can assign any type/timeframe combo to a group, for example:
- EMAs 9,12,26,50,100,200,400 x H1, H4, D1, W1 (4 TFs x 7 MAs x 1 type)
- EMAs 8,13,21,30,34,50,55,89,100,144,200,233,377,400 x M15, H1 (2 TFs x 14 MAs x 1 type)
- D1 EMAs and SMAs 8,13,21,30,34,50,55,89,100,144,200,233,377,400 (1 TF x 14 MAs x 2 types)
- H1 WMAs 13,21,34,55,89,144,233; H4 HMAs 9,12,26,50,100,200,400; D1 EMAs 12,26,89,144,169,233,377; W1 SMAs 9,12,26,50,100,200,400 (4 TFs x 7 MAs x 4 types)
- +1 extra MA type/timeframe for BB
There are several versions: Simple, MTF, Pro MTF, Advanced MTF, MAX MTF and Ultimate MTF. This is the MAX MTF version. The Differences are listed below. All versions have BB
- Simple: you have 2 groups of MAs that can be assigned any type (5+5)
- MTF: +2 custom Timeframes for each group (2x5 MTF) +1 TF for BB, TF XY smoothing
- Pro MTF: 4 custom Timeframes for each group (4x3 MTF), 1 TF for BB, MA levels and show max bars back options
- Advanced MTF: +4 extra MAs/group (4x7 MTF), custom Ticker/Symbols, Timeframe <>= filter, Remove Duplicates Option
- MAX MTF: +2 subtypes/group, packed to the limit with max possible MAs/TFs: 4x7, 5x6, 3x10, 4(3+1)x10, 5(4+1)x8, 6(5+1)x6
- Ultimate MTF: +individual settings for each MA, custom Ticker/Symbols
MAX MTF version tests the limits of Pinescript trying to squeeze as many MAs/TFs as possible into a single indicator.
It's basically a maxed out Advanced version with subtypes allowing for mixed types within a group (i.e. both emas and smas in a single group/TF)
Pinescript has the following limits:
- max 40 security calls (6 calls are reserved for dupe checks and smoothing, 2 are used for BB, so only 32 calls are available)
- max 64 plot outputs (BB uses 3 outputs, so only 61 plot outputs are available)
- max 50000 (50kb) size of the compiled code
Based on those limits, you can only have the following MAs/TFs combos in a single script:
1. 4x7, 5x6, 3x10 - total number of MTF MAs must always be <= 32, and you can still have BB and Num Levels = total MAs, without any compromises
2. 5(4+1)x8, 6(5+1)x6, 4(3+1)x10 - you can use the Current Symbol/Timeframe as an extra (+1) fixed TF with the same number of MTF MAs
- you don't need to call security to display MAs on the Current Symbol/Timeframe, so the total number of MTF MAs remains the same and is still <= 32
- to fit that many MAs into the max 64 plot outputs limit you need to reduce the number of levels (not every MA Group will have corresponding levels)
Features:
- 4x7 = 28 MAs of any type
- 4x MTF groups with XY step line smoothing
- +1 extra TF/type for BB MAs
- 2 MA subtypes within each group/TF
- 4x7 = 28 MA levels with adjustable group offsets, indents and shift
- supports any existing type of MA: SMA, EMA, WMA, Hull Moving Average (HMA)
- custom tickers/symbols for each group
- show max bars back option
- show/hide both groups of MAs/levels/BB and individual MAs
- timeframe filter: show only MAs/Levels with TFs <>= Current TF
- hide MAs/Levels with duplicate TFs
- support for custom TFs that are not available in free accounts: 2D, 3D etc
- support for timeframes in H: H, 2H, 4H etc
Notes:
- Uses timeframe textbox instead of input resolution dropdown to allow for 240 120 and other custom TFs
- Uses symbol textbox instead of input symbol to avoid establishing multiple dummy security connections to the current ticker - otherwise empty symbols will prevent script from running
- Possible reasons for missing MAs on a chart:
- there may not be enough bars in history to start plotting it. For example, W1 EMA200 needs at least 200 bars on a weekly chart.
- for charts with low/fractional prices i.e. 0.00002 << 0.001 (default Y smoothing step) decrease Y smoothing as needed (set Y = 0.0000001) or disable it completely (set X,Y to 0,0)
- for charts with high price values i.e. 20000 >> 0.001 increase Y smoothing as needed (set Y = 10-20). Higher values exceeding MAs point density will cause it to disappear as there will be no points to plot. Different TFs may require diff adjustments
- TradingView Replay Mode UI and Pinescript security calls are limited to TFs >= D (D,2D,W,MN...) for free accounts
- attempting to plot any TF < D1 in Replay Mode will only result in straight lines, but all TFs will work properly in history and real-time modes. This is not a bug.
- Max Bars Back (num_bars) is limited to 5000 for free accounts (10000 for paid), will show error when exceeded. To plot on all available history set to 0 (default)
- Slow load/redraw times. This indicator becomes slower, its UI less responsive when:
- Pinescript Node.js graphics library is too slow and inefficient at plotting bars/objects in a browser window. Code optimization doesn't help much - the graphics engine is the main reason for general slowness.
- the chart has a long history (10000+ bars) in a browser's cache (you have scrolled back a couple of screens in a max zoom mode).
- Reload the page/Load a fresh chart and then apply the indicator or
- Switch to another Timeframe (old TF history will still remain in cache and that TF will be slow)
- in max possible zoom mode around 4500 bars can fit on 1 screen - this also slows down responsiveness. Reset Zoom level
- initial load and redraw times after a param change in UI also depend on TF. For example: D1/W1 - 2 sec, H1/H4 - 5-6 sec, M30 - 10 sec, M15/M5 - 4 sec, M1 - 5 sec. M30 usually has the longest history (up to 16000 bars) and W1 - the shortest (1000 bars).
- when indicator uses more MAs (plots) and timeframes it will redraw slower. Seems that up to 5 Timeframes is acceptable, but 6+ Timeframes can become very slow.
- show_last=last_bars plot limit doesn't affect load/redraw times, so it was removed from MA plot
- Max Bars Back (num_bars) default/custom set UI value doesn't seem to affect load/redraw times
- In max zoom mode all dynamic levels disappear (they behave like text)
- Dupe check includes symbol: symbol, tf, both subtypes - all must match for a duplicate group
- For the dupe check to work correctly a custom symbol must always include an exchange prefix. BB is not checked for dupes
Good Luck! Feel free to learn from/reuse the code to build your own indicators.

Multi SMA EMA WMA HMA BB (5+5 MAs + Bollinger Bands) MTF by RRBMulti SMA EMA WMA HMA BB (5+5 Moving Averages of Any Type with Bollinger Bands) MTF by RagingRocketBull 2018
Version 1.0
This indicator shows multiple MAs of any type (SMA EMA WMA HMA etc) with BB and MTF support
There are several versions: Simple, MTF, Pro MTF and Ultimate MTF. This is the MTF version. The Differences are listed below. All versions have BB
- Simple: you have 2 groups of MAs that can be assigned any type (5+5)
- MTF: +assign 1 custom Timeframe to any group combo (5+5 Custom TF)
- Pro MTF: +multiple Timeframes for multiple MA groups (4*3 MTF), horizontal levels and show max bars back options
- Ultimate MTF: +individual settings for each MA, multiple Timeframes
There are 2 groups of MAs, 3rd group is BB. You can:
- show/hide all MAs in a group. Use length 0 to hide a particular MA independently or uncheck in Style.
- apply any MA type to all MAs in a particular MA group. For example, you can assign all EMAs the HMA type. Groups are called EMAs and SMAs just for reference.
- assign Custom Timeframe to a particular MA/BB group combination or all groups. For example, show daily (D) EMAs+SMAs on H1 Timeframe, or only H4 (240) BB on H1.
You can use different types of MAs as dynamic S/R levels to trade of off and MA crosses as signals for possible trend change (golden/death bull/bear crosses).
Current Timeframe MAs can be used together with Custom Timeframe MAs on a single chart. Higher TF MAs are more important than lower TF MAs.
Most common MA types are: SMA, EMA, WMA, HMA.
Most common MA lengths are: 12, 20, 26, 30, 50, 100, 200, 400 etc.
MTF Notes:
- Script UI uses simple timeframe textbox instead of input resolution dropdown to allow for 240 120 and other custom TFs
- Groups that are not assigned a Custom TF will use Current Timeframe (0).
- MTF will work for any MA type assigned to the group. BB group always uses SMA type.
- MTF works both ways: you can display a higher TF MA/BB on a lower TF or a lower TF MA/BB on a higher TF.
- MTF MA values are normally aligned at the boundary of their native timeframe. This produces stair stepping when a higher TF MA is viewed on a lower TF.
Therefore Point Density/Smoothing is applied by default on MA MTF for visual aesthetics. Set to 0 to disable and see exact ma mtf values (lines with stair stepping and original mtf alignment).
- Smoothing is disabled for BB MTF because fill doesn't work with smoothed MAs after duplicate values are replaced with na.
- MTF MA Value fluctuation is possible on the current bar due to default security lookahead
Features:
- 2 groups of custom 5+5 MAs of any type including Hull Moving Average (HMA)
- BB
- 1x Custom Timeframe with step line smoothing for 3 groups (MAs + BB)
1. based on 3EmaBB, uses plot, fill, security, change, barstate, stdev and custom hma functions
2. you can't set certain constants from input due to Pinescript limitations - change the code as needed, recompile and use as a private script version
3. you can't have plot* inside ?/if/for/function, and implementing condition forks using 2 sets of plots (na vs non-na) doubles indicator params and styles - confusing
4. swma has a fixed length = 4, alma and linreg have additional offset and smoothing params
Feel free to use. Good Luck!

Multi SMA EMA WMA HMA BB (4x5 MAs Bollinger Bands) Adv MTF - RRBMulti SMA EMA WMA HMA 4x5 Moving Averages with Bollinger Bands Advanced MTF by RagingRocketBull 2019
Version 1.0
This indicator shows multiple MAs of any type SMA EMA WMA HMA etc with BB and MTF support, can show MAs as dynamically moving levels.
There are 4 MA groups + 1 BB group, a total of 4 TFs * 5 MAs = 20 MAs. You can assign any type/timeframe combo to a group, for example:
- EMAs 12,26,50,100,200 x H1, H4, D1, W1 (4 TFs x 5 MAs x 1 type)
- EMAs 8,10,13,21,30,50,55,100,200,400 x M15, H1 (2 TFs x 10 MAs x 1 type)
- D1 EMAs and SMAs 8,10,12,26,30,50,55,100,200,400 (1 TF x 10 MAs x 2 types)
- H1 WMAs 7,77,89,167,231; H4 HMAs 12,26,50,100,200; D1 EMAs 89,144,169,233,377; W1 SMAs 12,26,50,100,200 (4 TFs x 5 MAs x 4 types)
- +1 extra MA type/timeframe for BB
There are several versions: Simple, MTF, Pro MTF, Advanced MTF and Ultimate MTF. This is the Advanced MTF version. The Differences are listed below. All versions have BB
- Simple: you have 2 groups of MAs that can be assigned any type (5+5)
- MTF: +2 custom Timeframes for each group (2x5 MTF) +1 TF for BB, TF XY smoothing
- Pro MTF: 4 custom Timeframes for each group (4x3 MTF), 1 TF for BB, MA levels and show max bars back options
- Advanced MTF: +2 extra MAs/group (4x5 MTF), custom Ticker/Symbols, Timeframe <>= filter, Remove Duplicates Option
- Ultimate MTF: +individual settings for each MA, custom Ticker/Symbols
Features:
- 4x5 = 20 MAs of any type
- 4x MTF groups with XY step line smoothing
- +1 extra TF/type for BB MAs
- 4x5 = 20 MA levels with adjustable group offsets, indents and shift
- supports any existing type of MA: SMA, EMA, WMA, Hull Moving Average (HMA)
- custom tickers/symbols for each group - you can compare MAs of the same symbol across exchanges
- show max bars back option
- show/hide both groups of MAs/levels/BB and individual MAs
- timeframe filter: show only MAs/Levels with TFs <>= Current TF
- hide MAs/Levels with duplicate TFs
- support for custom TFs that are not available in free accounts: 2D, 3D etc
- support for timeframes in H: H, 2H, 4H etc
Notes:
- Uses timeframe textbox instead of input resolution dropdown to allow for 240 120 and other custom TFs
- Uses symbol textbox instead of input symbol to avoid establishing multiple dummy security connections to the current ticker - otherwise empty symbols will prevent script from running
- Possible reasons for missing MAs on a chart:
- there may not be enough bars in history to start plotting it. For example, W1 EMA200 needs at least 200 bars on a weekly chart.
- price << default Y smoothing step 5. For charts with low/fractional prices (i.e. 0.00002 << 5) adjust X Y smoothing as needed (set Y = 0.0000001) or disable it completely (set X,Y to 0,0)
- TradingView Replay Mode UI and Pinescript security calls are limited to TFs >= D (D,2D,W,MN...) for free accounts
- attempting to plot any TF < D1 in Replay Mode will only result in straight lines, but all TFs will work properly in history and real-time modes. This is not a bug.
- Max Bars Back (num_bars) is limited to 5000 for free accounts (10000 for paid), will show error when exceeded. To plot on all available history set to 0 (default)
- Slow load/redraw times. This indicator becomes slower, its UI less responsive when:
- Pinescript Node.js graphics library is too slow and inefficient at plotting bars/objects in a browser window. Code optimization doesn't help much - the graphics engine is the main reason for general slowness.
- the chart has a long history (10000+ bars) in a browser's cache (you have scrolled back a couple of screens in a max zoom mode).
- Reload the page/Load a fresh chart and then apply the indicator or
- Switch to another Timeframe (old TF history will still remain in cache and that TF will be slow)
- in max possible zoom mode around 4500 bars can fit on 1 screen - this also slows down responsiveness. Reset Zoom level
- initial load and redraw times after a param change in UI also depend on TF. For example:
D1/W1 - 2 sec, H1/H4 - 5-6 sec, M30 - 10 sec, M15/M5 - 4 sec, M1 - 5 sec.
M30 usually has the longest history (up to 16000 bars) and W1 - the shortest (1000 bars).
- when indicator uses more MAs (plots) and timeframes it will redraw slower. Seems that up to 5 Timeframes is acceptable, but 6+ Timeframes can become very slow.
- show_last=last_bars plot limit doesn't affect load/redraw times, so it was removed from MA plot
- Max Bars Back (num_bars) default/custom set UI value doesn't seem to affect load/redraw times
- In max zoom mode all dynamic levels disappear (they behave like text)
1. based on 3EmaBB, uses plot*, barssince and security functions
2. you can't set certain constants from input due to Pinescript limitations - change the code as needed, recompile and use as a private version
3. Levels = trackprice implementation
4. Show Max Bars Back = show_last implementation
5. swma has a fixed length = 4, alma and linreg have additional offset and smoothing params
6. Smoothing is applied by default for visual aesthetics on MTF. To use exact ma mtf values (lines with stair stepping) - disable it
Good Luck! You can explore, modify/reuse the code to build your own indicators.

MTF Signal XpertMTF Signal Xpert – Detailed Description
Overview:
MTF Signal Xpert is a proprietary, open‑source trading signal indicator that fuses multiple technical analysis methods into one cohesive strategy. Developed after rigorous backtesting and extensive research, this advanced tool is designed to deliver clear BUY and SELL signals by analyzing trend, momentum, and volatility across various timeframes. Its integrated approach not only enhances signal reliability but also incorporates dynamic risk management, helping traders protect their capital while navigating complex market conditions.
Detailed Explanation of How It Works:
Trend Detection via Moving Averages
Dual Moving Averages:
MTF Signal Xpert computes two moving averages—a fast MA and a slow MA—with the flexibility to choose from Simple (SMA), Exponential (EMA), or Hull (HMA) methods. This dual-MA system helps identify the prevailing market trend by contrasting short-term momentum with longer-term trends.
Crossover Logic:
A BUY signal is initiated when the fast MA crosses above the slow MA, coupled with the condition that the current price is above the lower Bollinger Band. This suggests that the market may be emerging from a lower price region. Conversely, a SELL signal is generated when the fast MA crosses below the slow MA and the price is below the upper Bollinger Band, indicating potential bearish pressure.
Recent Crossover Confirmation:
To ensure that signals reflect current market dynamics, the script tracks the number of bars since the moving average crossover event. Only crossovers that occur within a user-defined “candle confirmation” period are considered, which helps filter out outdated signals and improves overall signal accuracy.
Volatility and Price Extremes with Bollinger Bands
Calculation of Bands:
Bollinger Bands are calculated using a 20‑period simple moving average as the central basis, with the upper and lower bands derived from a standard deviation multiplier. This creates dynamic boundaries that adjust according to recent market volatility.
Signal Reinforcement:
For BUY signals, the condition that the price is above the lower Bollinger Band suggests an undervalued market condition, while for SELL signals, the price falling below the upper Bollinger Band reinforces the bearish bias. This volatility context adds depth to the moving average crossover signals.
Momentum Confirmation Using Multiple Oscillators
RSI (Relative Strength Index):
The RSI is computed over 14 periods to determine if the market is in an overbought or oversold state. Only readings within an optimal range (defined by user inputs) validate the signal, ensuring that entries are made during balanced conditions.
MACD (Moving Average Convergence Divergence):
The MACD line is compared with its signal line to assess momentum. A bullish scenario is confirmed when the MACD line is above the signal line, while a bearish scenario is indicated when it is below, thus adding another layer of confirmation.
Awesome Oscillator (AO):
The AO measures the difference between short-term and long-term simple moving averages of the median price. Positive AO values support BUY signals, while negative values back SELL signals, offering additional momentum insight.
ADX (Average Directional Index):
The ADX quantifies trend strength. MTF Signal Xpert only considers signals when the ADX value exceeds a specified threshold, ensuring that trades are taken in strongly trending markets.
Optional Stochastic Oscillator:
An optional stochastic oscillator filter can be enabled to further refine signals. It checks for overbought conditions (supporting SELL signals) or oversold conditions (supporting BUY signals), thus reducing ambiguity.
Multi-Timeframe Verification
Higher Timeframe Filter:
To align short-term signals with broader market trends, the script calculates an EMA on a higher timeframe as specified by the user. This multi-timeframe approach helps ensure that signals on the primary chart are consistent with the overall trend, thereby reducing false signals.
Dynamic Risk Management with ATR
ATR-Based Calculations:
The Average True Range (ATR) is used to measure current market volatility. This value is multiplied by a user-defined factor to dynamically determine stop loss (SL) and take profit (TP) levels, adapting to changing market conditions.
Visual SL/TP Markers:
The calculated SL and TP levels are plotted on the chart as distinct colored dots, enabling traders to quickly identify recommended exit points.
Optional Trailing Stop:
An optional trailing stop feature is available, which adjusts the stop loss as the trade moves favorably, helping to lock in profits while protecting against sudden reversals.
Risk/Reward Ratio Calculation:
MTF Signal Xpert computes a risk/reward ratio based on the dynamic SL and TP levels. This quantitative measure allows traders to assess whether the potential reward justifies the risk associated with a trade.
Condition Weighting and Signal Scoring
Binary Condition Checks:
Each technical condition—ranging from moving average crossovers, Bollinger Band positioning, and RSI range to MACD, AO, ADX, and volume filters—is assigned a binary score (1 if met, 0 if not).
Cumulative Scoring:
These individual scores are summed to generate cumulative bullish and bearish scores, quantifying the overall strength of the signal and providing traders with an objective measure of its viability.
Detailed Signal Explanation:
A comprehensive explanation string is generated, outlining which conditions contributed to the current BUY or SELL signal. This explanation is displayed on an on‑chart dashboard, offering transparency and clarity into the signal generation process.
On-Chart Visualizations and Debug Information
Chart Elements:
The indicator plots all key components—moving averages, Bollinger Bands, SL and TP markers—directly on the chart, providing a clear visual framework for understanding market conditions.
Combined Dashboard:
A dedicated dashboard displays key metrics such as RSI, ADX, and the bullish/bearish scores, alongside a detailed explanation of the current signal. This consolidated view allows traders to quickly grasp the underlying logic.
Debug Table (Optional):
For advanced users, an optional debug table is available. This table breaks down each individual condition, indicating which criteria were met or not met, thus aiding in further analysis and strategy refinement.
Mashup Justification and Originality
MTF Signal Xpert is more than just an aggregation of existing indicators—it is an original synthesis designed to address real-world trading complexities. Here’s how its components work together:
Integrated Trend, Volatility, and Momentum Analysis:
By combining moving averages, Bollinger Bands, and multiple oscillators (RSI, MACD, AO, ADX, and an optional stochastic), the indicator captures diverse market dynamics. Each component reinforces the others, reducing noise and filtering out false signals.
Multi-Timeframe Analysis:
The inclusion of a higher timeframe filter aligns short-term signals with longer-term trends, enhancing overall reliability and reducing the potential for contradictory signals.
Adaptive Risk Management:
Dynamic stop loss and take profit levels, determined using ATR, ensure that the risk management strategy adapts to current market conditions. The optional trailing stop further refines this approach, protecting profits as the market evolves.
Quantitative Signal Scoring:
The condition weighting system provides an objective measure of signal strength, giving traders clear insight into how each technical component contributes to the final decision.
How to Use MTF Signal Xpert:
Input Customization:
Adjust the moving average type and period settings, ATR multipliers, and oscillator thresholds to align with your trading style and the specific market conditions.
Enable or disable the optional stochastic oscillator and trailing stop based on your preference.
Interpreting the Signals:
When a BUY or SELL signal appears, refer to the on‑chart dashboard, which displays key metrics (e.g., RSI, ADX, bullish/bearish scores) along with a detailed breakdown of the conditions that triggered the signal.
Review the SL and TP markers on the chart to understand the associated risk/reward setup.
Risk Management:
Use the dynamically calculated stop loss and take profit levels as guidelines for setting your exit points.
Evaluate the provided risk/reward ratio to ensure that the potential reward justifies the risk before entering a trade.
Debugging and Verification:
Advanced users can enable the debug table to see a condition-by-condition breakdown of the signal generation process, helping refine the strategy and deepen understanding of market dynamics.
Disclaimer:
MTF Signal Xpert is intended for educational and analytical purposes only. Although it is based on robust technical analysis methods and has undergone extensive backtesting, past performance is not indicative of future results. Traders should employ proper risk management and adjust the settings to suit their financial circumstances and risk tolerance.
MTF Signal Xpert represents a comprehensive, original approach to trading signal generation. By blending trend detection, volatility assessment, momentum analysis, multi-timeframe alignment, and adaptive risk management into one integrated system, it provides traders with actionable signals and the transparency needed to understand the logic behind them.

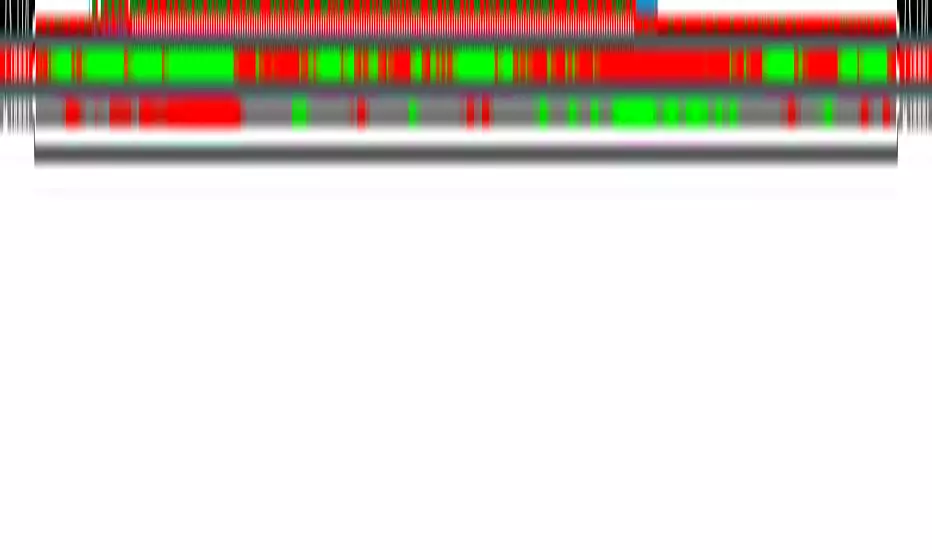
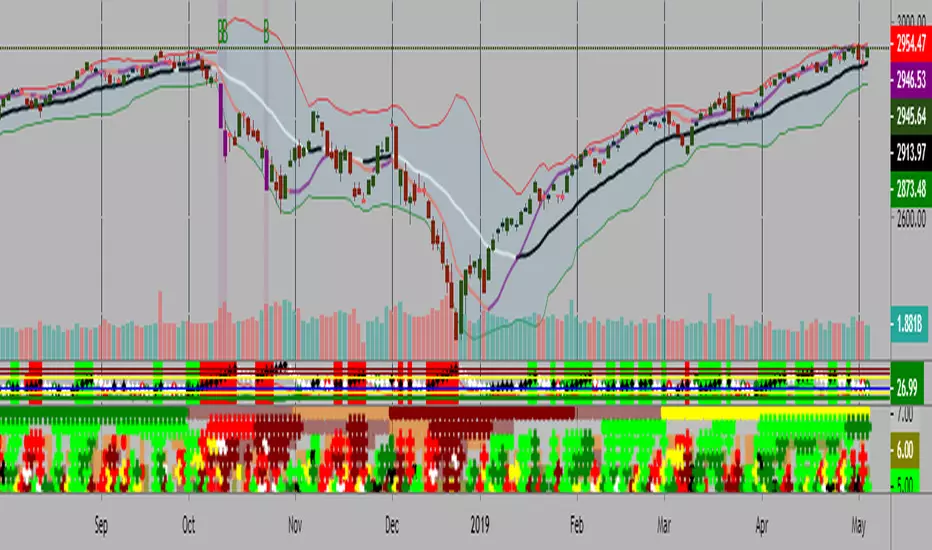
Kal’s MTF ADX Rangoli RollerKaly MTF ADX Rangoli Roller is a method/study for finding trending stocks, indexes and cryptocurrencies using two different data periods (10, 5) of ADX Overlap over different time-frames (10m, 1H, 4H, 1D, 1W, 1M). In the study, I used 5-Period ADX for all mentioned time-frames. You may use 10-Period ADX for lower time-frames especially 10m and 1H.
Sample Image of the pinescript code(at the end of this post) in Tradingview looks as follows:
Note: Kal's MTF ADX Rangoli Roller is the lower Plot. The upper plot is KAL’s ADX Overlap Technical Study with MACD Filter( )
Description:
----------------
In the study plot, the lowest row is 10m, row above is 1H, row above is 4H, then 1D, then 1W and highest row is 1M
Lime(Bright Green) dot implies Trending Uptrend for that time-frame (first phase)
Green dot implies Trending Uptrend for that time-frame (second phase near exhaustion)
Red dot implies Trending Downward for that time-frame (first phase)
Maroon dot implies Trending Downward for that time-frame (second phase near exhaustion)
Lime cross implies Strong Trending Uptrend for that time-frame (first phase)
Green cross implies Strong Trending Uptrend for that time-frame (second phase near exhaustion)
Red cross implies Trending Strong Downward for that time-frame (first phase)
Maroon cross implies Trending Strong Downward for that time-frame (second phase near exhaustion)
Yellow is ‘Squeeze On’ setting. During the squeeze period, the ADX signals are almost always ineffective. One may wait and watch over during this time. Once the Squeeze is released (i.e. no longer yellow), the trend corresponds to the color of the dots and crosses.
Black is CRSI Overbought condition for that time-frame. It’s best to wait and research for possibility of trend reversal because
1. Profit-booking/trimming happens after CRSI Overbought condition.
2. Large Short-sellers may take huge positions during this time pushing the stock prices up.
White is CRSI Oversold condition for that time-frame. It’s best to wait and research for possibility of trend reversal because
1. Profit-booking/trimming happens after CRSI Oversold conditions.
2. Large buyers may take huge positions during this time pushing the stock prices down.
I am a disabled man. Therefore, I am not able to write in detail here today. More Details will follow as time permits. Please let me know if I am missing anything…
Legal Disclaimer: I published here so I get replies from fellow viewers to educate myself and for my daily expenses. Hence, if anyone uses this script for making their decisions, I am not responsible for any failures incurred.
Safe Trading!
Kal Gandikota
PS: If you found this script interesting and edifying please follow and upvote.
PS2: Please kindly donate for my daily expenses (atleast as you would on streets) at the following addresses:
BTC Wallet: 1NeDC1GvpFa49DFLuT1v28ohFjqtoWXNQ5
ETH Wallet: 0x35e557F39A998e7d35dD27c6720C3553e1c65053
NEO Wallet: AUdiNJDW7boeUyYYNhX86p2T8eWwuELSGr
PS3: For more information on ADX and CRSI, please 'Google' or search here yourself.
PS4: This study is intended for research in creating automated Python Trading Systems using Pandas( steemit.com ).
Screenshots of the pinescript code looks as follows:
10minute Screenshot of Kal's MTF ADX Rangoli Roller (Above)
1 Hour Screenshot of Kal's MTF ADX Rangoli Roller (Above)
4 Hour Screenshot of Kal's MTF ADX Rangoli Roller (Above)
1 Day Screenshot of Kal's MTF ADX Rangoli Roller (Above)
1 Week Screenshot of Kal's MTF ADX Rangoli Roller (Above)
1 Month Screenshot of Kal's MTF ADX Rangoli Roller (Above)
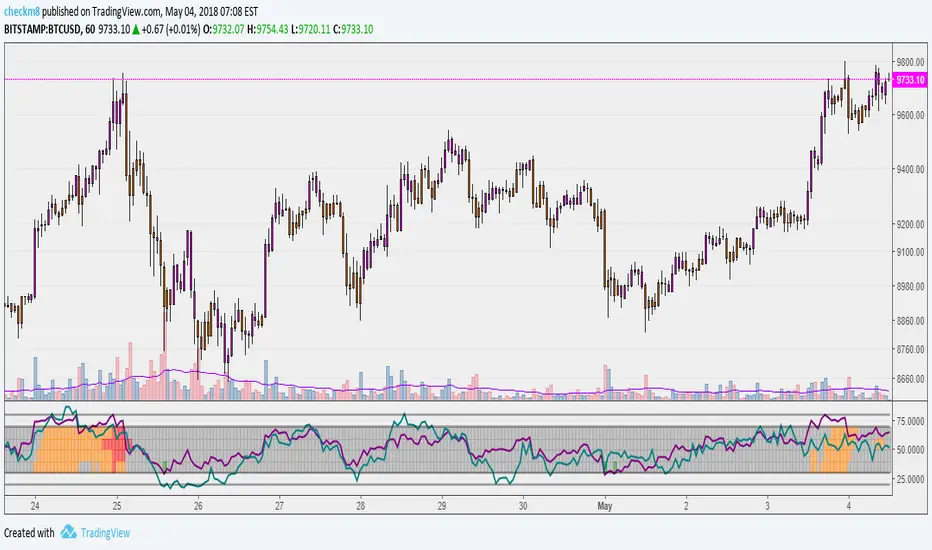
REDWOOD MTF MacD
This MTF MacD is a custom made indicator to show trends and potential trend changes.
As you see the MTF MacD is colored depending on the trend and if MacD is above or below the Signal.
This indicator shows the crossover or crossunder of these plots with the colored circles that
are plotted. This can be a very useful indicator to show you a start of a new trend or a trend that
is weak, giving you ideas of when to take profit or enter a new trade.
For more information on MacD in general (for reference) Please see the detailed
description here : www.investopedia.com
This MacD is a Multi Time frame MacD, meaning it can show you higher or lower timeframes of the MacD no matter what current time frame your chart is on. This is
applied in the settings of the indicator by default, with a default timeframe of 4hr.
You can easily change back to the current time frame by checking the box "Use Current MacD Timeframe?". This can be very useful to get into a trend early, entering or exiting on low time frame bars while seeing the live Long time frame MacD. This can help reassure a position if the asset dips, or see if the asset is having one last push up before the fall.
The inputs of Fast ema, Slow ema, signal length can be customized to your liking.
There are inputs that will remove the MacD & Signal crosses, the histogram, or the MacD in general, there are also inputs you can apply that shows when the macd is changing its trend and pivoting.
For trading with this indicator, it works very well with a indicator confirming the position or potential change that is happening, I recommend the RSI or StochRSI. Specifically, the REDWOOD MTF Stochastic RSI .
When MacD line crosses over the Signal (black) line and is showing the MacD line lime, with the Histogram showing aqua or light blue,
this is when to take a Long or buy position.
When MacD line crosses under the Signal (black) line and is showing the MacD line red, with the Histogram showing red, this is when to take a short or sell position.
To filter out false crosses or trades, this is where I recommend the MTF stoch or RSI, taking trades on the MacD when the Stoch or RSI is showing signs of overbought or oversold areas. These provide the strongest signals and buy and sell positions.
This is recommended as a swing indicator , but can be used for scalping at your own risk.
As for recommended time frames to use for the MTF settings, I would stick to longer timeframes to show the overall trend. With that being said, it can be used on shorter timeframes as well and works good. I would sick to the 1hr or 4hr timeframes, and for lower I recommend the 15min or 30min timeframes.
The lower you go the more signals will be provided, but with that lots more false signals will show as well if the asset is volatile.
All settings, colors, and plots can be customized, and all are labeled to make it easy for you.
Alerts for each setting will be added in the future for simplicity, as of now the alerts can be made as usual, having the indicator plot MacD crossing the indicator plot Signal, telling you of a change in the MacD.
This can be a very useful indicator, and I'm sure some may find settings that work even better than the default or recommended settings.
This indicator works on all markets, forex, cryptocurrency, and stocks.
For access to this and all indicators available, please DM me here or See profile.
We are here to help each other succeed! The more one succeeds the more we all succeed! We are all in this
together and every person deserves to be financially independent and confident when taking trades
and investing.

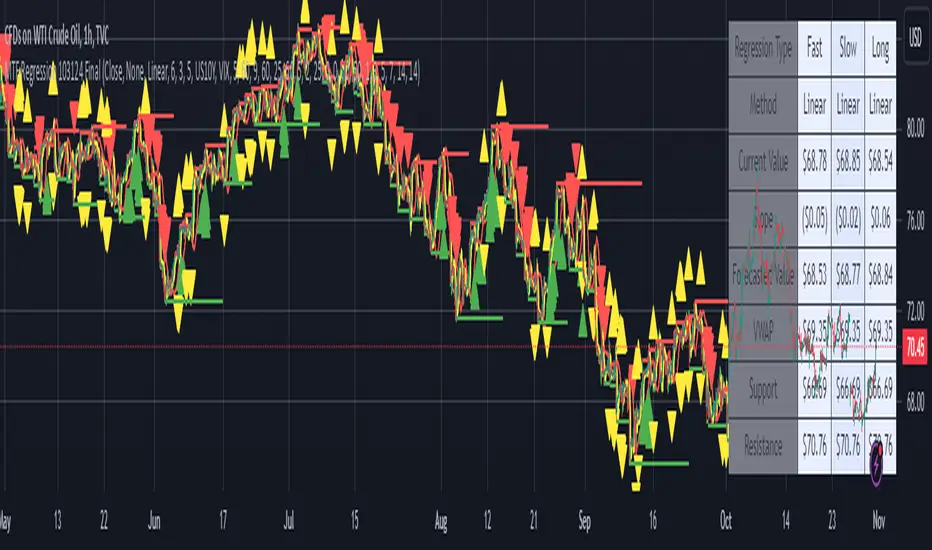
MTF Regression with Forecast### **MTF Regression with Forecast, Treasury Yield, Additional Variable & VWAP Filter - Enhanced with Long Regression**
Unlock advanced market insights with our **MTF Regression** indicator, meticulously designed for traders seeking comprehensive multi-timeframe analysis combined with powerful forecasting tools. Whether you're a seasoned trader or just starting out, this indicator offers a suite of features to enhance your trading strategy.
#### **🔍 Key Features:**
- **Multi-Timeframe (MTF) Regression:**
- **Fast, Slow, & Long Regressions:** Analyze price trends across multiple timeframes to capture both short-term movements and long-term trends.
- **Customizable Price Inputs:**
- **Flexible Price Selection:** Choose between Close, Open, High, or Low prices to suit your trading style.
- **Price Transformation:** Option to apply Exponential Moving Averages (EMA) for smoother trend analysis.
- **Diverse Regression Methods:**
- **Multiple Algorithms:** Select from Linear, Exponential, Hull Moving Average (HMA), Weighted Moving Average (WMA), or Spline regressions to best fit your analysis needs.
- **Integrated External Data:**
- **10-Year Treasury Yield:** Incorporate macroeconomic indicators to refine regression accuracy.
- **Additional Variables:** Enhance your analysis by integrating data from other tickers (e.g., NASDAQ:AAPL).
- **Advanced Filtering Options:**
- **VWAP Filter:** Align signals with the Volume Weighted Average Price for improved trade entries.
- **Price Action Filter:** Ensure price behavior supports the generated signals for higher reliability.
- **Enhanced Signal Generation:**
- **Bullish & Bearish Signals:** Identify potential trend reversals and continuations with clear visual cues.
- **Predictive Signals:** Forecast future price movements with forward-looking arrows based on regression slopes.
- **Slope & Acceleration Thresholds:** Customize minimum slope and acceleration levels to fine-tune signal sensitivity.
- **Forecasting Capabilities:**
- **Projection Lines:** Visualize future price trends by extending regression lines based on current slope data.
- **User-Friendly Interface:**
- **Organized Settings Groups:** Easily navigate through price inputs, regression settings, integration options, and more.
- **Customizable Alerts:** Stay informed with configurable alerts for bullish, bearish, and predictive signals.
#### **📈 Why Choose MTF Regression Indicator?**
- **Comprehensive Analysis:** Combines multiple regression techniques and external data sources for a well-rounded market view.
- **Flexibility:** Highly customizable to fit various trading strategies and preferences.
- **Enhanced Decision-Making:** Provides clear signals and forecasts to support informed trading decisions.
- **Efficiency:** Optimized to deliver reliable performance without overloading your trading platform.
Elevate your trading game with the **MTF Regression with Forecast, Treasury Yield, Additional Variable & VWAP Filter** indicator. Harness the power of multi-timeframe analysis and predictive forecasting to stay ahead in the dynamic markets.
---
*Feel free to reach out for more information or support. Happy Trading!*
MTF MACD + RSI (Nikko) v1 for friendsMTF MACD + RSI (Nikko) v1 friends only
🧠 MTF MACD + RSI (Nikko) v1
A professional 2-in-1 Pine Script indicator that merges two powerful systems:
MTF MACD (Multi-Timeframe MACD) — Momentum and trend analyzer
RSI Divergence (Nikko) — Reversal and divergence detector
Easily switch between them with a simple toggle in the indicator settings.
⚙️ Overview
This script provides two distinct analysis modes inside a single indicator:
MTF MACD Mode → Focuses on multi-timeframe trend confirmation and momentum strength.
RSI Divergence Mode → Focuses on reversal detection using RSI and price divergence.
A color-coded label in the indicator pane shows which mode is active:
🔴 MACD Mode
🟢 RSI Mode

MTF Target Prediction LiteMTF Target Prediction Enhanced Lite
Description:
MTF Target Prediction Enhanced is an advanced multi-timeframe technical analysis indicator that identifies and clusters target price levels based on trendline breakouts across multiple timeframes. The indicator uses sophisticated clustering algorithms to group similar price targets and provides visual feedback through dynamic arrows, cluster boxes, and detailed statistics.
Key Features:
Multi-Timeframe Analysis: Simultaneously analyzes up to 8 different timeframes to identify convergence zones
Smart Clustering: Groups nearby target prices into clusters with quality scoring
Predictive Arrows: Dynamic arrows that track price movement toward cluster targets
Grace Period System: Prevents false cluster loss signals with configurable waiting period
Enhanced Quality Scoring: 5-component quality assessment (Density, Consistency, Reachability, Size, Momentum)
Real-time Statistics: Track performance with win rate, P&L, and success metrics
Adaptive Performance Modes: Optimize for speed or accuracy based on your needs
How It Works:
The indicator identifies pivot points and trendlines on each selected timeframe
When a trendline breakout occurs, it calculates a target price based on the measured move
Multiple targets from different timeframes are grouped into clusters when they converge
Each cluster receives a quality score based on multiple factors
High-quality clusters generate prediction arrows showing potential price targets
The system tracks whether targets are reached or clusters are lost
Settings Guide:
⚡ Performance
Performance Mode: Choose between Fast (200 bars), Balanced (500 bars), Full (1000 bars), or Unlimited processing
🎯 Clustering
Max Cluster Distance (%): Maximum price difference to group targets (default: 1.5%)
Min Cluster Size: Minimum number of targets to form a cluster (default: 2)
One Direction per TF: Allow only one direction signal per timeframe
Cluster Grace Period: Bars to wait before considering cluster lost (default: 10)
➡️ Prediction Arrows
Min Quality for Arrow: Minimum cluster quality to create arrow (0.1-1.0)
Quality Weights: Adjust importance of each quality component
Close Previous Arrows: Auto-close arrows when new ones appear
Use Trend Filter: Create arrows only in trend direction
Trend Filter Intensity: Sensitivity of trend detection (High/Medium/Low)
📅 Timeframes
Pivot Length: Bars for pivot calculation (default: 3)
Timeframes 1-8: Select up to 8 timeframes for analysis
Visualize
Show Cluster Analysis: Display cluster boxes and labels
Show Cluster Boxes: Rectangle visualization around clusters
Show TP Lines: Display individual target price lines
Show Trend Filter: Visualize trend cloud
Show Prediction Arrows: Display directional arrows to targets
Show Statistics Table: Performance metrics display
Visual Elements:
Green/Red Boxes: Cluster zones with transparency based on quality
Arrows: Diagonal lines pointing to cluster targets
Green/Red: Active and tracking
Orange: In grace period
Gray: Cluster lost
Labels: Detailed cluster information including:
Timeframes involved
Center price (C)
Quality score (Q)
Component scores (D,C,R,S,M)
Distance from current price
Result Markers:
✓ Green: Target reached successfully
✗ Red/Gray: Cluster lost
Quality Components Explained:
D (Density): How tightly packed the TPs are relative to ATR
C (Consistency): How close the timeframes are to each other
R (Reachability): Likelihood of reaching target based on distance and trend
S (Size): Number of TPs in cluster (with diminishing returns)
M (Momentum): Alignment with current price momentum
Best Practices:
Start with Balanced performance mode and default settings
Use higher timeframes (D, W) for more reliable clusters
Look for clusters with quality scores above 0.7
Enable trend filter to reduce false signals
Adjust grace period based on your timeframe (higher TF = longer grace)
Monitor the statistics table to track indicator performance
Alerts Available:
High-quality cluster formation (UP/DOWN)
Target reached notifications
Cluster lost warnings
------------------------------------------------------------------------------------------------------------------
MTF Target Prediction Enhanced Lite
Описание:
MTF Target Prediction Enhanced - это продвинутый мультитаймфреймовый индикатор технического анализа, который идентифицирует и кластеризует целевые уровни цен на основе пробоев трендовых линий на нескольких таймфреймах. Индикатор использует сложные алгоритмы кластеризации для группировки схожих ценовых целей и предоставляет визуальную обратную связь через динамические стрелки, кластерные боксы и детальную статистику.
Ключевые особенности:
Мультитаймфреймовый анализ: Одновременный анализ до 8 различных таймфреймов для определения зон схождения
Умная кластеризация: Группировка близких целевых цен в кластеры с оценкой качества
Прогнозные стрелки: Динамические стрелки, отслеживающие движение цены к целям кластера
Система Grace Period: Предотвращение ложных сигналов потери кластера с настраиваемым периодом ожидания
Улучшенная оценка качества: 5-компонентная оценка (Плотность, Согласованность, Достижимость, Размер, Импульс)
Статистика в реальном времени: Отслеживание эффективности с винрейтом, P&L и метриками успеха
Адаптивные режимы производительности: Оптимизация скорости или точности по вашим потребностям
Как это работает:
Индикатор определяет опорные точки и трендовые линии на каждом выбранном таймфрейме
При пробое трендовой линии рассчитывается целевая цена на основе измеренного движения
Множественные цели с разных таймфреймов группируются в кластеры при схождении
Каждый кластер получает оценку качества на основе нескольких факторов
Высококачественные кластеры генерируют стрелки прогноза, показывающие потенциальные цели
Система отслеживает достижение целей или потерю кластеров
Руководство по настройкам:
⚡ Производительность
Performance Mode: Выбор между Fast (200 баров), Balanced (500), Full (1000) или Unlimited
🎯 Кластеризация
Max Cluster Distance (%): Максимальная разница цен для группировки (по умолчанию: 1.5%)
Min Cluster Size: Минимальное количество целей для формирования кластера (по умолчанию: 2)
One Direction per TF: Разрешить только один сигнал направления на таймфрейм
Cluster Grace Period: Бары ожидания перед потерей кластера (по умолчанию: 10)
➡️ Стрелки прогноза
Min Quality for Arrow: Минимальное качество кластера для создания стрелки (0.1-1.0)
Quality Weights: Настройка важности каждого компонента качества
Close Previous Arrows: Автозакрытие стрелок при появлении новых
Use Trend Filter: Создавать стрелки только в направлении тренда
Trend Filter Intensity: Чувствительность определения тренда (Высокая/Средняя/Низкая)
📅 Таймфреймы
Pivot Length: Бары для расчета пивота (по умолчанию: 3)
Timeframes 1-8: Выбор до 8 таймфреймов для анализа
Визуализация
Show Cluster Analysis: Отображение боксов и меток кластеров
Show Cluster Boxes: Визуализация прямоугольников вокруг кластеров
Show TP Lines: Отображение линий целевых цен
Show Trend Filter: Визуализация облака тренда
Show Prediction Arrows: Отображение направленных стрелок к целям
Show Statistics Table: Отображение метрик эффективности
Визуальные элементы:
Зеленые/Красные боксы: Зоны кластеров с прозрачностью на основе качества
Стрелки: Диагональные линии, указывающие на цели кластера
Зеленые/Красные: Активные и отслеживающие
Оранжевые: В периоде ожидания
Серые: Кластер потерян
Метки: Детальная информация о кластере:
Задействованные таймфреймы
Центральная цена (C)
Оценка качества (Q)
Оценки компонентов (D,C,R,S,M)
Расстояние от текущей цены
Маркеры результата:
✓ Зеленый: Цель успешно достигнута
✗ Красный/Серый: Кластер потерян
Объяснение компонентов качества:
D (Density/Плотность): Насколько плотно расположены TP относительно ATR
C (Consistency/Согласованность): Насколько близки таймфреймы друг к другу
R (Reachability/Достижимость): Вероятность достижения цели с учетом расстояния и тренда
S (Size/Размер): Количество TP в кластере (с убывающей отдачей)
M (Momentum/Импульс): Соответствие текущему импульсу цены
Лучшие практики:
Начните с режима Balanced и настроек по умолчанию
Используйте старшие таймфреймы (D, W) для более надежных кластеров
Ищите кластеры с оценкой качества выше 0.7
Включите фильтр тренда для уменьшения ложных сигналов
Настройте grace period в зависимости от вашего таймфрейма (старший TF = дольше grace)
Следите за таблицей статистики для отслеживания эффективности индикатора
Доступные алерты:
Формирование высококачественного кластера (ВВЕРХ/ВНИЗ)
Уведомления о достижении цели
Предупреждения о потере кластера
Disclaimer / Отказ от ответственности:
This indicator is for educational and informational purposes only. Past performance does not guarantee future results. Always conduct your own analysis and risk management.
Данный индикатор предназначен только для образовательных и информационных целей. Прошлые результаты не гарантируют будущих результатов. Всегда проводите собственный анализ и управление рисками.

MTF RSI MA System + Adaptive BandsMTF RSI MA System + Adaptive Bands
Overview
MTF RSI MA System + Adaptive Bands is a highly customizable Pine Script indicator for traders seeking a versatile tool for multi-timeframe (MTF) analysis. Unlike traditional RSI, it focuses on the Moving Average of RSI (RSI MA), delivering smoother and more flexible trading signals. The main screenshot displays the indicator in two panels to showcase its diverse capabilities.
Important: Timeframes do not adjust automatically – users must manually set them to match the chart’s timeframe.
Features
Core Component: Built around RSI MA, not raw RSI, for smoother trend signals.
Multi-Timeframe: Analyze RSI MA across three customizable timeframes (default: 4H, 8H, 12H).
Adaptive Bands: Three band calculation methods (Fixed, Percent, StdDev) for dynamic signals.
Flexible Signals: Generated via RSI MA crossovers, band interactions, or directional alignment across timeframes.
Background Coloring: Highlights when RSI MAs across timeframes move in the same direction, aiding trend confirmation.
Screenshot Panels Configuration
Upper Panel: Shows RSI, RSI MA, and fixed bands for reversal strategies (RSI crossing bands).
Lower Panel: Displays three RSI MAs (Alligator-style) for trend-following, with background coloring for directional alignment.
Band Calculation Methods
The indicator offers three ways to calculate bands around RSI MA, each with unique characteristics:
Fixed Bands
Set at a fixed point value (default: 10) above and below RSI MA.
Example: If RSI MA = 50, band value = 10 → upper band = 60, lower = 40.
Use Case: Best for stable markets or fixed-range preferences.
Tip: Adjust the band value to widen or narrow the range based on asset volatility.
Percent Bands
Calculated as a percentage of RSI MA (default: 10%).
Example: If RSI MA = 50, band value = 10% → upper band = 55, lower = 45.
Use Case: Ideal for assets with varying volatility, as bands scale with RSI MA.
Tip: Experiment with percentage values to match typical price swings.
Standard Deviation Bands (StdDev)
Based on RSI’s standard deviation over the MA period, multiplied by a user-defined factor (default: 10).
Example: If RSI MA = 50, standard deviation = 5, factor = 2 → upper band = 60, lower = 40.
Important: The default value (10) may produce wide bands. Reduce to 1–2 for tighter, practical bands.
Use Case: Best for dynamic markets with fluctuating volatility.
Configuration Options
RSI Length: Set RSI calculation period (default: 20).
MA Length: Set RSI MA period (default: 20).
MA Type: Choose SMA or EMA for RSI MA (default: EMA).
Timeframes: Configure three timeframes (default: 4H, 8H, 12H) for MTF analysis.
Overbought/Oversold Levels: Optionally display fixed levels (default: 70/30).
Background Coloring: Enable/disable for each timeframe to highlight directional alignment.
How to Use
Add Indicator: Load it onto your TradingView chart.
Setup:
Reversals: Configure like the upper panel (RSI, RSI MA, bands) and watch for RSI crossing bands.
Trends: Configure like the lower panel (three RSI MAs) and look for fastest MA crossovers and background coloring.
Adjust Timeframes: Manually set tf1, tf2, tf3 (e.g., 1H, 2H, 4H on a 1H chart) to suit your strategy.
Adjust Bands: Choose band type (Fixed, Percent, StdDev) and value. For StdDev, reduce to 1–2 for tighter bands.
Experiment: Test settings to match your trading style, whether scalping, swing trading, or long-term.
Notes
Timeframes: Always match tf1, tf2, tf3 to your chart’s needs, as they don’t auto-adjust.
StdDev Bands: Lower the default value (10) to avoid overly wide bands.
Versatility: Works across markets (stocks, forex, crypto).

MTF Fibonacci Pivots with Mandelbrot FractalsMTF Fibonacci Pivots with Mandelbrot Fractals: Advanced Market Structure Analysis
Overview
The MTF Fibonacci Pivots with Mandelbrot Fractals indicator represents a significant advancement in technical analysis by combining multi-timeframe Fibonacci pivot levels with sophisticated fractal pattern recognition. This powerful tool identifies key support and resistance zones while predicting potential price reversals with remarkable accuracy.
Key Capabilities
This indicator provides traders with three distinct layers of market structure analysis:
Automatic Timeframe Adaptation: The primary pivot set automatically adjusts to your chart's timeframe, ensuring relevant support and resistance levels for your specific trading horizon.
1-Year Fibonacci Pivots: The second layer displays yearly pivots that reveal long-term market cycles and institutional price levels that often act as significant reversal points.
3-Year Fibonacci Pivots: The third layer unveils major market structure zones that typically remain relevant for extended periods, offering strategic context for position trading and long-term investment decisions.
Predictive Technology
What truly distinguishes this indicator is its advanced predictive capability powered by:
Mandelbrot Fractal Pattern Recognition: The indicator implements a sophisticated fractal detection algorithm that identifies recurring price patterns across multiple timeframes. Unlike conventional fractal indicators, it incorporates noise filtering and adaptive sensitivity to market volatility.
Tesla's 3-6-9 Principle Integration: The system incorporates Nikola Tesla's mathematical principle through a cubic Mandelbrot equation (Z_{n+1} = Z_n^3 + C where Z_0 = 0), creating a unique approach to pattern recognition that aligns with natural market rhythms.
Historical Pattern Matching: When a current price pattern exhibits strong similarity to historical formations, the indicator generates predictive targets with confidence ratings. Each prediction undergoes rigorous validation against multiple parameters including trend alignment, volatility context, and mathematical coherence.
Visual Intelligence System
The indicator's visual presentation enhances trading decision-making through:
Confidence-Based Visualization: Predictions display with intuitive star ratings, percentage confidence scores, and contextual information including price movement magnitude and estimated time to target.
Adaptive Color Harmonization: The color system intelligently adjusts to provide optimal visibility while maintaining a professional appearance suitable for any chart setup.
Trend Alignment Indicators: Each prediction includes references to the broader trend context, helping traders avoid counter-trend trades unless the reversal signal carries exceptional strength.
Strategic Applications
This indicator excels in multiple trading scenarios:
Intraday Trading: Identify high-probability reversal zones with precise timing
Swing Trading: Anticipate significant market turns at key structural levels
Position Trading: Recognize major cycle shifts for strategic entry and exit
The automatic 1-year and 3-year Fibonacci pivots provide institutional-grade reference points that typically define major market movements. These longer timeframes reveal critical zones that might be invisible on shorter-term analysis, giving you a significant edge in understanding where price is likely to encounter substantial buying or selling pressure.
This innovative approach to market analysis combines classical Fibonacci mathematics with cutting-edge fractal theory to create a comprehensive market structure visualization system that illuminates both present support/resistance levels and future price targets with exceptional clarity.
Setting Up MTF Fibonacci Pivots with Mandelbrot Fractals
Initial Setup
Adding this indicator to your TradingView charts is straightforward:
Navigate to the "Indicators" button on your chart toolbar
Search for "MTF Fibonacci Pivots with Mandelbrot Fractals"
Select the indicator to add it to your chart
A configuration panel will appear with various setting categories
Recommended Settings
The indicator comes pre-configured with optimal default settings, but you may want to adjust them based on your trading style:
For Day Trading (Timeframes 1-minute to 1-hour)
Pivots Timeframe 1: Auto (automatically adapts to your chart)
Pivots Timeframe 2: Daily
Pivots Timeframe 3: Weekly
Fractal Sensitivity: 2-3
Fractal Lookback Period: 20
Prediction Strength: 2
Color Theme: High Contrast or Dark Mode
For Swing Trading (Timeframes 4-hour to Daily)
Pivots Timeframe 1: Daily
Pivots Timeframe 2: Weekly
Pivots Timeframe 3: Monthly
Fractal Sensitivity: 1-2
Fractal Lookback Period: 30
Prediction Strength: 2-3
Color Theme: Default or Dimmed
For Position Trading (Timeframes Daily to Weekly)
Pivots Timeframe 1: Weekly
Pivots Timeframe 2: Monthly
Pivots Timeframe 3: Quarterly
Fractal Sensitivity: 1
Fractal Lookback Period: 50
Prediction Strength: 1
Color Theme: Monochrome or Pastel
Restoring Default Settings
If you've adjusted settings and wish to return to the defaults:
Right-click on the indicator name on your chart
Select "Settings" from the context menu
In the settings dialog, look for the "Reset All" button at the bottom
Confirm the reset when prompted
Alternatively, you can remove the indicator and add it again for a fresh start with default settings.
Advanced Settings Guidance
Visual Appearance
Use Gradient Colors: Enable for better visual differentiation between pivot levels
Color Transparency: 15% provides an optimal balance between visibility and chart clutter
Line Width: 1-2 for cleaner charts, 3+ for enhanced visibility
Fractal Analysis
Enable Fractal Analysis: Keep enabled for prediction capabilities
Fractal Box Spacing: Higher values (5-10) for cleaner displays, lower values (1-3) for more signals
Maximum Forecast Bars: 20 is optimal for most timeframes, adjust higher for longer predictions
Performance Considerations
Enable Self-Optimization: Keep enabled to maintain smooth chart performance
Resource Priority: Use "Balanced" for most computers, "Performance" for older systems
Force Pivot Display: Enable only when checking specific historical periods
Common Setup Mistakes to Avoid
Setting all timeframes too close together (e.g., Daily, Daily, Weekly) reduces the multi-timeframe advantage
Using high fractal sensitivity (4+) on noisy markets creates excessive signals
Setting fractal box spacing too low causes cluttered prediction boxes
Disabling self-optimization may cause performance issues on complex charts
Using incompatible color themes for your chart background reduces visibility
The indicator's power comes from its default 1-year and 3-year Fibonacci pivot settings, which highlight institutional levels while the auto-timeframe setting adapts to your trading horizon. These carefully balanced defaults provide an excellent starting point for most traders.
For optimal results, I recommend making minimal adjustments at first, then gradually customizing settings as you become familiar with the indicator's behavior in your specific markets and timeframes.
Screenshots:

MTF Candle Multi HubMTF Candle Multi Hub Indicator - Guide 日本語解説は下記
Introduction
The "MTF Candle Multi Hub" indicator is a versatile and comprehensive tool designed to visualize multiple timeframes' candlestick data, Heikin Ashi candles, and moving averages on a single chart. This indicator also includes a Zigzag feature with the ability to draw horizontal lines at significant swing points, making it a powerful tool for technical analysis.
Key Features
Multi-Timeframe Candlestick Display:
The indicator allows you to display candlesticks from different timeframes, including 5-minute, 15-minute, 1-hour, 4-hour, daily, and weekly timeframes.
Each timeframe's candlestick can be toggled on or off using the settings panel.
Candlesticks are color-coded based on whether the close is higher or lower than the open, with customizable colors for bullish and bearish candles.
Heikin Ashi Candlesticks:
Heikin Ashi candlesticks are also available for 5-minute, 15-minute, 1-hour, 4-hour, daily, and weekly timeframes.
Like the standard candlesticks, these can be toggled on or off, and their colors are customizable.
Moving Averages (MA):
The indicator supports up to four different moving averages, which can be either Simple Moving Average (SMA) or Exponential Moving Average (EMA).
The user can toggle each moving average on or off and adjust the period and type from the settings panel.
An additional feature allows the space between two moving averages to be filled with a color, indicating the relative position of the MAs.
Zigzag Indicator with Horizontal Lines:
The Zigzag feature plots lines between significant swing highs and lows, helping identify trends and potential reversal points.
Two Zigzag lines can be configured, each with customizable swing length, line color, style, and width.
The indicator also offers the ability to draw horizontal lines at the start and end of each Zigzag swing. These horizontal lines can be customized in terms of color, style, width, and length.
The number of horizontal lines to be drawn can be set, allowing for focused analysis of the most recent swings.
Label and Comment Display:
The indicator provides the option to display custom labels and comments on the chart.
You can enter up to ten different comments, which will be displayed in a label at the last candlestick of the chart.
The label's position, background color, text color, and text size are fully customizable.
Trading Strategy
Trend Following with Multi-Timeframe Analysis:
Use the multi-timeframe candlestick and Heikin Ashi features to assess the trend across different timeframes. For example, if both the daily and 4-hour Heikin Ashi candles are bullish, it may indicate a strong uptrend.
Entry and Exit Signals:
Use the Zigzag indicator to identify potential entry points by looking for a new swing high or low.
Horizontal lines from the Zigzag can be used as support and resistance levels, helping to determine potential entry and exit points.
Moving Average Crossovers:
Monitor the crossovers of the moving averages. For example, when a shorter-term MA crosses above a longer-term MA, it may signal a potential buy opportunity.
Confluence of Signals:
The best trading opportunities may arise when multiple signals align. For example, a bullish Zigzag swing, supported by bullish Heikin Ashi candles and a moving average crossover, could provide a strong buy signal.
Disclaimer
For Educational Purposes Only: This indicator is provided for educational purposes and should not be used as the sole basis for any trading decisions.
No Guarantees: The indicator is provided "as is" without any guarantees of accuracy or completeness. Market conditions can change rapidly, and this indicator may not always reflect the most accurate market state.
Test Thoroughly: Bugs may exist in the script. It is highly recommended to test this script on a demo account before using it in live trading.
Use with Caution: Always use this indicator in conjunction with other analysis tools. Do not rely solely on this indicator for making trading decisions.
Sudden Changes or Removal: The indicator may be subject to sudden changes or removal without prior notice. The developer is not responsible for any issues this may cause.
By using this indicator, you agree to these terms.
MTF Candle Multi Hub インジケーター - ガイド
はじめに
「MTF Candle Multi Hub」インジケーターは、複数の時間枠のローソク足データ、平均足、移動平均線を1つのチャート上で視覚化するために設計された多用途かつ包括的なツールです。このインジケーターには、水平線を描画する機能を備えたジグザグ機能も含まれており、テクニカル分析において強力なツールとなります。
主な機能
マルチタイムフレームのローソク足表示:
5分足、15分足、1時間足、4時間足、日足、週足のローソク足を表示することができます。
各時間枠のローソク足は設定パネルでオンまたはオフに切り替えることができます。
ローソク足は、終値が始値より高いか低いかに基づいて色分けされており、強気と弱気のローソク足の色をカスタマイズできます。
平均足ローソク足:
5分足、15分足、1時間足、4時間足、日足、週足の平均足ローソク足を表示することができます。
標準のローソク足と同様に、これらをオンまたはオフに切り替え、色をカスタマイズすることが可能です。
移動平均線(MA):
このインジケーターは、単純移動平均線(SMA)または指数移動平均線(EMA)のいずれかを選択できる4つの移動平均線をサポートしています。
各移動平均線をオンまたはオフに切り替え、期間やタイプを設定パネルから調整できます。
また、2本の移動平均線の間に色を塗ることで、MAの相対的な位置を視覚的に表示する機能もあります。
ジグザグインジケーターと水平線:
ジグザグ機能は、重要なスイングの高値と安値の間に線を引き、トレンドや潜在的な反転ポイントを識別するのに役立ちます。
2本のジグザグラインを設定することができ、それぞれのスイングの長さ、線の色、スタイル、幅をカスタマイズできます。
また、ジグザグのスイングの始点と終点に水平線を描画する機能も提供されています。これらの水平線は、色、スタイル、幅、長さをカスタマイズできます。
描画する水平線の本数を設定でき、最新のスイングに焦点を当てた分析が可能です。
ラベルとコメントの表示:
インジケーターは、チャート上にカスタムラベルとコメントを表示するオプションを提供します。
最大10個の異なるコメントを入力することができ、これらはチャートの最新のローソク足にラベルとして表示されます。
ラベルの位置、背景色、テキストの色、テキストのサイズは完全にカスタマイズ可能です。
トレード戦略
マルチタイムフレーム分析を使用したトレンドフォロー:
マルチタイムフレームのローソク足や平均足の機能を使用して、異なる時間枠でのトレンドを評価します。例えば、日足と4時間足の平均足が共に強気であれば、強い上昇トレンドを示している可能性があります。
エントリーとエグジットシグナル:
ジグザグインジケーターを使用して、新たなスイング高値または安値を確認し、エントリーポイントを見極めます。
ジグザグの水平線をサポートおよびレジスタンスレベルとして使用し、エントリーやエグジットのタイミングを判断します。
移動平均線のクロスオーバー:
移動平均線のクロスオーバーを監視します。例えば、短期の移動平均線が長期の移動平均線を上抜けた場合、買いのシグナルとなる可能性があります。
シグナルのコンフルエンス:
複数のシグナルが一致する場合、最も良いトレード機会が生まれるかもしれません。例えば、強気のジグザグスイング、強気の平均足、移動平均線のクロスオーバーが揃うと、強力な買いシグナルとなる可能性があります。
免責事項
教育目的のみ: このインジケーターは教育目的で提供されており、トレードの決定を行う際の唯一の基準として使用すべきではありません。
保証なし: インジケーターは「現状のまま」提供されており、その正確性や完全性についての保証はありません。市場の状況は急速に変化する可能性があり、このインジケーターが常に最も正確な市場状況を反映するとは限りません。
十分なテストを: このスクリプトにはバグが存在する可能性があります。実際のトレードで使用する前に、デモ口座で十分にテストすることを強くお勧めします。
慎重に使用: このインジケーターを他の分析ツールと併用して使用してください。このインジケーターだけに頼ってトレードの決定を行うべきではありません。
突然の変更や削除の可能性: このインジケーターは予告なく変更や削除が行われる場合があります。そのため、利用者に不利益が生じる可能性がありますが、開発者はその責任を負いません。
このインジケーターを使用することで、これらの条件に同意したものとみなされます。

MTF MA (yasujiy)"MTF MA" is Multiple Time Frame Moving Average looks like MT4 indicator.
You can choose MTF, Source, Length, Offset and Smoothing method.
"MTF MA"は複数時間枠に対応した移動平均でMT4の指標と同じ使い勝手になっています。
パラメータは、MTF時間枠、四本値、期間、オフセット、平均の種類を変えることができます。

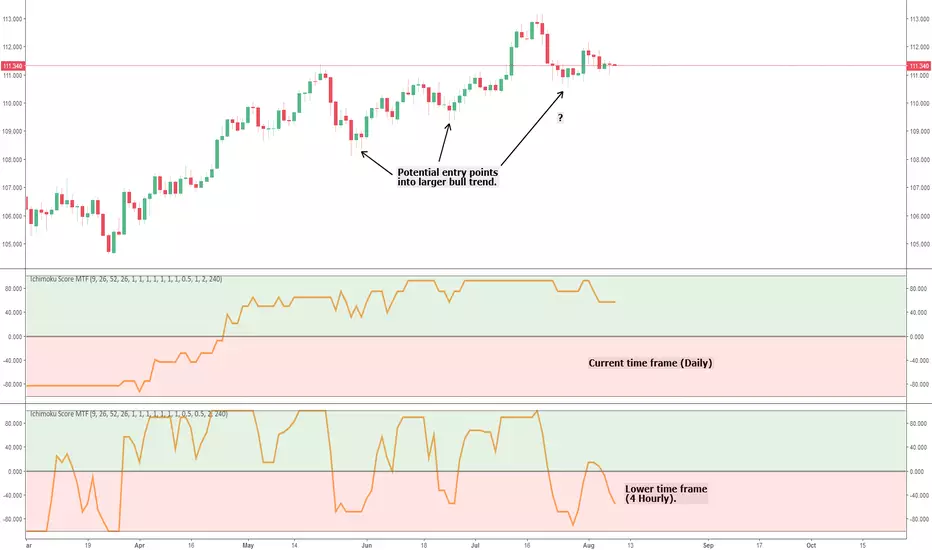
Ichimoku Cloud Score MTFThis is a simple multi time frame (MTF) conversion of the Ichimoku Cloud Score indicator.
All credit goes to the following users for the initial implementations:
- User @dashed :
- User @sjb933 :
This script calculates the Cloud Score based on the sjb933 version; all I've done is convert the script to Pinescript version 3 (to ensure the security function works as intended) and add MTF capability.
I'm a big fan of MTF analysis when using indicators (particularly oscillators). Using a higher time frame runs into the issue of the indicator repainting until the relevant higher time frame candle closes (this is inevitable and logical - so don't comment saying it repaints!). However, for lagging indicators such as this one, adding a lower time frame provides potential entry and exit signals into the larger trend, and also provides early warning of large trend shifts before the current time frame will. This can give you more control over your trades, and in my experience helps lagging indicators such as Ichimoku stay relevant in high volatility markets that are vastly different from when the indicators were conceived.
Any queries please let me know.
Cheers,
RJR