{CDT} v1.0 - MTF Fibonacci RSIMulti Timeframe Fibonacci RSI.... **HIGHLY EXPERIMENTAL**
To show retracement potential, squeeze's, support and resistance, overbought and oversold levels... super filtered too... a new RSI! Regular RSI shown on the chart for comparison.
* This is a crazy indicator that is still under development so use at your own risk, i'm putting this out here because i'd like feedback and its been a good leading indicator so far.
Cerca negli script per "mtf"

RSI/Stoch/SRSI MTF COMBOThis combo-indicator is based on @ChrisMoody 's RSI and Stoch MTF original scripts.
It gives traders the possibility to overlay RSI, Stochastic and SRSI as well as to see how each element is behaving on a higher/lower TF.
RSI, Stoch and SRSI can be individually configured as well as turned on/off by the user.
Overbought/Oversold and Middle lines are available but only the formers can be configured by the user - Middle Line is fixed at 50.
This indicator is open source and free to use. Feel free to change it around to suit your needs.
***If you copy & paste the script, please remember to credit Chris Moody for his amazing work.***
Happy trading!

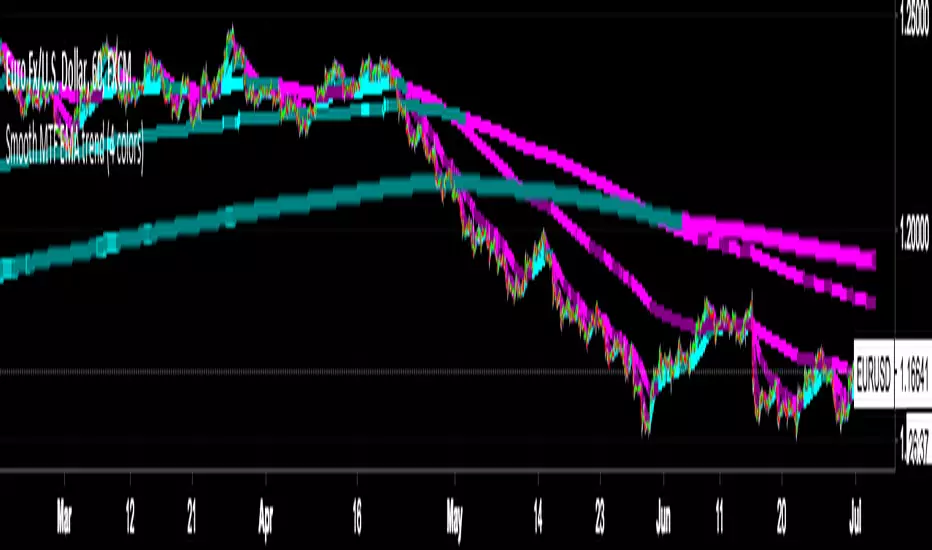
Smooth MTF EMA trend (4 colors)It's EMA20 on multi-timeframe but the line is smoother than original MTF line.
Support timeframe is: 1m 5m 15m 30m 1h 4h 1d 3d 1w.
Trend color:
strong up > aqua
weak up > teal
strong down > fuchsia
weak down > purple

STOCH MTF with Moving AverageBasic STOCH indicator with MTF support with moving average
USE EMA Cross with Stoch for buy / sell signal

RSI MTF with Moving AverageClassic RSI with MTF combined with its moving average (i reused a function to allow you to select any of them you want) for additional signals.
Indicator is based on this source: medium.com

2xRSI 2xEMA MTFThis is an MTF indicator with:
2 custom RSI's
2 custom EMA's
All can be toggled on and off
2nd RSI can be set to a different Timeframe than used on the chart
2nd EMA, dito.


checkm8's ADX & DMI v2 with MTF Godmode CrossoversHello & welcome to my updated version of the ADX & DMI indicator.
The average directional index and directional moving indices are a godsend and I think you should incorporate it into your trading.
Here's a quick how-to:
A detailed guide is available in my first version:
Additional edits:
My indicator paints the background of the indicator green when +DMI is above -DMI and red when -DMI is above +DMI. In addition to this, the background will paint darker green when the RSI on the timeframe exceeds 70 and even darker when the RSI exceeds 80, in a +DMI dominance. The background will paint darker red when the RSI on the timeframe falls below 30 and even darker when the RSI falls below 20, in a -DMI dominance.
The indicator also displays multi-timeframe (MTF) crossovers on Godmode MACDs, plotted on the ADX line. If the dots are teal, it means that the shorter-term MA crossed above the longer-term MA (bullish), and if it is fuchsia, the shorter-term MA crossed below the longer-term MA (bearish).
Additional notes:
Additional edits:
1) Speculating on DMI crossovers is dangerous, especially on larger timeframes. Be careful when doing so if you are not familiar with the calculations behind the DMIs and if you are not familiar with how movements on lower timeframes translate to larger timeframes.
Additional resources to learn about ADX & DMI:
1) seekingalpha.com
2) stockcharts.com
Special thanks:
-xSilas, for the development of the Godmode calculations used in my indicator
-dent77x, for being a thinkpool and emotional support
-kristarling, for help with the coding

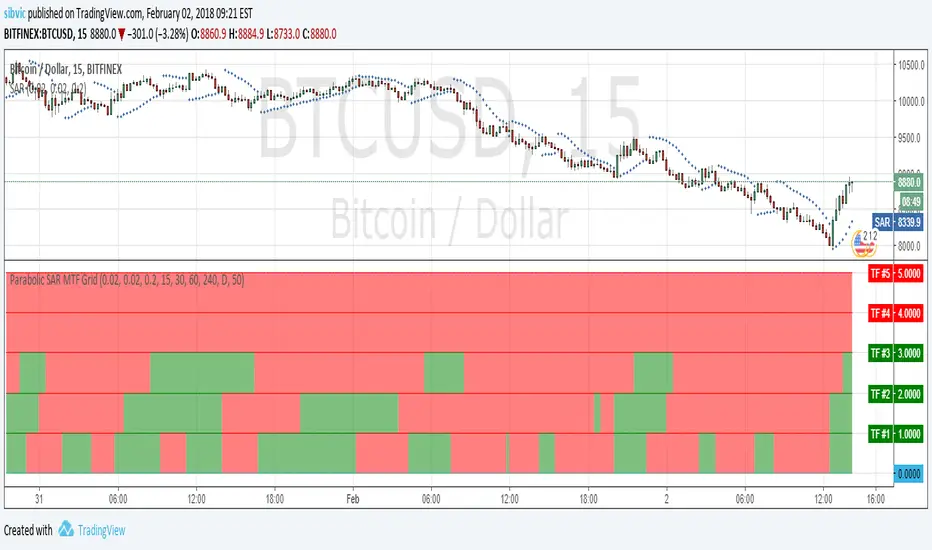
Parabolic SAR MTF GridShow a grid with Parabolic SAR in 5 timeframes. Shows an alert when the Parabolic SAR show the same direction for all 5 timeframes.
Stochastic RSI MTF - 4 REALStochastic RSI Multi-timeframes
4 simultaneous timeframes on one indicator
This indicator is invite only, if you want to try it ask for access in comments


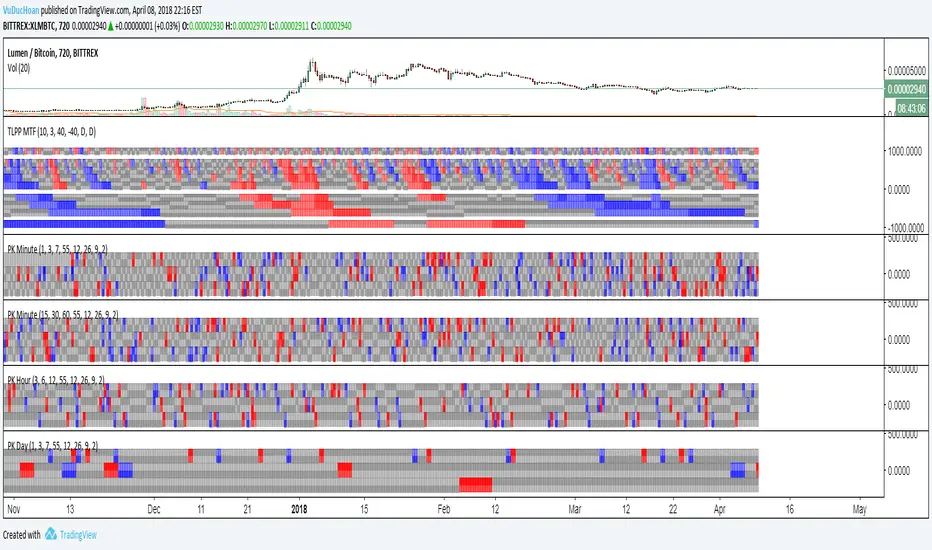
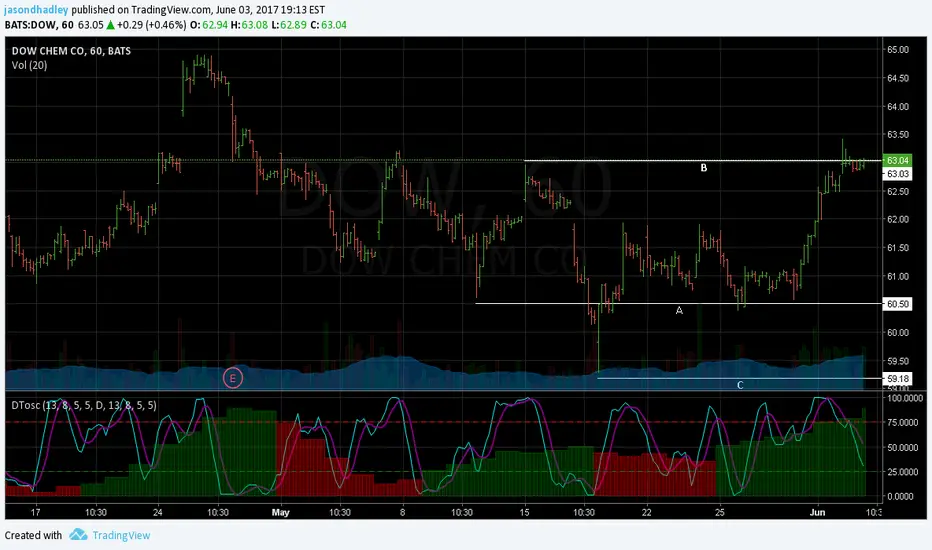
Dynamic Time Oscillator W/ MTF SupportThis script has the option to disable the MTF feature and use it as a plain DTOscillator.
The lines are the fast and slow signals for the current timeframe.
The columns are the second timeframe %K levels.
Green columns signify the second timeframe %K is greater than the second timeframe %D, Red is the reverse of this.


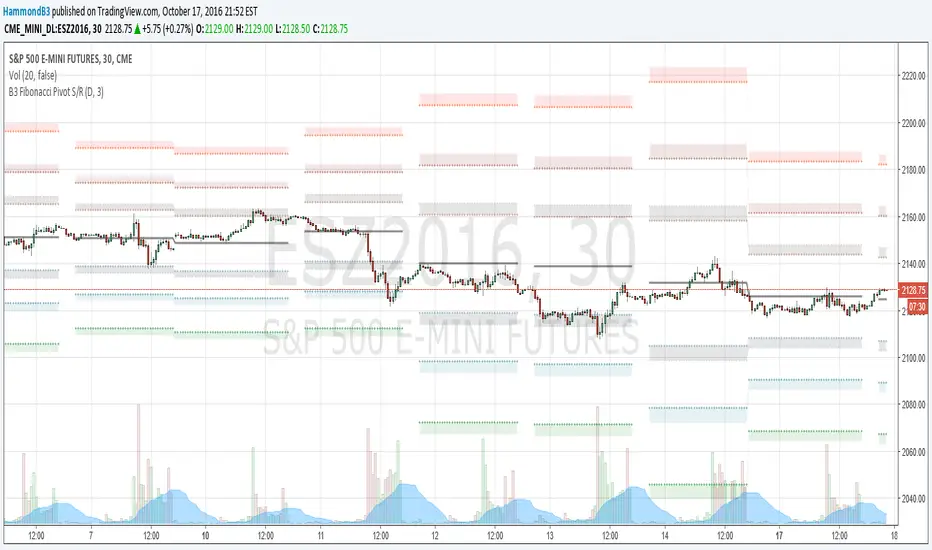
B3 Fibonacci Pivot S/RFor my second share, I give you some levels I look at everyday for the ES minis. HLC/3 of the MTF (multi-time-frame) inputs = mean and Fib-levels formed as support and resistance zones. There are some websites that will show you 20 ways to figure out a pivot for the day's intraday workings, and this one always rang true for me. I keep it set at Res=D and Len=3or5 and use on hourly charts. This indicator is capable of doing like a Res=60m Len=8 for a 5m chart or something of that nature if you wish to test it out.
I haven't tested it out for tick charts and I have noticed that this is good on index and commodity futures, and not so much other things.
Uncanny to me how well this works as reversal awareness for ES. Doesn't mean that one will happen, or if it does that it will have trade-able juice, though it is very important awareness never-the-less.
screencast.com
Stochastic CCI MTF w/ UP/DOWN colours - squattterStoch CCI has a nicer divergence than Stoch RSI.
Enjoy!
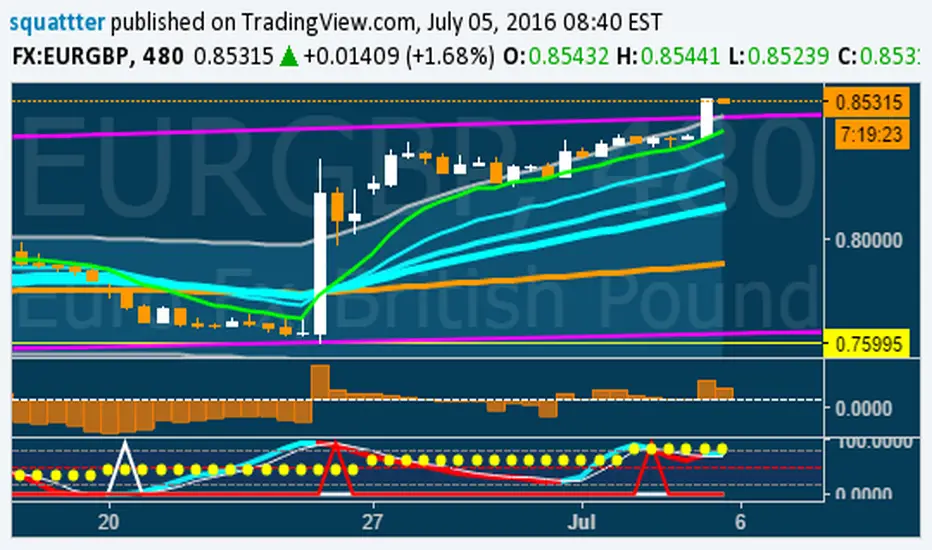
Stochastic CCI MTF w/ UP/DOWN colours - squattterStoch CCI has nicer divergences than Stoch RSI.
Enjoy.

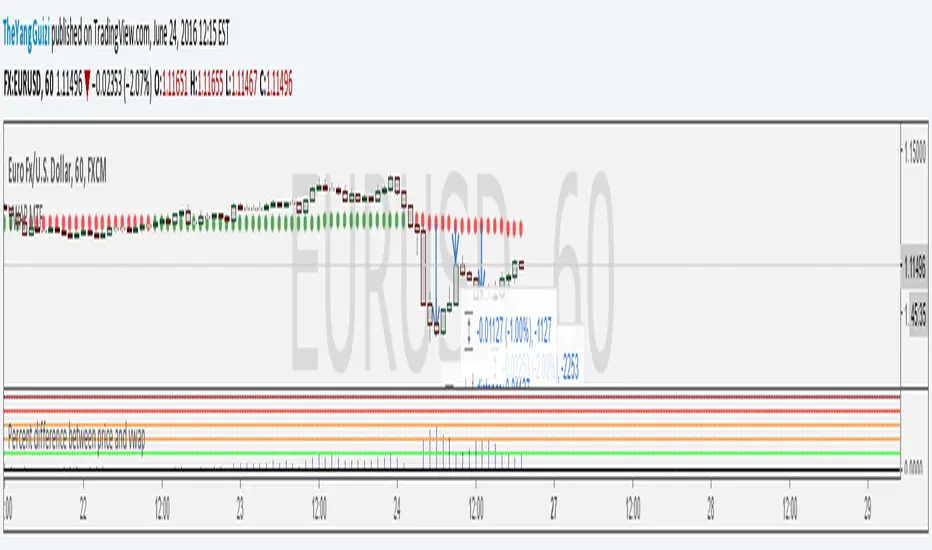
Percent Difference Between VWAP and Price MTFShows the difference between vwap and price in percent.
You can can choose between multiple timeframe vwap. Default is normal daily.
The levels on the indicator can be changed to whatever you want to.
In the chart above we can see eurusd reverting up at 3% below monthly vwap, after the brexit dip, It then turns down again at 1% from monthly and lastly it turns up again at 2% from monthly.
Script is a small modification of this:
VWAP MTF (Multi Timeframe)VWAP that can be be plotted from different timeframes.
Ex if you chose 60 min, it will plot a new vwap line at the start of every hour.
Intraday:
Used code from SandroTurriate to create this.
