MTF Scalper - alemicihanMulti-Timeframe Scalper Strategy: Aligning the Big Picture for Quick Gains
This article presents a robust futures trading strategy designed for high-frequency scalping in the crypto market. It’s built on the principle of minimizing risk by ensuring that short-term entries are always aligned with the dominant, higher-timeframe trend.
The Core Concept: Alignment is Key
A Balanced Trend Follower approach, now refined for rapid scalping, uses a Multi-Timeframe (MTF) confirmation system to filter out market noise and increase the probability of a successful trade.
The strategy operates on a Low Timeframe (LTF) chart (e.g., 3m, 5m, or 15m) but only executes trades if the direction is validated by three Higher Timeframes (HTF).
ComponentPurposeFunctionHTF (D, 4h, 1h) EMA => Trend Confirmation =>Checks if the current price is above/below all three Exponential Moving Averages (EMA 20). This provides a strong directional bias.
LTF (5m) Stochastic RSI => Momentum Entry => Generates the actual buy/sell signal by spotting a swift crossover, indicating fresh momentum in the direction of the confirmed HTF trend.
How The Signal Is Generated
Trend Alignment: The system first confirms the trend. If the price is trading above the Daily, 4-Hour, and 1-Hour EMAs, the market is deemed to be in a Strong LONG Trend. Only LONG signals are permitted.
Momentum Trigger: Once the trend is confirmed, a Long Signal is generated only when the Stochastic K-Line crosses above the D-Line, indicating a momentum shift (a pullback ending) towards the main trend direction.
Short Signal: The inverse logic applies to the Short Trend confirmation and entry signal.
Mandatory Risk Management: ATR-Based Exit
Given the high leverage nature of futures and scalping, static Stop-Loss (SL) and Take-Profit (TP) levels are inefficient. This strategy uses the Average True Range (ATR) indicator to dynamically set profit and loss targets based on current market volatility.
Stop Loss (SL): Set dynamically at 1.5 x ATR below (for long) or above (for short) the entry price. This gives the trade enough room to breathe without risking excessive capital.
Take Profit (TP): Set dynamically at 3.0 x ATR, establishing a robust Risk-to-Reward Ratio of 1:2.
Final Thoughts on Testing
This sophisticated approach combines the reliability of MTF analysis with the speed of momentum indicators. However, data analysis is key. Backtesting these parameters (EMA, ATR Multipliers, RSI/Stochastic lengths) on your chosen asset (like BTC/USDT or ETH/USDT) and timeframe is crucial to achieving optimal performance.
Cerca negli script per "mtf"

MTF RSI — Centered at Zero# 🌟 **MTF RSI — Centered at Zero(英語版 Description)**
**A multi–timeframe RSI tool designed for trend-filtered entries and safer reversal timing.
This script transforms both the current timeframe RSI and the 4H RSI by centering them at zero (RSI − 50), giving a clean, intuitive regime view.**
---
## 🔍 **Core Concept**
Traditional RSI fluctuates between 0–100, but the true trend cue lies in the relationship to 50.
By centering RSI at zero, you instantly see:
* **Above 0 → bullish pressure**
* **Below 0 → bearish pressure**
On top of this, the script plots the **4H RSI as a histogram**, allowing you to visually confirm whether the market is in a BUY-ONLY or SELL-ONLY environment before taking any signals.
---
## 🎯 **What This Script Helps You Do**
* Avoid dangerous counter-trend trades
* Identify high-quality reversal points only when aligned with the 4H trend
* Enter pullbacks or bounces with noticeably higher accuracy
* Visually detect regime strength and extreme conditions (RSI >70 / <30)
Even during aggressive trending markets, the combined filter
**(4H regime + local RSI extreme + initial reversal signal)**
keeps you only in high-probability opportunities.
---
## 💡 **Color Logic**
### Vertical stripe (per-bar):
* 🔴 **Overbought (RSI >70)** — red / pink
* 🔵 **Oversold (RSI <30)** — blue
* Colors become stronger when the 4H and current RSI extremes align
* Option to show history or only the most recent bar
### Histogram (4H RSI – 50):
* Pink column above 0 → bullish bias
* Blue column below 0 → bearish bias
### Pivot Signals:
* 🟠 **Buy Signal**: RSI crosses up from local weakness *AND* 4H is BUY-ONLY
* 🔴 **Sell Signal**: RSI crosses down from local strength *AND* 4H is SELL-ONLY
These signals often align with classical **Granville #4 / #8** (deep pullback reversals).
---
## ⏱️ **Timeframe Usage**
Works well on:
* **5m** for active traders
* **15m** for conservative entries
* **1H** for swing confirmation
All of them rely on the same principle:
**“Let the 4H trend guide the direction, and take only high-probability reversals.”**
---
## 🚀 **Best Use Case**
Enter only when:
1. 4H histogram clearly shows BUY-ONLY or SELL-ONLY
2. Local RSI hits extreme zones
3. A bounce or breakdown occurs
4. Your stop-loss is clearly defined beneath the reversal structure
This combination creates consistently **small losses, larger wins** —
ideal for systematic short-term trading.
---
---
# 🌟 **MTF RSI — Centered at Zero(日本語版 Description)**
**RSIを 50 でセンタリングすることで、
“相場が上に傾いているのか / 下に傾いているのか” を一瞬で判別できる、
マルチタイムフレーム対応のRSIトレンド・フィルタースクリプトです。**
---
## 🔍 **スクリプトの核心**
RSIの本質は「50を境に強弱が決まる」ことにあります。
そこで **RSI − 50** を使い、
* **0より上 → 上昇バイアス**
* **0より下 → 下降バイアス**
となるように変換しています。
4時間足RSIも同様にゼロ基準でヒストグラム化するため、
**いま市場の“支配方向(BUY ONLY / SELL ONLY)”がひと目で分かる仕様** にしています。
---
## 🎯 **このスクリプトが解決する課題**
* トレンドに逆らった“危険な逆張り”を避けられる
* 4時間足トレンドと一致したときだけ反転シグナルが出る
* 押し目買い・戻り売りの精度が高まる
* 極端ゾーン(RSI >70 / <30)を自動で縦ストライプ表示
特に、
**4時間足のトレンド + 極端ゾーン + 初動シグナル(RSI反転)**
のセットアップは実戦での成功率が非常に高いです。
---
## 🎨 **カラーの意味**
### ◆ 縦ストライプ(バー単位)
* 🔴 RSI > 70 → オーバーボート(赤/ピンク)
* 🔵 RSI < 30 → オーバーソールド(青)
* 4Hも同方向の極端であれば濃く表示
* 「過去の塗りを消すモード」搭載(今バーのみ表示)
### ◆ 4時間足ヒストグラム(RSI − 50)
* ピンク:上昇圧力(BUY ONLY に近い)
* 青:下降圧力(SELL ONLY に近い)
### ◆ 反転シグナル
* 🟠 BUY:RSIが弱い領域から上抜け + 4H BUY ONLY
* 🔴 SELL:RSIが強すぎる領域から下抜け + 4H SELL ONLY
これはグランビルの4番/8番(深い押し・戻りの反転)にも一致します。
---
## 🕒 **推奨タイムフレーム**
* 5分足:素早くエントリーしたい人
* 15分足:最も安定
* 1時間足:ゆったり目線のスイング向け
---
## 🚀 **ベストな使い方**
以下の条件が揃ったとき、統計的に最も強いエントリーになります:
1. 4時間足RSIヒストグラムが BUY ONLY / SELL ONLY
2. 15分足RSIが極端ゾーンに到達
3. 反転初動のシグナルが点灯
4. 損切りラインが構築できている
(直近安値・高値のすぐ外側)
これにより、**損小利大でブレの少ないトレード** が可能になります。

MTF Checklist DashboardMTF Checklist Dashboard
Overview
The MTF Checklist Dashboard is an advanced multi-timeframe analysis tool that provides traders with a comprehensive visual dashboard to analyze market conditions across six customizable timeframes simultaneously. This indicator combines multiple technical analysis methods, including Opening Range Breakouts (ORB), VWAP, EMAs, and daily price levels, to generate high-probability confluence-based trading signals.
Unlike traditional single-timeframe indicators, this dashboard displays all critical information in one organized table, allowing traders to instantly identify when multiple timeframes align for optimal entry and exit opportunities.
Key Features
Multi-Timeframe Analysis
Analyzes up to 6 timeframes simultaneously (default: 1m, 5m, 15m, 30m, 1h, 4h)
Fully customizable timeframe selection via comma-separated input
Color-coded cells for instant visual recognition (green=bullish, red=bearish, yellow=neutral)
Technical Indicators Tracked
Current and previous candle direction
Opening Range Breakout (ORB) positioning with custom period
VWAP relationship (above/below)
200 EMA positioning
Daily and previous day high/low proximity
EMA crossovers (9 vs 21, both vs 200)
Advanced Signal Filtering System
Confluence scoring: Requires multiple timeframes to align (3-6 timeframes)
Higher timeframe confirmation: Ensures 30m/1h/4h agreement
Volume filter: Confirms signals with above-average volume (1.5x default)
ATR volatility filter: Validates sufficient market movement
Session timing: Restricts signals to optimal trading hours (EST)
Momentum confirmation: Requires recent directional strength
Range positioning: Blocks signals near daily extremes
Candle strength: Validates strong directional candles (60%+ body ratio)
Visual Signals
Optional entry arrows (above/below bars)
Background color highlighting
Organized dashboard with real-time price levels
ORB range, current day, and previous day summary rows
Alert Conditions
JSON-formatted alerts for automated trading integration
Separate alerts for long entry, short entry, long exit, and short exit
Compatible with webhook automation systems
How To Use
Dashboard Interpretation
The dashboard displays a color-coded table with the following columns:
TF: Timeframe being analyzed
C: Current candle (Green=bullish, Red=bearish)
P: Previous candle (Green=bullish, Red=bearish)
ORB: Opening Range Breakout position (A=Above, B=Below, W=Within)
VWAP: Price vs VWAP (A=Above, B=Below)
E200: Price vs 200 EMA (A=Above, B=Below)
D Hi/Lo: Proximity to current day high/low (Hi/Lo/Mid)
PD Hi/Lo: Proximity to previous day high/low (Hi/Lo/Mid)
9 vs 21: EMA 9 vs EMA 21 relationship (A=9 above 21, B=9 below 21)
9&21 v200: Both EMAs vs 200 EMA (>>=both above, <<=both below, <>=mixed)
Signal Generation
Long Entry Signal triggers when:
Minimum number of timeframes show bullish alignment (default: 5 of 6)
Higher timeframes (30m/1h/4h) confirm direction (default: 2 of 3)
Price breaks above ORB high with sufficient distance
Volume exceeds average by specified multiplier
ATR shows adequate volatility
Trade occurs during optimal session hours
Recent momentum is upward
Price not too close to daily high
Strong bullish candle forms
Short Entry Signal uses opposite conditions
Exit Signals trigger when opposing timeframe confluence reaches threshold (default: 3 timeframes)
Recommended Workflow
Select your asset and primary trading timeframe
Observe the dashboard - Look for rows showing mostly green (bullish) or red (bearish)
Wait for alignment - The indicator will show arrows when confluence requirements are met
Check the bottom rows - Review ORB levels and daily ranges for context
Set alerts - Enable TradingView alerts using the built-in alert conditions
Manage risk - Use appropriate position sizing and stop losses based on ORB range or daily ATR
Settings Guide
Basic Settings
Timeframes: Enter comma-separated values (e.g., "1,5,15,30,60,240")
Show Header: Toggle column headers on/off
ORB Minutes: Set opening range period (default: 15 minutes)
Near % for daily highs/lows: Define proximity threshold (default: 0.20%)
Use close for comparisons: Compare using close vs current price
Dashboard Position: Choose from 9 screen positions
Confluence Filters
Minimum Timeframes Aligned: Set required confluence (3-6, default: 5)
Require Higher Timeframe Confirmation: Toggle HTF requirement on/off
Min Higher Timeframes: Specify HTF agreement needed (1-3, default: 2)
Volume Filter
Volume Confirmation: Enable/disable volume filtering
Volume vs Average: Set multiplier threshold (default: 1.5x)
Volume Average Length: Period for volume average (default: 20 bars)
Volatility Filter (ATR)
Volatility Filter: Enable/disable ATR confirmation
ATR Length: Calculation period (default: 14)
Min ATR vs Average: Required ATR level (default: 0.5x = 50%)
ORB Filters
ORB Breakout Distance Required: Toggle distance requirement
Min Breakout % Beyond ORB: Additional breakout threshold (default: 0.10%)
Session Filter
Trade Only During Best Hours: Enable time-based filtering
Session 1: First trading window (default: 0930-1130 EST)
Session 2: Second trading window (default: 1400-1530 EST)
Momentum Filter
Recent Momentum Required: Enable directional momentum check
Lookback Bars: Period for momentum comparison (default: 3 bars)
Daily Range Filter
Block Signals Near Daily Extremes: Prevent entries at extremes
Distance from High/Low %: Minimum distance required (default: 2.0%)
Candle Filter
Strong Directional Candle: Require candle strength
Min Candle Body %: Body-to-range ratio threshold (default: 60%)
Visual Signals
Show Entry Signals: Master toggle for visual signals
Show Arrows: Display entry arrows on chart
Background Color: Enable background highlighting
Best Practices
Start with default settings and adjust based on your trading style and asset volatility
Higher confluence requirements (5-6 timeframes) produce fewer but higher-quality signals
Enable all filters for conservative trading; disable some for more frequent signals
Use the dashboard as confirmation alongside your existing trading strategy
Backtest on your specific instruments before live trading
Consider market conditions—trending vs ranging markets may require different settings
Alerts
This indicator includes four alert conditions with JSON formatting for webhook integration:
Long Entry Signal: Triggers when all long conditions are met
Short Entry Signal: Triggers when all short conditions are met
Long Exit Signal: Triggers when opposing confluence reaches exit threshold
Short Exit Signal: Triggers when opposing confluence reaches exit threshold
Alert messages include ticker symbol, action (buy/sell), price, and quantity for automated trading systems.
Important Notes
This indicator works best on liquid instruments with clear price action
Highly volatile markets may require adjusted ATR and ORB distance settings
Session times are in EST timezone—adjust if trading non-US markets
The ORB calculation requires sufficient price history for the day
Signals are generated in real-time but should be confirmed at candle close
Limitations
Maximum of 6 timeframes can be analyzed due to TradingView's security call limits
ORB calculations may not work correctly on instruments with gaps or irregular sessions
The indicator is most effective during regular market hours when volume and volatility are adequate
Lower timeframes (1m, 5m) may produce more false signals in choppy conditions
License
Mozilla Public License 2.0 (MPL-2.0)
This indicator is licensed under the Mozilla Public License 2.0. You are free to use, modify, and distribute this code under the terms of the MPL-2.0. The full license text is available at mozilla.org
Key license provisions:
You may use this code commercially
You may modify and distribute modified versions
Modified versions must be released under the same license
You must include the original license notice in any distributions
No trademark rights are granted
Disclaimer
This indicator is provided for educational and informational purposes only. It is not financial advice, and past performance does not guarantee future results. Trading involves substantial risk of loss. Always:
Practice proper risk management
Test thoroughly on paper/demo accounts before live trading
Use appropriate position sizing
Never risk more than you can afford to lose
Consult with a financial advisor for personalized advice
The creator assumes no liability for trading losses incurred using this indicator.
Version: 2.0
Pine Script Version: v6
Author: © EliasVictor

MTF Oscillator Stack [BigBeluga]🔵 OVERVIEW
The MTF Oscillator Stack brings powerful multi-timeframe momentum analysis directly into your price chart. You can select one oscillator— RSI , MFI , or Stochastic RSI —and display it across up to 4 different timeframes. Each panel is neatly stacked horizontally above price , offering quick insight into cross-timeframe conditions like trend direction, exhaustion zones, and momentum shifts.
🔵 CONCEPTS
Single Oscillator Mode: Select one oscillator type (RSI, MFI, or Stoch RSI) to analyze across all selected timeframes.
Top-Chart Horizontal Panels: Oscillator plots are aligned horizontally at the top of the chart for seamless top-down reading.
Signal Comparison Arrows: Arrows (🢁 / 🢃) indicate oscillator position relative to its signal line.
Overbought/Oversold Zones: Transparent 30–70 fill zones highlight key reversal areas.
Dynamic Display Logic: Only enabled panels are shown; spacing adjusts based on active timeframes.
Timeframe Tagging: Each oscillator panel is labeled with its corresponding timeframe (e.g., 1H, 2H, 4H).
🔵 FEATURES
Choose one oscillator (RSI, MFI, or Stoch RSI) and apply it across up to 4 timeframes.
Each oscillator panel includes: price-synced plot, signal line, and zone shading.
Scale alignment allows users to place charts at the bottom or top.
Clear arrow signals show whether oscillator is bullish or bearish.
Individual length and signal settings per timeframe.
Toggle for alignment mode: evenly spaced or floating layout.
All panels use a consistent layout for faster decision-making.
🔵 HOW TO USE
Select your preferred oscillator and activate 2–4 key timeframes (e.g., 1H, 4H, D1, W1).
Use signal crossovers as a bullish (🢁) or bearish (🢃) trend cue.
Look for aligned extremes (e.g., all timeframes overbought) to spot momentum exhaustion.
Ideal for momentum confluence strategies and top-down confirmation.
Use horizontal layout to stay focused on price while assessing broader structure.
🔵 CONCLUSION
MTF Oscillator Stack simplifies complex multi-timeframe momentum analysis into one clean, actionable visual. Whether you're tracking RSI, MFI, or Stoch RSI, this tool helps you stay aligned with the broader trend—without ever leaving your main chart.

MTF Candles [Fadi x MMT]MTF Candles
Overview
The MTF Candles indicator is a powerful tool designed for traders who want to visualize higher timeframe (HTF) candles directly on their current chart. Built with flexibility and precision in mind, this Pine Script indicator displays up to six higher timeframe candles, complete with customizable styling, sweeps, midpoints, fair value gaps (FVGs), volume imbalances, and trace lines. It’s perfect for multi-timeframe analysis, helping traders identify key levels, market structure, and potential trading opportunities with ease.
Key Features
- Multi-Timeframe Candles : Display up to six higher timeframe candles (e.g., 5m, 15m, 30m, 4H, 1D, 1W) on your chart, with configurable timeframes and visibility.
- Sweeps Detection : Identify liquidity sweeps (highs/lows) with customizable line styles, widths, and colors, plus optional alerts for confirmed bullish or bearish sweeps.
- Midpoint Lines : Plot the midpoint (average of high and low) of the previous HTF candle, with customizable color, width, and style for enhanced market analysis.
- Fair Value Gaps (FVGs) : Highlight gaps between non-adjacent candles, indicating potential areas of interest for price action.
- Volume Imbalances : Detect and display volume imbalances between adjacent candles, aiding in spotting significant price levels.
- Trace Lines : Connect HTF candle open, close, high, and low prices to their respective chart bars, with customizable styles and optional price labels.
- Custom Daily Open Times : Support for custom daily candle open times (Midnight, 8:30, or 9:30) to align with specific market sessions.
- Dynamic Labels : Show timeframe names, remaining time until the next HTF candle, and interval labels (e.g., day of the week for daily candles) with adjustable positions and sizes.
- Highly Customizable : Fine-tune candle appearance, spacing, padding, and visual elements to suit your trading style.
How It Works
The indicator renders HTF candles as boxes (bodies) and lines (wicks) on the right side of the chart, with each timeframe offset for clarity. It dynamically updates candles in real-time, tracks their highs and lows, and displays sweeps and midpoints when conditions are met. FVGs and volume imbalances are calculated based on candle relationships, and trace lines link HTF candle levels to their originating bars on the chart.
Sweep Logic
- A bearish sweep occurs when the current candle’s high exceeds the previous candle’s high, but the close is below it.
- A bullish sweep occurs when the current candle’s low falls below the previous candle’s low, but the close is above it.
- Sweeps are visualized as horizontal lines and can trigger alerts when confirmed on the next candle.
Midpoint Logic
- A midpoint line is drawn at the average of the previous HTF candle’s high and low, extending until the next HTF candle forms.
- Useful for identifying potential support/resistance or mean reversion levels.
Imbalance Detection
- FVGs : Identified when a candle’s low is above the next-but-one candle’s high (or vice versa), indicating a price gap.
- Volume Imbalances : Detected between adjacent candles where the body of one candle doesn’t overlap with the next, signaling potential liquidity zones.
Settings
Timeframe Settings
- HTF 1–6 : Enable/disable up to six higher timeframes (default: 5m, 15m, 30m, 4H, 1D, 1W) and set the maximum number of candles to display per timeframe (default: 4).
- Limit to Next HTFs : Restrict the number of active timeframes (1–6).
Styling
- Body, Border, Wick Colors : Customize bull and bear candle colors (default: light gray for bulls, dark gray for bears).
- Candle Width : Adjust the width of HTF candles (1–4).
- Padding and Spacing : Set the offset from the current price action and spacing between candles and timeframes.
Label Settings
- HTF Label : Show/hide timeframe labels (e.g., "15m", "4H") at the top/bottom of candle sets.
- Remaining Time : Display the countdown to the next HTF candle.
Interval Value: Show day of the week for daily candles or time for intraday candles.
- Label Position/Alignment : Choose to display labels at the top, bottom, or both, and align them with the highest/lowest candles or follow individual candle sets.
Imbalance Settings
- Fair Value Gap : Enable/disable FVGs with customizable color (default: semi-transparent gray).
- Volume Imbalance : Enable/disable volume imbalances with customizable color (default: semi-transparent red).
Trace Settings
- Trace Lines : Enable/disable lines connecting HTF candle levels to their chart bars, with customizable colors, styles (solid, dashed, dotted), and sizes.
- Price Labels : Show price levels for open, close, high, and low trace lines.
- Anchor : Choose whether trace lines anchor to the first or last enabled timeframe.
Sweep Settings
- Show Sweeps : Enable/disable sweep detection and visualization.
- Sweep Line : Customize color, width, and style (solid, dashed, dotted).
- Sweep Alert : Enable alerts for confirmed sweeps.
Midpoint Settings
- Show Midpoint : Enable/disable midpoint lines.
- Midpoint Line : Customize color (default: orange), width, and style (solid, dashed, dotted).
Custom Daily Open
Custom Daily Candle Open : Choose between Midnight, 8:30, or 9:30 (America/New_York) for daily candle opens.
Usage
- Add the indicator to your TradingView chart.
- Configure the desired higher timeframes (HTF 1–6) and enable/disable features via the settings panel.
- Adjust styling, labels, and spacing to match your chart preferences.
Use sweeps, midpoints, FVGs, and volume imbalances to identify key levels for trading decisions.
- Enable sweep alerts to receive notifications for confirmed liquidity sweeps.
Notes
Performance: The indicator is optimized for up to 500 boxes, lines, and labels, with a maximum of 5000 bars back. Can be slow at a time
Time Zone: Custom daily opens use the America/New_York time zone for consistency with major financial markets.
Compatibility: Ensure selected HTFs are valid (higher than the chart’s timeframe and divisible by it for intraday periods).

MTF Countdown with Direction - AynetIndicator Definition and Inputs:
pineCopyindicator('MTF Countdown with Direction - Aynet', overlay = true)
This code creates a Multiple Time Frame (MTF) countdown indicator with direction
The overlay = true parameter places the indicator on top of the price chart
Timeframe Options:
Users can choose to show/hide the following timeframes:
1 minute
5 minutes
15 minutes
30 minutes
1 hour
4 hours
Daily
Time Calculations:
pineCopyget_current_time()
Calculates the current time
Converts Unix timestamp to seconds
Calculates time since midnight
Returns time broken down into hours, minutes, and seconds
Countdown Calculation:
pineCopyget_period_countdown(period_seconds)
Calculates remaining time for each timeframe
Computes elapsed time in current period
Returns remaining time in hours, minutes, and seconds
Direction and Closing Price Calculation:
Separate functions for each timeframe (get_direction_and_close_1m(), get_direction_and_close_5m(), etc.)
Each function:
Gets current closing price
Compares with previous closing price
Determines direction (up: 1, down: -1, sideways: 0)
Returns direction and closing price
Table Creation and Updates:
Creates a table in the top right corner
Table consists of 4 columns:
Period (Timeframe)
Time Left (Remaining time)
Direction (Shown with arrows)
Close (Closing price)
Each row has a different background color
Direction arrows:
Green up arrow (▲): Price rising
Red down arrow (▼): Price falling
Gray line (―): Price sideways
Dynamic Data Structures:
pineCopyvar timeframes = array.new_int()
var timeframe_names = array.new_string()
var show_array = array.new_bool()
Uses dynamic arrays for timeframes
Adds selected timeframes to arrays on first run
Key Features:
Shows remaining time until period close
Displays price direction for each timeframe
Shows current closing prices
All information in a single, easy-to-read table
This indicator helps traders by providing a comprehensive view of:
When each timeframe will close
The direction of price movement
Current closing prices
across multiple timeframes in a single table, making it easier to track market movements across different time periods.
The color-coding and arrow system makes it visually intuitive to understand market direction at a glance, while the countdown timer helps with timing decisions.

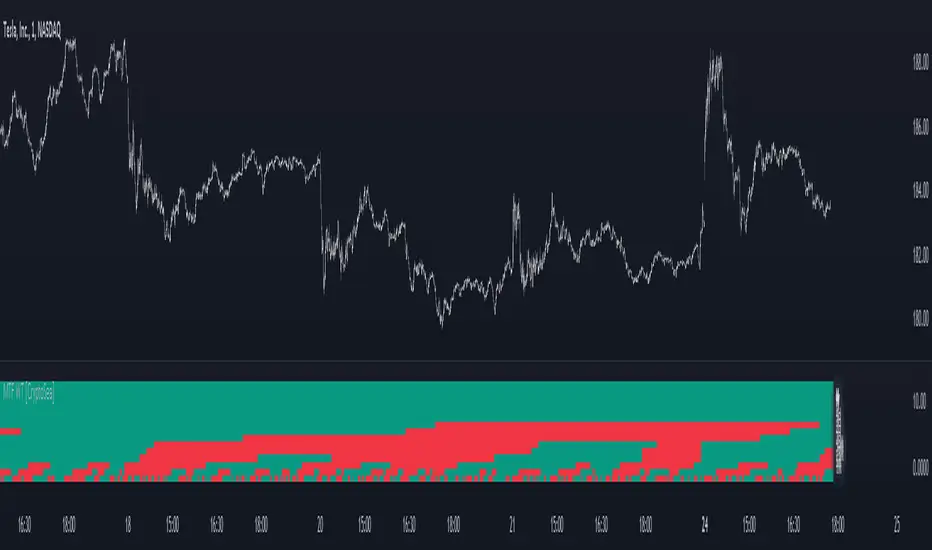
MTF WaveTrend [CryptoSea]The MTF WaveTrend Indicator is a sophisticated tool designed to enhance market analysis through multi-timeframe WaveTrend calculations. This tool is built for traders who seek to identify market momentum and potential reversals with higher accuracy.
In the example below, we can see all the choosen timeframes agree on bearish momentum.
Key Features
Multi-Timeframe WaveTrend Analysis: Tracks WaveTrend values across multiple timeframes to provide a comprehensive view of market momentum.
Customizable Colour Rules: Offers three different colour rules (Traditional, WT1 0 Rule, WT1 & WT2 0 Rule) to suit various trading strategies.
Timeframe Visibility Control: Allows users to enable or disable specific timeframes, providing flexibility in analysis.
Clear Visual Indicators: Uses color-coded squares and labels to clearly display WaveTrend status across different timeframes.
Candle Colouring Option: Includes a setting for neutral candle coloring to enhance chart readability.
This example shows what can happen when all timeframes start alligning with eachother.
How it Works
WaveTrend Calculation: Computes the WaveTrend oscillator by applying a series of exponential moving averages and scaling calculations.
Multi-Timeframe Data Aggregation: Utilizes the `request.security` function to gather and display WaveTrend values from various timeframes without repainting issues.
Conditional Plotting: Displays visual cues only when higher timeframes align with the selected timeframe, ensuring relevant and reliable signals.
Dynamic Colour Rules: Adjusts the indicator colors based on the chosen rule, whether it's a traditional crossover, WT1 crossing zero, or both WT1 & WT2 crossing zero.
Traditional: Colors are determined by the relationship between WT1 and WT2. If WT1 is greater than WT2, it is bullish (bullColour), otherwise bearish (bearColour).
WT1 0 Rule: Colors are based on whether WT1 is above or below zero. WT1 above zero is bullish (bullColour), below zero is bearish (bearColour).
WT1 & WT2 0 Rule: A more complex rule where both WT1 and WT2 need to be above zero for a bullish signal (bullColour) or both below zero for a bearish signal (bearColour). If WT1 and WT2 are not in agreement, a neutral color (neutralColour) is displayed.
This indicator will make sure that the lowest timeframe you can see data from will be the timeframe you are on. This is to avoid false signals as you cannot display 3 x 5 minute candles whilst looking at the 15 minute candle.
Application
Strategic Decision-Making: Assists traders in making informed decisions by providing detailed analysis of WaveTrend movements across different timeframes.
Trend Confirmation: Reinforces trading strategies by confirming potential reversals with multi-timeframe WaveTrend analysis.
Customized Analysis: Adapts to various trading styles with extensive input settings that control the display and sensitivity of WaveTrend data.
The MTF WaveTrend Indicator by is an invaluable addition to a trader's toolkit, offering depth and precision in market trend analysis to navigate complex market conditions effectively.
MTF Bollinger BandWidth [CryptoSea]The MTF Bollinger BandWidth Indicator is an advanced analytical tool crafted for traders who need to gauge market volatility and trend strength across multiple timeframes. This powerful indicator leverages the Bollinger BandWidth concept to provide a comprehensive view of price movements and volatility changes, making it ideal for those looking to enhance their trading strategies with multi-timeframe analysis.
Key Features
Multi-Timeframe Analysis: Allows users to monitor Bollinger BandWidth across various timeframes, providing a macro and micro perspective on market volatility.
Pivot Point Detection: Identifies crucial high and low pivot points, offering insights into potential support and resistance levels. Pivot points are dynamic and adjust based on the timeframe viewed, reflecting short-term fluctuations or longer-term trends.
Customizable Parameters: Includes options to adjust the length of the moving average, the standard deviation multiplier, and more, enabling traders to tailor the tool to their specific needs.
Dynamic Color Coding: Utilizes color changes to indicate different market conditions, aiding in quick visual assessments.
In the example below, notice how changes in BBW across different timeframes provide early signals for potential volatility increases or decreases.
How it Works
Calculation of BandWidth: Measures the percentage difference between the upper and lower Bollinger Bands, which expands or contracts based on market volatility.
High and Low Pivot Tracking: Automatically calculates and tracks the pivots in BBW values, which are critical for identifying turning points in market behavior. High and low levels will change depending on the timeframe, capturing distinct market behaviors from granular movements to broad trends.
Visual Alerts and Table Display: Highlights significant changes in BBW with visual alerts and provides a detailed table view for comparison across timeframes.
In the example below, BBW identifies a significant contraction followed by an expansion, suggesting a potential breakout.
Application
Strategic Market Entry and Exit: Assists traders in making well-informed decisions about when to enter and exit trades based on volatility cues.
Trend Strength Assessment: Helps in determining the strength of the prevailing market trend through detailed analysis of expansion and contraction periods.
Adaptable to Various Trading Styles: Suitable for day traders, swing traders, and long-term investors due to its customization capabilities and effectiveness across different timeframes.
The MTF Bollinger BandWidth Indicator is a must-have in the arsenal of traders who demand depth, accuracy, and responsiveness in their market analysis tools. Enhance your trading decisions by integrating this sophisticated indicator into your strategy to navigate the complexities of various market conditions effectively.

MTF Williams Vix Market Bottoms [CryptoSea]MTF Williams Vix Fix Indicator is a dynamic tool tailored for traders looking to capture market extremes with high precision. This multi-timeframe indicator leverages the concept of the Williams Vix Fix to spot potential reversals before they occur.
Key Features
Multi-Timeframe Analysis: Provides simultaneous visibility across multiple timeframes, enabling traders to assess market conditions comprehensively from a single chart.
Advanced Volatility Detection: Utilizes a modified Vix Fix formula to highlight extreme price deviations, which often precede significant market reversals.
Customizable Settings: Offers extensive input options to tweak the lookback periods, percentile thresholds, and visibility settings, aligning with various trading strategies.
Visual Band Indicators: Features upper bands and range highs that signal potential overbought and oversold conditions, enhancing trading decision-making.
Below, you can see how the indicator performs across different timeframes, providing valuable insights into market behavior.
How it Works
Vix Fix Calculation: Determines the worst-case 'panic' sell-offs in price as a percentage of the high, capturing the emotional extremes of the market.
Statistical Bands: Employs Bollinger bands over the Vix Fix values to define normal and extreme volatility conditions.
Color-Coded Indicators: Uses color differentiation to instantly highlight when readings surpass critical upper band or range high thresholds, signaling key trading opportunities.
For instance, in the analysis provided below, notice how the indicator flags significant market moves, allowing traders to anticipate potential entry or exit points.
Application
Risk Management: Aids in identifying extreme market conditions where prices may revert, helping in effective position sizing and risk management.
Strategic Planning: Enhances strategic trading plans by identifying not only when but also where market extremes may occur, considering multiple timeframes.
Customization: Adapts seamlessly to different market environments with adjustable settings for volatility thresholds and visual display preferences.
The MTF Williams Vix Fix Indicator by is an essential tool for traders aiming to leverage market volatility for optimal entry and exit, ensuring they are well-equipped to handle market extremes with confidence.

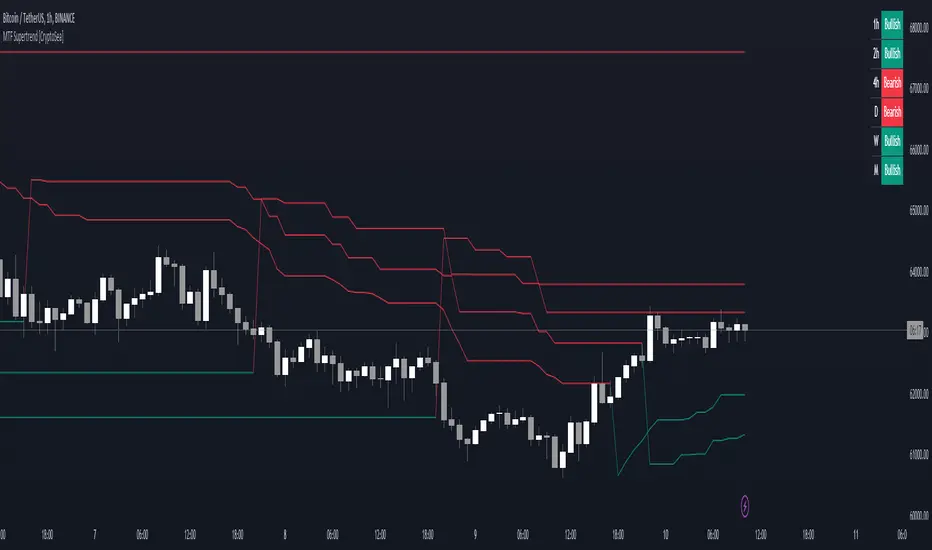
MTF Supertrend [CryptoSea]The MTF Supertrend Indicator is a versatile tool crafted to enhance trend analysis across multiple timeframes. Leveraging the reliable Supertrend formula, it provides traders with a comprehensive view of market trends and potential reversal points.
Key Features
Multi Timeframe Analysis: Tracks Supertrend signals over a variety of timeframes, offering a broad perspective on market direction.
Percentage Threshold Display: Filters out Supertrend data that is not within a specified percentage of the current price, keeping the display focused on relevant trends.
Adaptive Visual Display: Features a dynamic table that shows the current Supertrend status, which is fully customizable to the user's display preferences.
Customizable Sensitivity: Users can fine-tune the factor and ATR period settings, allowing for personalized trend sensitivity.
How it Works
Supertrend Calculation: Computes the Supertrend using the Average True Range (ATR) multiplied by a customizable factor, detecting changes in volatility and trend.
Higher Timeframe Filtering: Prioritizes higher timeframe trends over the current chart's timeframe to avoid chart clutter and focus on the most significant trends.
Colour-Coded Trends: Utilizes colour coding to clearly indicate bullish and bearish trends, aiding quick visual analysis.
Responsive Display Options: Includes a switchable table view to overlay trend information on the chart, with options for dark and light themes.
Benefits for Different Trading Styles
Day Traders: Use real-time updates to catch short-term trend reversals and ride the momentum for quick profits.
Swing Traders: Benefit from viewing medium to long-term trends to formulate strategies that span several days or weeks.
Position Traders: Utilize the monthly supertrend data to make long-term investment decisions based on prevailing market directions.
Application
Strategic Decision-Making: Assists traders in making informed decisions by providing a layered view of trend directions across timeframes.
Trend Confirmation: Reinforces trading strategies by confirming trends with higher timeframe Supertrend alignment.
Customized Analysis: Adapts to various trading styles with input settings that control the display and sensitivity of trend data.
The MTF Supertrend Indicator by is a powerful addition to the trader's toolkit, enhancing multi-timeframe trend analysis and contributing to a strategic trading approach in volatile markets.
RSI Graphique and Dashboard MTFMTF RSI Indicator - User Guide
Introduction:
The MTF RSI (Multi-Timeframe Relative Strength Index) Pine Script is designed to provide traders with a comprehensive view of the RSI (Relative Strength Index) across multiple timeframes. The script includes a primary chart displaying RSI values and a dashboard summarizing RSI trends for different time intervals.
Installation:
Copy the provided Pine Script.
Open the TradingView platform.
Create a new script.
Paste the copied code into the script editor.
Save and apply the script to your chart.
Primary Chart:
The primary chart displays RSI values for the selected timeframe (5, 15, 60, 240, 1440 minutes).
different color lines represent RSI values for different timeframes.
Overbought and Oversold Levels:
Overbought levels (70) are marked in red, while oversold levels (30) are marked in blue for different timeframes.
Dashboard:
The dashboard is a quick reference for RSI trends across multiple timeframes.
Each row represents a timeframe with corresponding RSI trend information.
Arrows (▲ for bullish, ▼ for bearish) indicate the current RSI trend.
Arrow colors represent the trend: blue for bullish, red for bearish.
Settings:
Users can customize the RSI length, background color, and other parameters.
The background color of the dashboard can be adjusted for light or dark themes.
Interpretation:
Bullish Trend: ▲ arrow and blue color.
Bearish Trend: ▼ arrow and red color.
RSI values above 70 may indicate overbought conditions, while values below 30 may indicate oversold conditions.
Practical Tips:
Timeframe Selection: Consider the trend alignment across different timeframes for comprehensive market analysis.
Confirmation: Use additional indicators or technical analysis to confirm RSI signals.
Backtesting: Before applying in live trading, conduct thorough backtesting to evaluate the script's performance.
Adjustment: Modify settings according to your trading preferences and market conditions.
Disclaimer:
This script is a tool for technical analysis and should be used in conjunction with other indicators. It is not financial advice, and users should conduct their own research before making trading decisions. Adjust settings based on personal preferences and risk tolerance. Use the script responsibly and at your own risk.

MTF - Zigzag + Tech IndicatorsMTF - Zigzag + Tech Indicators
At high level the indicator can be a useful tool while analyzing the charts. It marks swing points (Zigzag) on 3 different timeframes along with capability to view key technical indicator values at each of the swing point.
Normally Zaizag indicators are useful for identifying primary trend and retracements. Zigzags also help in identifying key support and resistance areas. Traders develop various trading strategies based on Zigzags.
Most of the published Zigzag indicators use single timeframe / chart timeframe to draw the Zigzag lines but, many traders/chart analysts would like to analyze trends on multiple timeframes. Single timeframe Zigzags makes such analysis little difficult.
This indicator is an advanced version of Zigzag which allow users to draw Zigzag lines on multiple timeframes. It allows users to input 2 additional higher timeframes and in total it draws Zigzag on 3 timeframes i.e., on chart timeframe and 2 additional higher timeframes.
Once loaded on the chart, it draws Zigzag lines and plot labels (HH, LL, HL, LH) which denotes swing points. Each of the swing point label has a tooltip attached to it, which provide few additional data point, to view the additional data points, hover the mouse over the label.
Swing label tooltip shows these additional data points:
Tag: Swing type (HH, LL, HL, LH) + Bar time (in dd-mm-yyyy hh:mm format)
Price point: Swing price point
Price change: Price change since previous swing point along with change %
Swing volume: Volume since previous swing point in million
Key technical indicator values:
RSI (close, 14)
Stochastic (close, high, low, 14)
ADX (14, 14)
SMA20
SMA50
SMA100
SMA200
Use cases:
Support resistance: Though most of the swing points of a zigzag are treated as a support or resistance. This indicator allows to add more depth to the analysis. E.g., swing points based on lowest timeframe (chart timeframe) can be treated as weak support/resistance whereas swing points based on higher timeframe can treated as strong support/resistance and prices need to hit it multiple time to cross/break the same.
Trend identification: Trend on lowest timeframe (chart timeframe) can be a immediate term trend, trend on the mid-level higher timeframe can be a short term trend and trend on the highest level timeframe can be a long term trend.
Trade identification, entry, and exit: MTF Zigzag can also be creatively used while trading. Eg. One can identify a trend on highest level timeframe and use mid-level timeframe for trade entry and lowest level timeframe can be used for Take Profit levels (TP1, TP2, ..) and Stop loss. Alternatively, Trend can be identified on highest or mid-level timeframe and trade entry/exit can be based on lowest level timeframe.
Use of information displayed in tooltip: Analysts/traders look for confirmations from other indicators while initiating trades. These additional indicator values become handy/readily available source of information without specifically navigating through different indicators/charts. These indicator values can be creatively used in many ways. Some of the examples are:
Easy comparison of values of moving averages on all 3 timeframes
Better assessment of momentum and overbought/oversold based on value of stochastic and rsi
Use of ADX to determine the strength of the trend
Trade decision based on increasing or decreasing order of moving averages
Trade decision, based order of moving averages combined with overbought/oversold and strength of the trend
Chart examples: TCS on 60m/4h/1D
ITC 4h/1D
Input Parameters:
1. Chart timeframe zigzag setup: to plot zigzag based on chart timeframe
2. Higher timeframe zigzag setup: to plot zigzag based on higher timeframe
3. Higher timeframe zigzag setup 1: to plot zigzag based on another higher timeframe
Each of these have user selectable options:
1. Color/width of the zigzag line
2. plot zigzag line - select/unselect
3. plot HHLL labels - select/unselect
Both (2 and 3) Higher timeframe setups allow to select higher timeframe and offset. Offset can be 0 or 1. This setting normally used to avoid repainting. Select offset as 1 to avoid repainting.
For Pine script developers:
Script elements:
1. Input parameters
2. Type definition (UDT) for ohlc and ph, pl data elements
3. Map definition for visual properties
4. Type instances for chart_tf, higher_tf1, higher_tf2
5. Important variable – for indicator values
6. Methods –
a. get_ph_pl() – get ph, pl data for each of the tf along with indicator values
b. add_ph(), add_pl() – add ph, pl data to timeframe specific udt, plot the zigzag and labels, add tooltip to label
Script structure
1. Input parameters
2. Variable and type definitions
3. Methods and functions
4. For each of timeframe, call functions and methods
a. Check ph, pl (if swing point formed)
b. Plot ph, pl (if applicable) i.e. zigzag line, labels

MTF TMOTMO - (T)rue (M)omentum (O)scillator) MTF (Higher Aggregation) Version
TMO calculates momentum using the DELTA of price. Giving a much better picture of the trend, reversals & divergences than most momentum oscillators using price. Aside from the regular TMO, this study combines four different TMO aggregations into one indicator for an even better picture of the trend. Once you look deeper into this study you will realize how complex this tool is. This version also produce much more information like crosses, divergences, overbought / oversold signals, higher aggregation fades etc. It is probably not even possible to explain them all, there could easily be an entire e-book about this study.
I have been using this tool for a couple of years now, and this is what i have learned so far:
Favorite Time Frame Variations:
1. 1m / 5m / 30m - Great for intraday futures or options scalps. 30m TMO serves as the overall trend gauge for the day. 5min dictates the longer term intraday moves as well as direction of the 1min. 1min is for the scalps. When the 5min TMO is sloping higher focus should be on 1min buy signals (red to green cross) and vice versa for the 5min agg. sloping down.
2. 5m / 30m / 60m - Also an interesting variation for day trading the 3-5 min charts. Producing more cleaner & beginner-friendly signals that lasts couple of minutes instead of seconds.
3. 120m / Day / 2 Day - For the 30m to 1H or 2H timeframes. Daily & 2 Day dictates the overall trend. 120 min for the signals. Great for a multi-day swings.
4. Day / 2 Day / Week - Good for the daily charts, swing trading analysis as the weekly dictates the overall trend, daily dictates the signals and the 2 day cleans out the daily signals. If the daily & 2 day are not aligned togather, daily signal means nothing. Weekly dictates 2 day - 2 day dictates daily.
5. Week / Month / 3 Month - Same thing as the previous variation but for the weekly charts.
TMO Length:
The default vanilla settings are 14,5,3. Some traders prefer 21,5,3 as the TMO length is litle higher = TMO will potenially last little longer which could teoretically produce less false signals but slower crosses which means signals will lag more behind price. The lower the length, the faster the oscillator oscillates. It is the noice vs. the lag debate. The Length can be changed, but i would not personally touch the other two. Few points up or down on length will not drastically change much. But changes on Calc Length and Smooth Length can produce totally different signals from the original.
Tips & Tricks:
1. Observe
- This is the best tip & trick I can give you. The #1 best way to learn how any study operates is to just observe how it works in certain situations from the past. MTF TMO is not
an exception.
2. The Power of the Higher Aggregation
- The higher aggregation ALWAYS dictates the lower one. Best way to see this? Just 2x the current timeframe aggregation = so on daily chart, plot the daily & two day TMOs and you will notice how the higher agg. smooths out the current agg. The higher the aggregation is, the smoother (but slower) will the TMO turn. The real power kicks in when the 3 or 4 aggregations are aligned togather in one direction.
3. Position of the Higher Aggregation in Relation to the Extremes
- Overbought / oversold signals might not really work on the current aggregation. But pay attention to the higher aggregations in relation to the extremes. Ex: on the daily chart - daily TMO inside the OB / OS extremes might not mean much. But once the higher aggregations such as 3 day or Weekly TMO enters OB/OS zone togather with the daily, this can be a very powerful signal for a TMO reversion to the zeroline.
4. Crosses
- Yes, crosses do work. Personally, I never really focused on them. The thing about the crosses is that it is crucial to pick the right higher aggregation to the combination of the current one that would be reliable but also print enough signals. The closer the cross is to the OB / OS extremes, the more bigger move can occur. Crosses around the zero line can be considered as less quality crosses.
5. Divergences
- TMO can print awesome divergences. The best divergences are on the current aggregation (TMO agg. same as the chart) since the current agg. oscillates fast, it can usually produce lower lows & higher highs faster then any higher aggregations. Easy setup: wait for the higher aggregation to reach the OB / OS extremes and watch the current (chart) aggregation to print a divergence.
6. Three is Enough
- I personally find more than three aggregations messy and hard to read. But there is always the option to turn on the 4th one. Just switch the TMO 4 Main, TMO 4 Signal and TMO 4 Fill in the style settings.
Hope it helps.

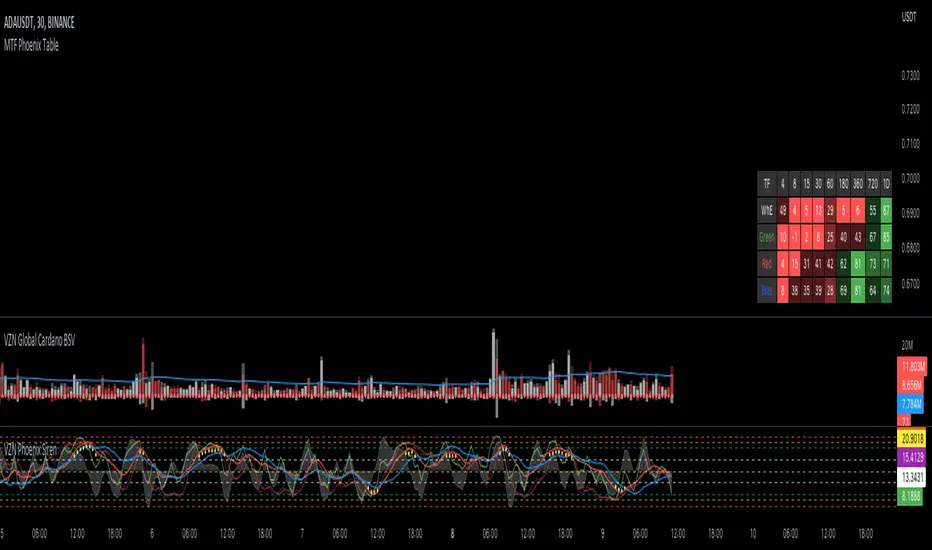
MTF Phoenix TableThis is a MTF heatmap companion for the Phoenix Ascending indicator by WyckoffMode. It aims to make MTF analysis easier at a quick glance.
The row headings are color coordinated for easy visual recognition.
MTF Stochastic, A versionHey everybody,
Here is a version of a MTF Stochastic script I wrote a while ago. The code is based on a formula written by Peter_O and the built in Tradingview Stochastic indicator. See this link to the original script of Peter_O. I use this formula a lot if I want to build in a Stochastic trend filter in my strategies. In this version I added options to plot different signals and trends.

MTF RSI & STOCH Strategy by kziThis script is a teaml job with Indicator-Johns.
First he used my script, then i transform his code.
The origine:
The first transformation:
www.tradingview.com
Funny moment together, thanks for that. :)
This sharing is an indicator where you can see the average of different time frames.
The RSI is the blue line
The Stock is the yellow line
You can manage the timeframe in the parameters.
The strategy is to take position when the two lines get overbought or oversold and close when the stoch and RSI goes to the middle.

MTF previous high and low quarter levelsDescription
An experimental script that prints quarter levels of the previous timeframe's high and low to the current timeframe. The idea is quite simple and is basically the Fibonacci pivoted on the previous high and low with quarter level settings (0,0.25,0.5,0.75,1 etc). The default setting is the previous daily high and low but can be customized on user discretion.
New quarter levels are printed after the close of the previous timeframe and open of the new timeframe (user's timeframe setting)
How To Use
Levels should not be used blindly. Levels can be used as confluence when aligned with high probability supply and demand zones, support, resistance, order blocks, and so on.
Credit to @HeWhoMustNotBeNamed for the Previous High/Low MTF indicator code and @mrbirman for the idea to put this together.

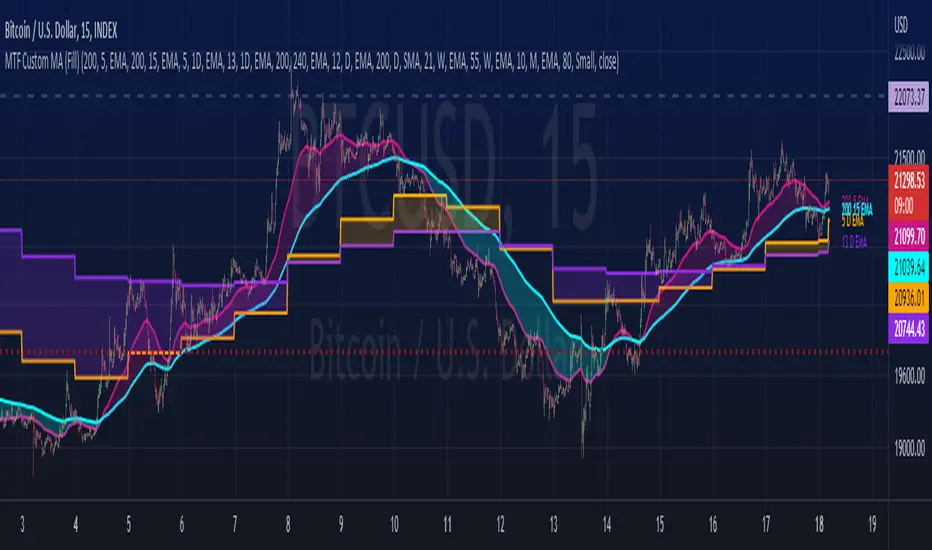
MTF Custom Moving AveragesThis user-friendly indicator allows up to 8 moving averages ( EMA or SMA ) from any timeframe, on any time frame. There are plenty of other MTF MA indicators, each with their own pros and cons. I wanted to make one without the cons:
- Independently set each MA to Exponential or Simple
- No preset lengths
- No preset timeframes
- Optional labels to help keep track of the period/length/type of each plot
- Clean, intuitive input layout
- More than enough MAs available to use one indicator for several use cases... just check/uncheck the ones that are relevant to each chart
Watch for death crosses on the 4hr while monitoring the "Bull Market Support band" (Weekly 21 EMA and 20 SMA ) and checking the Monthly 10 EMA for major support or resistance. Toggle between half of the available MAs for long term BTC trends and use the others for your alts. Use this one indicator to support multiple strategies.
Please leave a comment if you find it useful or have suggestions!
Inspired by the first MTF indicator I found: Weekly Moving Average by TommyTompsen.
MTF V trendSo i try to make this trend line based on MA volume that i created in the past
orange is downtrend, lime is uptrend
you have MTF function so you can put it on which time frame you want
if you want it to be exact on the candles then fix the tf to time in min
for example : on 4 hour candles put 240 and MTF of 4 hour
MTF Ichimoku CloudHere is my take on Ichimoku Cloud, Multiple Time Frames, based on the
most excellent work of "PineCoders" (MTF Selection Framework functions)!
The big advantage is that on 1 image you can easily see where
price is compared to Ichimoku Cloud patterns (each of different Time Frames).
This gives a lot of Support and Resistance area's!
I restricted the amount of MTF's at 2, more is just too messy
To make it more clear:
- Conversion line and Baseline in present timeframe : thick line
- Conversion line and Baseline in Higher Time Frame (HTF 1) : thin line
- Conversion line and Baseline in Higher Time Frame (HTF 2) : line with circles
All lines has labels at the right of the line with corresponding Time Frame
Since some prefer different settings with higher Time Frames,
each period in each Time Frame can be changed
The Time Frames itself can be chosen:
- or a multiple of present Time Frame
- or a fixed chosen Time Frame
Thanks!
DANI _ MTF Pullback StrategyMTF Pullback - RSI Panel Summary
Purpose: Companion indicator for the main strategy that displays RSI with divergence detection in a separate pane below the price chart.
Settings
ParameterDefaultDescriptionRSI Length14Lookback period for RSI calculationRSI Oversold Level30Threshold for oversold conditionRSI Overbought Level70Threshold for overbought conditionDivergence Lookback Bars10How many bars to look back for divergence detection
What It Displays
RSI Line — Changes color based on zone:
Purple = neutral (between 30-70)
Green = oversold (below 30)
Red = overbought (above 70)
Horizontal Levels:
Red dashed line at 70 (overbought)
Green dashed line at 30 (oversold)
Gray dotted line at 50 (midpoint)
Zone Fills:
Light red shading above 70
Light green shading below 30
Divergence Markers:
"DIV" label with lime circle = bullish divergence (price makes lower low, RSI makes higher low while oversold)
"DIV" label with fuchsia circle = bearish divergence (price makes higher high, RSI makes lower high while overbought)
Background Flash:
Green flash when bullish divergence detected
Red flash when bearish divergence detected
Divergence Logic
Bullish: Price makes a lower low AND RSI makes a higher low AND RSI is in oversold territory → potential reversal up
Bearish: Price makes a higher high AND RSI makes a lower high AND RSI is in overbought territory → potential reversal downand for the strategy15:36Outlined strategy script components and display mechanics.The user wants a summary of the main strategy script, similar to what I provided for the RSI panel. I should cover the purpose, settings, entry conditions, exit conditions, and what it displays on the chart.MTF Pullback Strategy Summary
Purpose: Multi-timeframe pullback strategy that trades trend continuations. Uses 4H timeframe for trend direction and entry timeframe (typically 15M) for precise entries based on RSI divergence and engulfing patterns.
Settings
ParameterDefaultDescriptionTimeframesHigher Timeframe240 (4H)Timeframe for trend detectionTrend FilterEMA Length50EMA period for trend directionRSIRSI Length14RSI calculation periodRSI Oversold Level30Long entry RSI thresholdRSI Overbought Level70Short entry RSI thresholdDivergence Lookback10Bars to scan for divergenceSwing DetectionSwing Lookback5Bars left/right to confirm swingRisk ManagementATR Length14ATR calculation periodStop Loss ATR Multiplier2.0SL = 2× ATR from entryTake Profit %2.0TP = entry ± 2%Trade DirectionTrade LongstrueEnable long tradesTrade ShortstrueEnable short trades
Entry Conditions
Long Entry (all must be true):
4H uptrend (price above 50 EMA + EMA rising)
Current price above 4H 50 EMA
Price pulling back from recent 4H swing high
RSI oversold (<30) or below 40
Bullish RSI divergence OR RSI turning up from oversold
Bullish engulfing candle at or within 2 bars after swing low
Short Entry (all must be true):
4H downtrend (price below 50 EMA + EMA falling)
Current price below 4H 50 EMA
Price pulling back from recent 4H swing low
RSI overbought (>70) or above 60
Bearish RSI divergence OR RSI turning down from overbought
Bearish engulfing candle at or within 2 bars after swing high
Exit Conditions
Exit TypeLongShortStop LossEntry - (2 × ATR)Entry + (2 × ATR)Take ProfitEntry × 1.02 (+2%)Entry × 0.98 (-2%)
What It Displays
On Chart:
Blue line = 4H 50 EMA
Green triangle below bar = long entry signal
Red triangle above bar = short entry signal
Green background tint = 4H uptrend active
Red background tint = 4H downtrend active
Info Table (top right):
FieldShows4H TrendUP ↑ / DOWN ↓ / NEUTRALPrice vs EMAABOVE / BELOWPullback LYES/NO (long pullback active)Pullback SYES/NO (short pullback active)Bull DivYES/NO (bullish divergence)Bear DivYES/NO (bearish divergence)
Strategy Logic Flow
4H TREND CHECK
↓
PRICE VS 50 EMA
↓
PULLBACK DETECTED?
↓
RSI CONDITION MET?
↓
RSI DIVERGENCE?
↓
ENGULFING AT SWING?
↓
ENTRY → SL (2×ATR) + TP (2%)
Alerts Available
Long Entry Signal — Triggers when all long conditions align
Short Entry Signal — Triggers when all short conditions align
Recommended Usage
Apply to 15-minute chart (fetches 4H data automatically)
Use alongside the RSI Panel indicator for visual confirmation
Backtest on trending pairs/assets (crypto, forex majors, indices)
Adjust ATR multiplier if stops are too tight/wide for your asset

DANI _ MTF Pullback - RSI PanelMTF Pullback - RSI Panel Summary
Purpose: Companion indicator for the main strategy that displays RSI with divergence detection in a separate pane below the price chart.
Settings
ParameterDefaultDescriptionRSI Length14Lookback period for RSI calculationRSI Oversold Level30Threshold for oversold conditionRSI Overbought Level70Threshold for overbought conditionDivergence Lookback Bars10How many bars to look back for divergence detection
What It Displays
RSI Line — Changes color based on zone:
Purple = neutral (between 30-70)
Green = oversold (below 30)
Red = overbought (above 70)
Horizontal Levels:
Red dashed line at 70 (overbought)
Green dashed line at 30 (oversold)
Gray dotted line at 50 (midpoint)
Zone Fills:
Light red shading above 70
Light green shading below 30
Divergence Markers:
"DIV" label with lime circle = bullish divergence (price makes lower low, RSI makes higher low while oversold)
"DIV" label with fuchsia circle = bearish divergence (price makes higher high, RSI makes lower high while overbought)
Background Flash:
Green flash when bullish divergence detected
Red flash when bearish divergence detected
Divergence Logic
Bullish: Price makes a lower low AND RSI makes a higher low AND RSI is in oversold territory → potential reversal up
Bearish: Price makes a higher high AND RSI makes a lower high AND RSI is in overbought territory → potential reversal down

MTF Volume Profile & Signal Scanner v5The MTF Signal Scanner is a multi-timeframe trading system designed for futures trading, particularly optimized for MNQ (Micro E-mini Nasdaq-100). It combines volume profile analysis, EMA trend filtering, and a confluence scoring system to identify high-probability trade setups.
