Nifty CPR by Foresight Trading📌 Indicator Name:
Nifty CPR by Foresight Trading
📖 Description:
This indicator plots the Central Pivot Range (CPR) along with the first resistance (R1) and first support (S1) levels, calculated from the previous day’s OHLC values.
Pivot (P) = (High + Low + Close) ÷ 3
BC (Bottom Central Pivot) = (High + Low) ÷ 2
TC (Top Central Pivot) = P + (P – BC)
R1 = (2 × Pivot) – Low
S1 = (2 × Pivot) – High
✅ The CPR and pivot levels are locked for the entire trading day, so they do not repaint intraday.
✅ Plotted as colored circles (dots) across the day for clear visibility.
✅ New levels are generated only at the start of a new session.
🎯 Usage:
Traders use CPR as a trend bias tool:
Narrow CPR → higher probability of trending day.
Wide CPR → higher probability of sideways/consolidation day.
R1 and S1 act as key intraday support & resistance zones.
⚡ Best For:
Intraday traders & scalpers
Index traders (Nifty, BankNifty, Stocks etc.)
Anyone who uses Pivot Point + CPR trading strategies
Cerca negli script per "nifty"

Nifty CPR by Foresight Trading📌 Indicator Name:
Nifty CPR by Foresight Trading
📖 Description:
This indicator plots the Central Pivot Range (CPR) along with the first resistance (R1) and first support (S1) levels, calculated from the previous day’s OHLC values.
Pivot (P) = (High + Low + Close) ÷ 3
BC (Bottom Central Pivot) = (High + Low) ÷ 2
TC (Top Central Pivot) = P + (P – BC)
R1 = (2 × Pivot) – Low
S1 = (2 × Pivot) – High
✅ The CPR and pivot levels are locked for the entire trading day, so they do not repaint intraday.
✅ Plotted as colored circles (dots) across the day for clear visibility.
✅ New levels are generated only at the start of a new session.
🎯 Usage:
Traders use CPR as a trend bias tool:
Narrow CPR → higher probability of trending day.
Wide CPR → higher probability of sideways/consolidation day.
R1 and S1 act as key intraday support & resistance zones.
⚡ Best For:
Intraday traders & scalpers
Index traders (Nifty, BankNifty, Stocks etc.)
Anyone who uses Pivot Point + CPR trading strategies

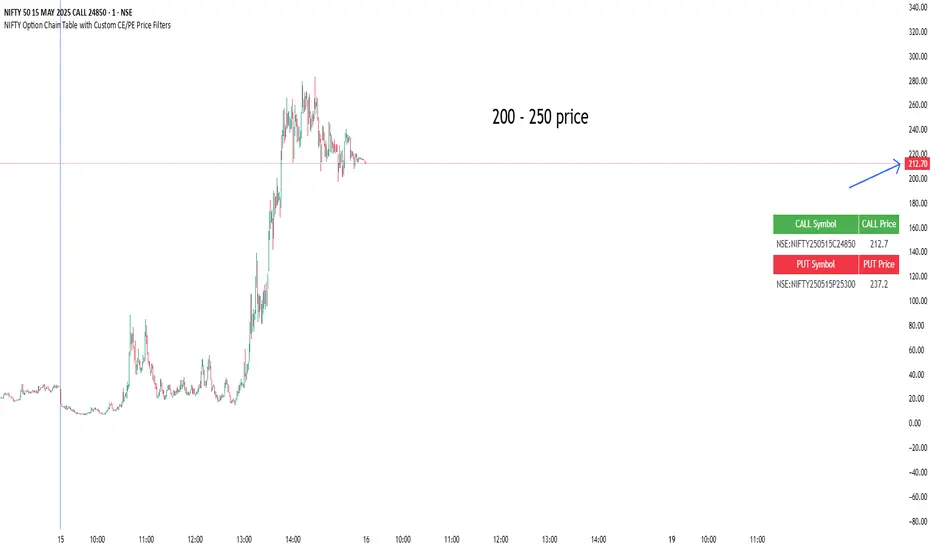
NIFTY Option Chain Table with Custom CE/PE Price FiltersThis Pine Script creates a powerful and visually organized option chain dashboard for NIFTY Index Options, showing 10 Call Options (CE) and 10 Put Options (PE), with real-time prices updated on a 5-minute chart.
You can filter and view only the most relevant option contracts based on your preferred price ranges, helping you make quick decisions for scalping, intraday, or positional trades.
🔍 How It Works:
You manually select up to 10 Call Option symbols and 10 Put Option symbols from NSE (e.g., NIFTY240530C18000, NIFTY240530P18000, etc.).
Keep that time options this are old options in defalt so there will be a error
The script fetches the real-time close price of each option using the request.security() function.
You define the minimum and maximum price range separately for Calls and Puts.
The script filters out any options that fall outside of your desired price range.
Only a limited number of matching options (as set by you) are displayed in the table for both Calls and Puts.
The table is shown at your preferred location on the chart (Bottom Right, Top Left, etc.).
✅ Features:
🔟 Supports exactly 10 CE and 10 PE options for tracking.
📈 Live price updates pulled directly from the chart timeframe (5-min).
🎯 Custom price filters for CE and PE (separate inputs).
📊 Show only the top X number of contracts that meet your filter criteria.
🧱 Vertical layout with clear headers and color-coded sections (green for Calls, red for Puts).
🎛️ Position the table wherever it's most convenient on your chart.
⚡ Helps you quickly spot low premium or range-bound options during the day.
📌 Use Case:
Ideal for:
Option scalpers and day traders who want to focus only on options within a specific price zone.
Traders who want to monitor multiple strikes simultaneously without clutter.
Users building custom NIFTY strategies based on option premiums.
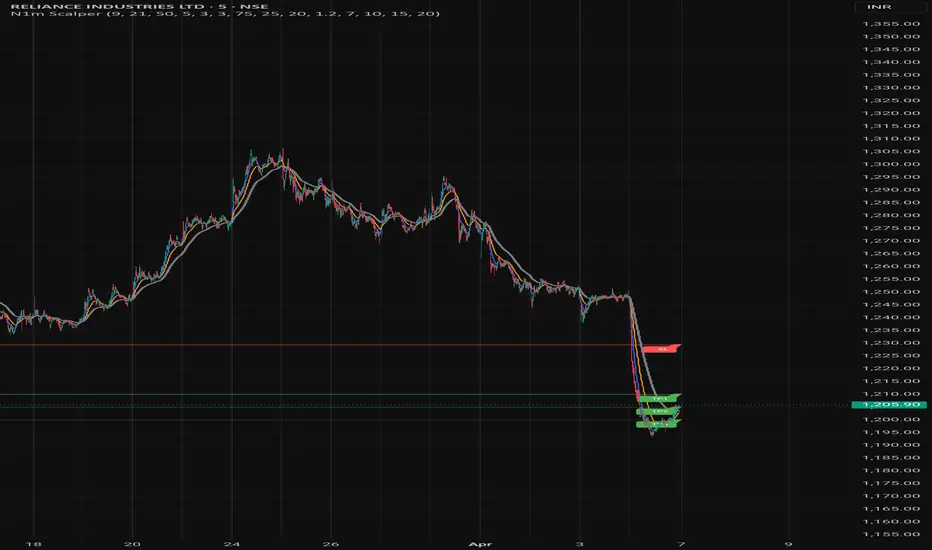
Nifty 1m EMA Pullback Scalper Signals
### **Master the Market with the Sniper Scalping Strategy for Nifty (1-Minute Timeframe)**
Unlock the power of precision trading with this expertly crafted **Sniper Scalping Strategy**, designed specifically for the Nifty index on a lightning-fast 1-minute timeframe. Perfect for traders who thrive on quick decisions and small, consistent profits, this strategy combines multiple indicators to deliver razor-sharp entries and exits—ideal for India’s dynamic market.
#### **Why This Strategy Stands Out**
- **Pinpoint Accuracy**: Harness the synergy of the **5 EMA and 10 EMA crossover** to lock onto the short-term trend, while the **Stochastic Oscillator (14,3,3)** times your entries and exits with surgical precision.
- **Fast and Effective**: Tailored for the 1-minute chart, this strategy capitalizes on Nifty’s volatility, targeting **10-point profits** with a tight **5-point stop-loss**—keeping your risk low and rewards high.
- **Trend + Momentum**: Blend trend-following (EMAs) with momentum signals (Stochastic) for a robust, multi-dimensional approach that cuts through market noise.
#### **How It Works**
- **Buy Signal**: Enter long when the 5 EMA crosses above the 10 EMA and the Stochastic rises above 20—catching the uptrend at its sweet spot.
- **Sell Signal**: Go short when the 5 EMA dips below the 10 EMA and the Stochastic falls below 80—riding the downtrend with confidence.
- **Exit Like a Pro**: Take profits at 10 points or when the Stochastic hits overbought/oversold extremes, ensuring you’re in and out before the market shifts.
#### **Perfect for Nifty Scalpers**
Built for the fast-paced world of Nifty trading, this strategy shines during high-volatility sessions like the market open or global overlaps. Whether you’re a beginner honing your skills or a seasoned trader seeking consistency, the Sniper Scalping Strategy offers a clear, actionable framework to scalp profits with discipline and precision.
#### **Get Started**
Test it in a demo account, refine it to your style, and watch your scalping game soar. Trade smart, stay focused, and let the Sniper Scalping Strategy turn Nifty’s 1-minute moves into your edge!
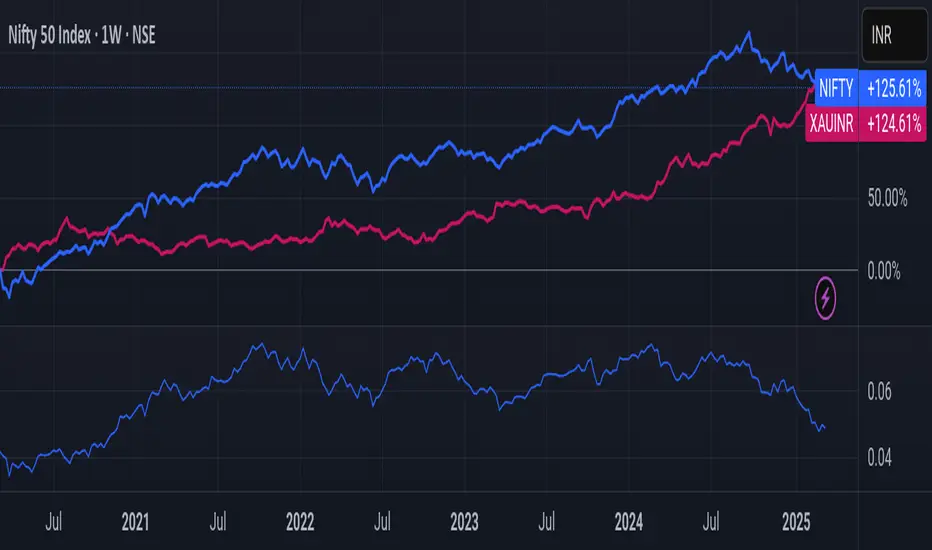
Nifty/Gold RatioPrice of NIFTY in GOLD. Highs indicate that Gold is getting cheaper, Lows indicate Nifty is getting cheaper.
NIFTY - Heatmap [DRK]Nifty 50 Heatmap by Percentage Change
This Pine Script generates a dynamic heatmap for the top 40 weighted stocks in the Nifty 50 index, ordered by their percentage change. The heatmap visually represents the performance of these stocks, with green indicating positive changes and red indicating negative changes.
Features :
Real-time Updates : The heatmap updates in real-time, providing an up-to-date snapshot of market performance.
Color Coding : Stocks are color-coded based on their percentage change, making it easy to identify gainers and losers at a glance.
Future Enhancements:
Indicator : Planned updates include popups or descriptions that provide additional insights, such as key indicators and their positive or negative signals.
Detailed Analysis : Future versions will offer more detailed analysis and insights to help traders make informed decisions.
Stay tuned for these exciting updates!

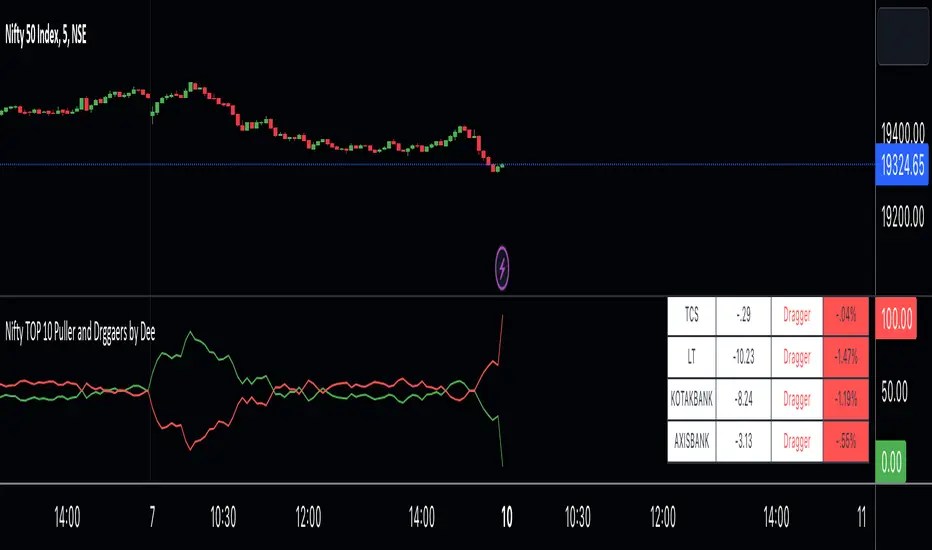
Nifty TOP 10 Puller and Drggaers by Deehi guys this is a straightforward indicator that shows the top 10 nitty pullers and dragger
How to use it ?
in the table, you can see the values of each puller and dragger well as their contribution amount and it will show if they puller or dragger
graph shows the puller and dragger using a line
both have max 100 points allocated
if they exceed the 100 points then a line will struck their ( point to remember ) it does not glitch
so it will give Ruf idea of who is strong
if buyers are strong then the green lien will always be upside
if sellers are string then the red line will always be upside
*Cross Over *
there are 2 types of cross over 1 is bull cross over other is bear cross over
when bulls are strong they will cross over the red from the bottom it showing that significantly strong
when bear is strong they will cross over the green from the bottom it shows that bear is significantly strong
hope you understand how to use it
we have limitation in trading view so we choose only 10 stock to calculate the %
NIFTY IT volumeKEY TAKEAWAYS
-Uses NIFTY IT Index Stocks Volume .
-NIFTY IT Volume Indicator is created by adding all 10 NIFTY IT Stocks Volume together.
-NIFTY IT Volume will be an important indicator in NIFTY IT Index technical analysis because it is used to measure the relative significance of a market move.
-The higher the volume during a NIFTY IT index price move, the more significant the move and the lower the volume during a NIFTY IT index price move, the less significant the move.
-Moving Average is also added.

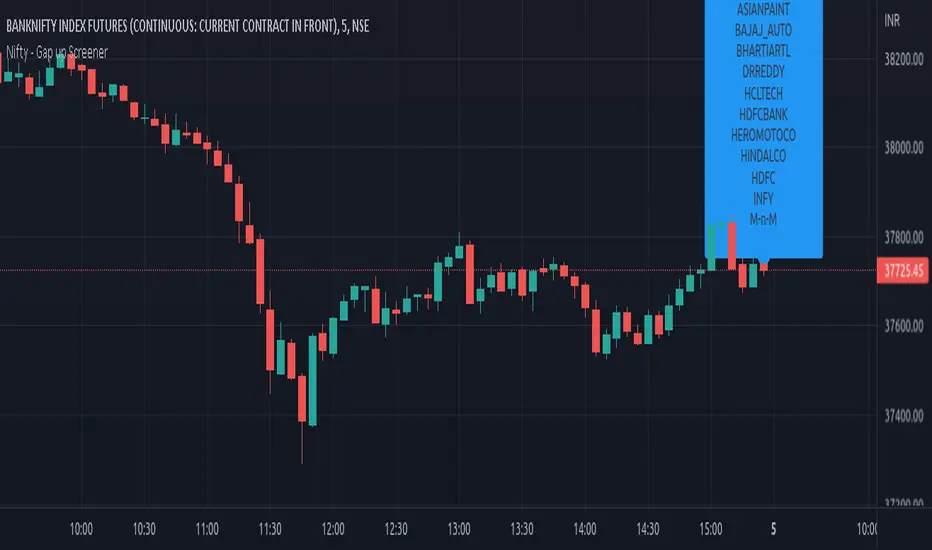
Nifty - Gap up Screener
Sample Stock Screener NSE is used to identify the list of Gap up Stocks from provided list. Modify script for other conditions
original credits: achalmeena ( )

Nifty & BN 2 Candle Theory Back Testing and Alert Notification How To Initiate Long Trade-in Index Future/ Buy Call Options – 3 Min TF
▪ If The Index Futures Trades Above The VWAP, the Following Parameters are Checked For 2 Candle Theory on the long side
▪ RSI Trades Above 50 & Between 50-75/80
▪ Volume Of 2 Consecutive Bars Is Above 50 K for BN & 125 K For Nifty
▪ All the indicators (Parabolic SAR, Super Trend, VMA, VWAP) Below the Candles
▪ When the above conditions are met enter In 3rd Candle, With 1st Candle High As SL
How I Initiate Short Trade-In Index Future/ Buy Put Options – 3 Min TF
▪ If The Index Futures Trades Below The VWAP, the Following Parameters are Checked For 2 Candle Theory on the short side
▪ RSI Trades Below 40 & Between 40-25/20
▪ Volume Of 2 Consecutive Bars Is Above 50 K for BN & 125 K For Nifty
▪ All the Indicators (Parabolic SAR, Super Trend, VMA, VWAP) Above The Candles
▪ When the above conditions are met enter In 3rd Candle, With 1st Candle High As SL
The indicator checks the above and notifies to enter a long trade and short trade respectively. There is also volume cutoff and change in the volumes respectively, also non-trading times that can be set.

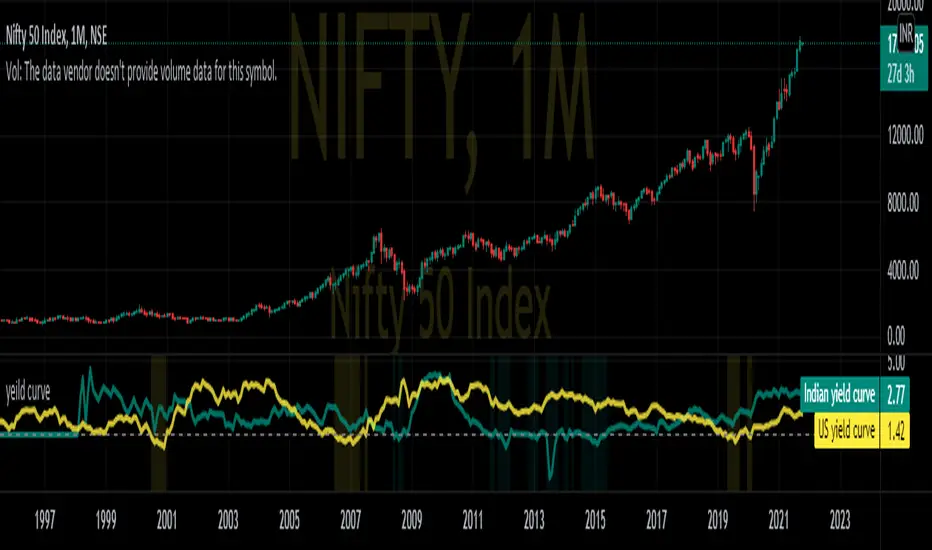
Nifty yield curveREAL-CASE SCENARIO:-
IN10Y(10yr yield t- bill) are govt. backed bonds provide basic interest or coupon rate. If the coupon rate falls below (yield =(1/price) the coupon rates of 3 month bond IN03MY(3m yield t- bill), investors are pessimistic about future growth of the economy.
This pessimistic behavior can be seen in the graph when change in background color.
While optimistic behavior scenario when investors no longer interested in long-term bonds and dumping 10Y T-bills causing yields to raise above short term 3m T-bill .
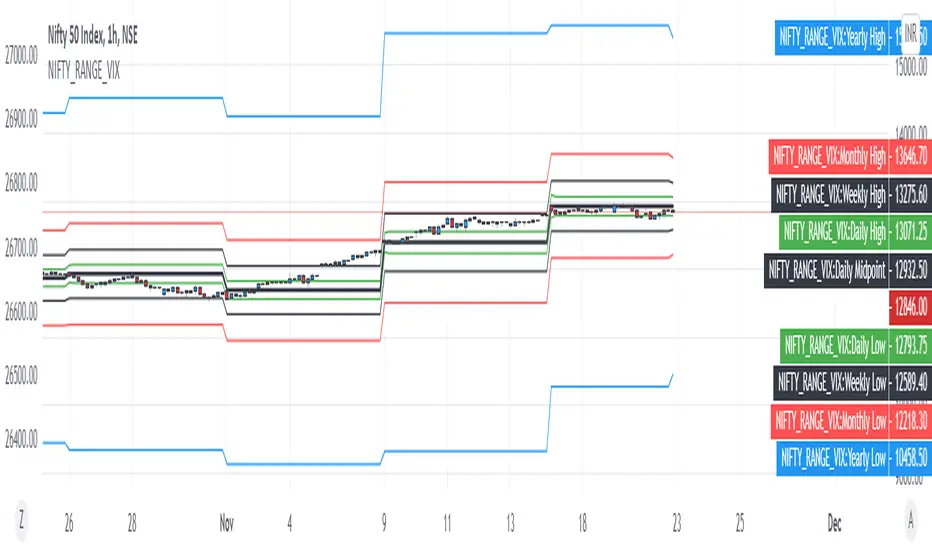
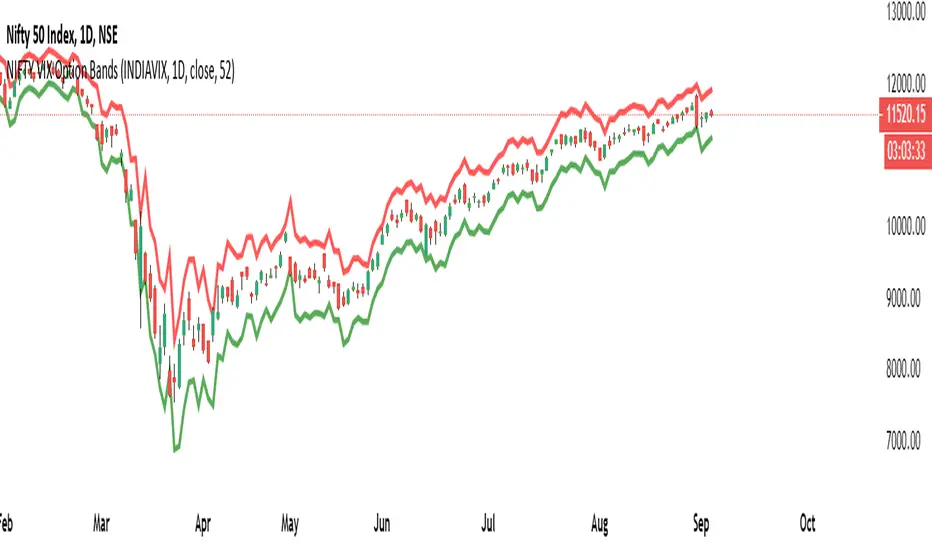
NIFTY VIX BANDSThis script can be used to visually identify the 1 standard deviation range of price movement anticipated by NSE ticker for Volatility Index NSE:INDIAVIX
Ideal to use on NSE:NIFTY ticker only!
The NIFTY range is extended to Yearly, Monthly, Weekly, Daily based on the current value of INDIAVIX.
All options are customizable:
Time frame of the VIX Bands
Select / De-select of Plots for Yearly, Monthly Weekly and Daily
NIFTY VIX Bands1) The script takes current INDIA VIX as input Daily time frame for NIFTY
2) Used a Formula VIX Value / Square root of Time Period
3) Change Timeframe input accordingly 1 Year = 1, Monthly = 12, Weekly = 52, Daily = 365
4) based point 2 formula with 1 standard deviation it creates upper & lower range bands
5) This is generally used for option selling by big traders they go and sell above the band strikes
Strategy:Reversal-CatcherWhat
This is a plain and vanilla reversal based strategy for intraday (15m) timeframe on Futures prices of the assets.
Now what all it comprises of?
It finds out the dynamic support & resistance from Bollinger Band (20 period, 1.5 std dev).
It finds out the potential divergence of price deviation from 5 period exponential moving average (EMA).
If the previous candle (N-1) shows a divergence it confirms the reversal by checking the present candle (N) to be closed inside the Bollinger Band.
It confirms the momentum by checking RSI shows a crossover/crossunder to oversold (30) / overbought (70) region.
It also confirms whether the trend is up (then only reversal trade to short) or down (then only reversal trade to long). The trend is checked with EMA-21 and EMA-50.
Re-affirmation Condition : It re-affirms the position of two successive candles called as `hhLLong` and `hhLLShort` in the script.
Why
In Indian context, retail participants are pre-dominantly (yes- 80% of Indian daily volume) Options buyers mainly in weekly indices (Nifty, BankNifty, FinNifty, CNXMidcap, Sensex, Bankx .. well everyday is expiry now in India, except -- Thank God -- Saturday & Sunday).
And in Index Options the momentum plays a big role.
If one can catch a good reversal point the potential of high Risk-to-Reward trade (hence earn handsomely) is very likely (please note: there is no holy grail in trading. Nothing works 100%).
So this is the attempt to catch a reversal.
Re-affirmation of Reversal
hhLLong : It's a reversal point after an uptrend. It checks the relative positioning of current candle compared to that of previous candle. [The details are in the script. Check for variable hhLLong in script.
hhLLShort : It's a reversal point after a downtrend. It checks the relative positioning of current candle compared to that of previous candle. [The details are in the script. Check for variable hhLLShort in script.
Unique-ness
What's unique in it? Why we decided to publicly share this:
Already given the context of The Great Indian Options Buyers community. It should be helpful to them, we believe.
It takes Very Less Number of Trades with High Accuracy . Please check the result in NSE:NIFTY1! in 15m timeframe. 71% accuracy with roughly a trade in a month.
There is no point giving brokers' the brokerages taking 10 trades a day and ending not-so-good EoD. Better lets take less trades with better result possibility. .
Mention
There are many people uses this variation of Bolling Band, 5EMA
Many people use RSI, trends and relative positioning of candles.
--> We are grateful to all of them. It's really difficult to mention everyone's name. But all people somehow influence the thought process. Thanks for all of them.
Statutory Disclaimer
There is no silver bullet / holy grail in trading. Nothing works 100% time. One has to be careful about the loss (s)he can bear in case of the trade goes against.
We, as the author of this script, is not responsible for any trading or position decision one is taken based on the outcome of this.
It is our sole discretion to change, add, delete the portion or withdraw the whole script without any prior notice or intimation.
In Indian Context : We are not SEBI registered, will never be SEBI registered.

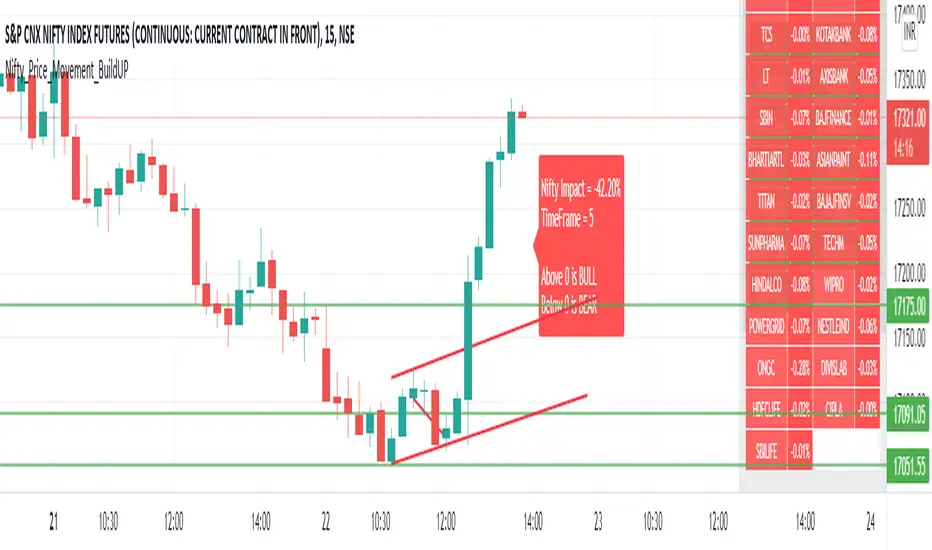
Nifty_Price_Movement_BuildUPDashboard to see Price Momentum Build-Up at Nifty.
It cumulates all prices and their respective weightage.
During initial of a candle, we are not aware of volume is High or Not, we only get it in later buildup. But Price buildup will display it at the same instant that what is going with the price of all stocks.
The logic used here is that
1) If a stock close > open at a particular instant it will add that stock multiplied with its weightage in Nifty to the list of stocks that are positive.
2) If a stock close < open at a particular instant it will add that stock multiplied with its weightage in Nifty to the list of stocks that are negative.
3) Above two will give you data that how many of them are positive and are negative at a particular instant and how they are going to affect Nifty.
In one of the many possible ways, it is superior than that of Volume buildup is that, to determine volume is higher than previous volume, we have to wait for first few seconds/minutes/hours (depending on timeframe you are in) to see volume buildup. The Volume buildup function based indicator is kind of lagging, though volume itself being instant.
BankNifty - VWAP + StdDev Bands- By Default the script draws Daily VWAP for Bank Nifty based on Futures Volume or underlying Index Stocks based on user input
- Optionally one may Anchor it to Week/Month etc or anchor it from a particular Time.
- It also draws 3 Standard Deviation Bands from the VWAP based on User Input.
- Optionally draws Previous VWAP Close for and Bullish or Bearish Move.
- It works with NIFTY 50 as well but only using Futures Volume(Pine limitation to number of security calls) . Please change the Symbol and Futures Volume symbol to "NSE:NIFTY" and "NSE:NIFTY1!" NSE:BANKNIFTY NSE:NIFTY

Index investingThe Index Investing indicator simplifies decision-making for adding to Index ETF's Long-term investments. By utilizing a percentage discount methodology, it highlights potential opportunities to enhance portfolios. This straightforward tool aids in identifying favorable moments to invest based on calculated price discounts from selected reference points, making the process more systematic and less subjective.
🔶 SETTINGS
Reference Price: Choose between 'All-Time-High' or 'Start of the Year' as the basis for calculating discount levels. This allows for flexibility in strategy depending on market conditions or investment philosophy.
Discount 1 %, Discount 2 %, Discount 3 %: These inputs define the percentage below the reference price at which buy signals are generated. They represent strategic entry points at discounted prices.
🔶 Default Parameters
The default parameters of 4.13%, 8.26%, and 12.39% for the discount levels are chosen based on the average 5-year return of the NSE:NIFTY Index, which stands at approximately 12.39%. By dividing this return into three parts, we obtain a structured approach to capturing potential upside at varying levels of market retracement, providing a logical basis for the selected default values.
Users have the flexibility to modify these parameters, tailoring the indicator to fit their unique approach and market outlook.
🔶 How Levels Are Calculated
Discount levels are calculated using the formula: Discount Price = Reference Price * (1 - Discount %) . This succinct approach establishes specific entry points below the chosen reference, such as an all-time high or the year's start price.
🔶 How Are the Buy Labels Generated
Buy signals are generated when the market price(Low of the candle) crosses under any of the defined discount levels. Each level has a corresponding buy label ('Buy 1', 'Buy 2', 'Buy 3'), which is activated upon the price crossing below the specified discount level and is only reset at the beginning of a new year or upon reaching a new reference high, ensuring signals are not repetitive for the same price level.
🔶 Other Features
Alerts: The indicator provides alerts for each buy signal, notifying potential entry points at their defined discount levels. The alert triggers only once per candle.
Year Marker: A vertical line with an accompanying label marks the start of each trading year on the chart. This feature aids in visualizing the temporal context of buy signals and reference price adjustments.

Chirag Strategy SMA with StopLossThe Moving Average Crossover trading strategy is possibly the most popular trading strategy in the world of trading. This strategy is a good example of so-called traditional strategies. Traditional strategies are always long or short. That means they are never out of the market. The concept of having a strategy that is always long or short may be scary, particularly in today’s market where you don’t know what is going to happen as far as risk on any one market. But a lot of traders believe that the concept is still valid, especially for those of traders who do their own research or their own discretionary trading.
This version uses crossover of simple moving averages of length 10 and 13. This strategy is best suitable for NIFTY and BANKNIFTY under 15min candlestick for intraday and 1hour candlestick for long-term.

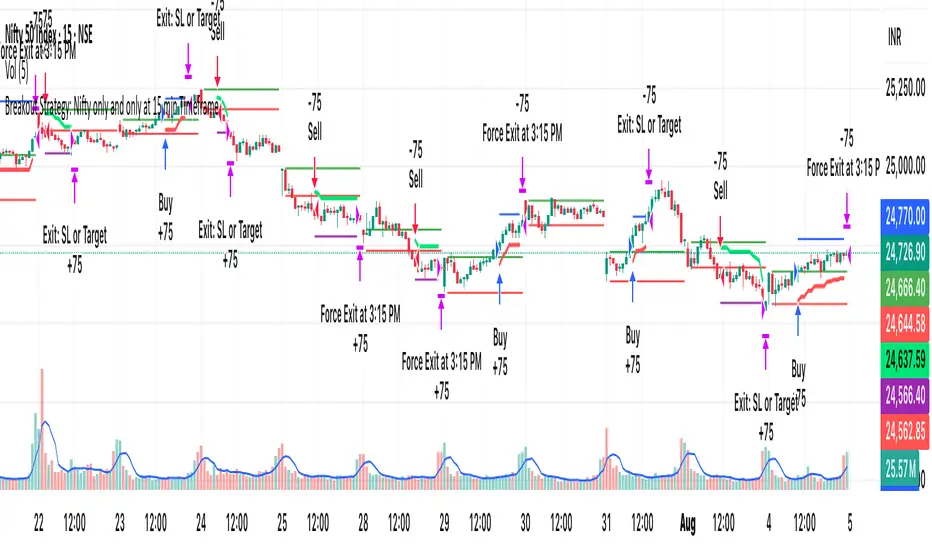
[PS]Breakout Strategy: Nifty/BN only at 15 min TimeframeIt only works on 15 min timeframe for nifty and Bank nifty.
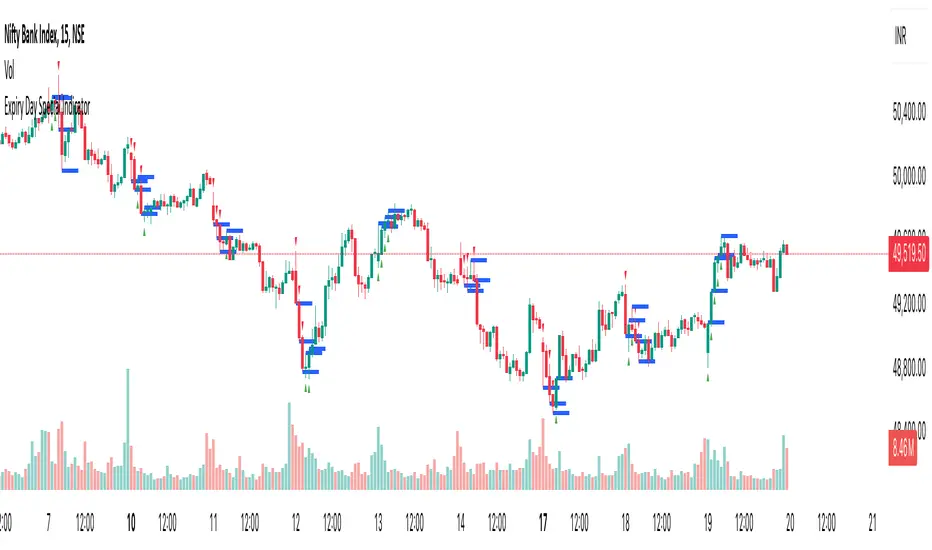
Expiry Day Special IndicatorExpiry Day Special Indicator
The Expiry Day Special Indicator is designed to detect catalytic price action patterns that commonly occur between 9:15 AM to 10:15 AM (IST) in the Nifty & Bank Nifty markets but not limited to these specific markets. While these patterns are particularly useful on expiry days, they are not limited to expiry trading alone. They can also be applied on other trading days when similar conditions arise, making them versatile for intraday traders.
How It Works
This indicator scans for bullish and bearish price action patterns within the first trading hour and plots potential buy and sell signals based on key market structures.
• Bearish Patterns: Identifies strong rejection zones and weakness in price action to signal potential short trades.
• Bullish Patterns: Recognizes reversal formations that indicate potential long trade opportunities.
• Time Filter: The setup is valid only between 9:15 AM - 10:15 AM (IST) to focus on high-impact market moves.
Why This Indicator?
1. Specialized for Nifty & Bank Nifty – Designed specifically for Indian markets.
2. Early Trend Identification – Helps traders capture moves early in the session.
3. Works Beyond Expiry Days – Although optimized for expiry trading, it can also detect similar patterns on regular days.
📌 Note: This indicator does not provide trading advice; always use proper risk management.
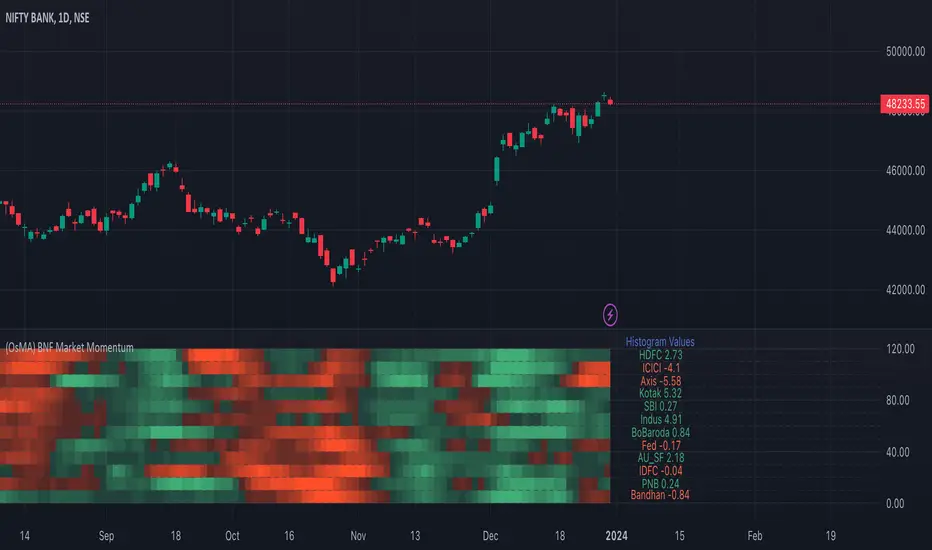
Bank Nifty Market Breadth (OsMA)This indicator is the market breadth for Bank Nifty (NSE:BANKNIFTY) index calculated on the histogram values of MACD indicator. Each row in this indicator is a representation of the histogram values of the individual stock that make up Bank Nifty. Components are listed in order of its weightage to Bank nifty index (Highest -> Lowest).
When you see Bank Nifty is on an uptrend on daily timeframe for the past 10 days, you can see what underlying stocks support that uptrend. The brighter the plot colour, the higher the momentum and vice versa. Looking at the individual rows that make up Bank Nifty, you can have an understanding if there is still enough momentum in the underlying stocks to go higher or are there many red plots showing up indicating a possible pullback or trend reversal.
The plot colours are shown as a percentage of the current histogram value taken from MACD from the highest histogram value of the previous 200 bars shown on the current timeframe. Look back value of 200 bars was chosen as it provided a better representation of the current value from its peak over the recent past(previous 200 bars), on all timeframes. Histogram value do grow/fall along with the underlying stock price, so choosing the chart's all-time high/low value as peak was not ideal. Labels on the right show the current histogram value.
Base Code taken from @fengyu05's S&P 500 Market Breadth indicator.
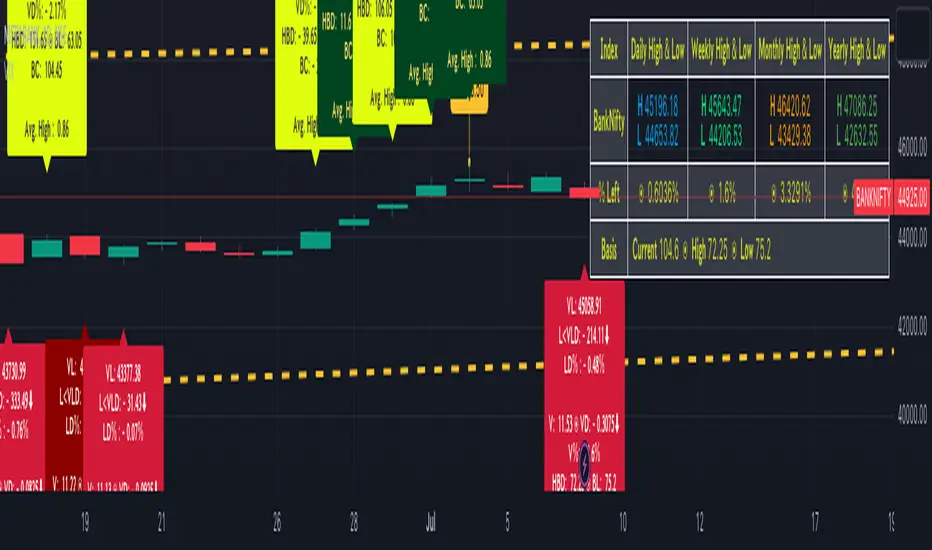
BankNifty targets using VIX Version 2Original Idea Credit: Verified Market Waves
Hi,
After watching different videos online on how to get targets of BankNifty & Nifty decided to write this small script using VIX.
Nothing great but I really like the concept of getting high and low targets for the day or weekly or monthly or yearly.
What does the script do
1. We get closing of India Vix & BankNifty and Nifty
2. We get square root of Daily (365 days) | Weekly (52) | Monthly (12) & Yearly (1)
3. We divide India Vix closing with different square root to get a decimal value.
4. We use the derived value from step 3 which is used as % to calculate high and low values on BankNifty close price.
Small explanation via below screen shot to understand how to use it.
As always it comes with source code so you can modify as per your requirement.
Hope it helps 👍