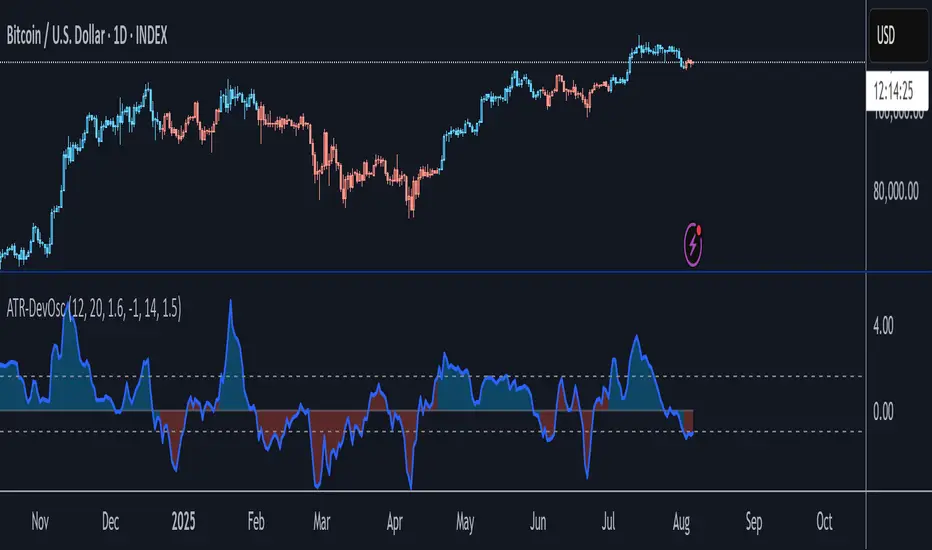
ATR-Scaled Deviation OscillatorATR-DevOsc is a custom momentum-and-volatility adaptive oscillator that scales N-bar price momentum by its rolling deviation and then reacts dynamically to sudden ATR spikes. By shrinking the deviation window when true volatility surges, it amplifies extreme moves—making medium-term trend shifts and deep drawdowns far more likely to breach your predefined thresholds.
Key features include:
• configurable momentum length and separate deviation length for precise control over look-back periods
• ATR Reaction Multiplier to tune how strongly sudden volatility spikes contract the deviation, boosting oscillator amplitude during extreme moves
• independent upper and lower threshold inputs for clear long/short signal definitions
• integrated candle-coloring overlay to immediately visualize trend state on your price chart
• built-in alert conditions for both oscillator-threshold crossovers and ATR-reactive triggers
This indicator is particularly useful for swing traders seeking medium-term entry and exit points in highly volatile markets like BTC. It combines normalized momentum readings with true volatility feedback, so large drawdowns or breakouts generate unmistakable signal events while routine noise stays filtered.
Note: ATR-DevOsc is provided “as is” without formal robustness or optimization testing. Past performance is not indicative of future results; use in live trading only after sufficient back-testing and validation.
Cerca negli script per "oscillator"
Normalized Linear Regression (LSMA) OscillatorNormalized Linear Regression (LSMA) Oscillator
By Nathan Farmer
The Normalized LSMA Oscillator is a trend-following indicator that enhances the classic Linear Regression (LSMA) by applying a range of normalization techniques. This indicator allows traders to smooth out and normalize LSMA signals for better trend detection and dynamic market adaptation.
Key Features:
Configurable Normalization Methods:
This indicator offers several normalization techniques, such as Z-Score, Min-Max, Mean Normalization, Robust Scaler, Logistic Function, and Quantile Transformation. Each method helps in refining LSMA outputs to improve clarity in both trending and ranging market conditions.
Smoothing Options:
Smoothing can be applied after normalization, helping to reduce noise in the signals, thus making trend-following strategies that use this indicator more effective.
Recommended Settings:
Logistic Function Normalization: Recommended length of around 12, based on my preferred signal frequency.
Z-Score Normalization: Medium period (close to the default of 50), based on my preferred signal frequency.
Min-Max Normalization: Medium period, based on my preferred signal frequency.
Mean Normalization: Medium period, based on my preferred signal frequency.
Robust Scaler: Medium period, based on my preferred signal frequency.
Quantile Transformation: Medium period, based on my preferred signal frequency.
Usage:
Designed primarily for trend-following strategies, this indicator adapts well to varying market conditions. Traders can experiment with the various normalization and smoothing settings to match the indicator to their specific needs and market preferences.
Recommendation before usage:
Always backtest the indicator for yourself with respect to how you intend to use it. Modify the parameters to suit your needs, over your preferred time frame, on your preferred asset. My preferences are for the assets I happened to be looking at when I made this indicator. Odds are, you're looking at something else, over a different time frame, in a different market environment than what my settings are tailored for.

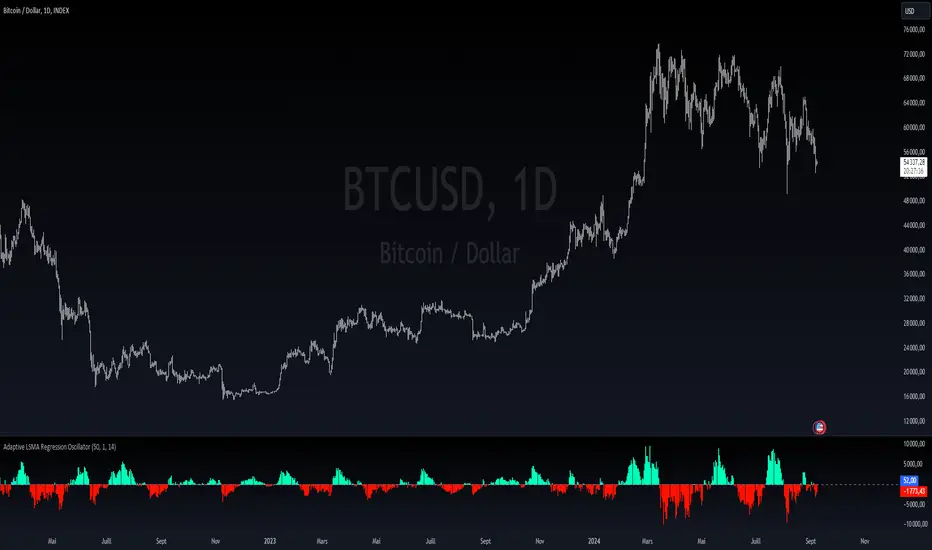
Adaptive LSMA Regression OscillatorOverview:
The Adaptive LSMA Regression Oscillator is an open-source technical analysis tool designed to reflect market price deviations from an adaptive least squares moving average (LSMA). The adaptive length of the LSMA changes dynamically based on the volatility of the market, making the indicator responsive to different market conditions.
Key Features:
Adaptive Length Adjustment : The base length of the LSMA is adjusted based on market volatility, measured by the Average True Range (ATR). The more volatile the market, the longer the adaptive length, and vice versa.
Oscillator : The indicator calculates the difference between the closing price and the adaptive LSMA. This difference is plotted as a histogram, showing whether prices are above or below the LSMA.
Color-Coded Histogram:
Positive values (where price is above the LSMA) are colored green.
Negative values (where price is below the LSMA) are colored red.
Debugging Information: The adaptive length is plotted for transparency, allowing users to see how the length changes based on the multiplier and ATR.
How It Works:
Inputs:
Base Length : This defines the starting length of the LSMA. It is adjusted based on market conditions.
Multiplier : A customizable multiplier is used to control how much the adaptive length responds to changes in volatility.
ATR Period : This determines the lookback period for the Average True Range calculation, a measure of market volatility.
Dynamic Adjustment:
The length of the LSMA is dynamically adjusted by multiplying the base length by a factor derived from ATR and the average close price.
This helps the indicator adapt to different market conditions, staying shorter during low volatility and longer during high volatility.
Example Use Cases:
Trend Analysis: By observing the oscillator, traders can see when prices deviate from a dynamically adjusted LSMA. This can be used to evaluate potential trend direction or changes in market behavior.
Volatility-Responsive Indicator: The adaptive length ensures that the indicator responds appropriately in both high and low volatility environments.
Uptrick: Adaptive Cloud Oscillator (ACO)### **Uptrick: Adaptive Cloud Oscillator (ACO)**
---
### Introduction
The **Uptrick: Adaptive Cloud Oscillator (ACO)** is an advanced technical analysis tool designed to empower traders with precise trend detection and visual clarity in dynamic market conditions. By seamlessly integrating adaptive trend analysis, volatility filtering, and cloud-based support and resistance levels, the ACO provides traders with the actionable insights needed to navigate complex markets with confidence.
This indicator is highly customizable, allowing traders to tailor its functionality to their specific trading style and preferences. Whether you're a trend follower, swing trader, or looking to identify key support and resistance zones, the **Uptrick: ACO** is an indispensable tool that can adapt to a variety of market conditions.
### Indicator Purpose and Functionality
#### 1. **Adaptive Trend Detection**
At the heart of the **Uptrick: ACO** lies its adaptive trend detection algorithm. Unlike traditional moving averages that may lag in volatile markets or react too slowly to rapid changes, this adaptive method uses a smoothing technique that dynamically adjusts based on market conditions. By doing so, it provides a more responsive trend line that captures meaningful price movements while filtering out minor fluctuations.
- **How It Works:** The trend line is calculated using an adaptive smoothing factor, making it responsive to recent price actions while maintaining a level of stability that prevents whipsaw signals. This ensures that traders are always in tune with the prevailing market trend, whether bullish, bearish, or neutral.
#### 2. **Dynamic Cloud Support and Resistance**
The **Uptrick: ACO** features a dynamic "cloud" that serves as a key element in its analysis. This cloud is constructed using a moving average combined with the Average True Range (ATR), which adjusts based on the market’s volatility. The cloud provides dynamic support and resistance levels, essential for identifying potential reversal zones or confirming trend continuations.
- **Cloud Displacement:** The cloud is displaced forward by a user-defined number of bars, offering a predictive view of where future support and resistance levels may lie. This forward-looking feature helps traders anticipate potential price movements, making the ACO a powerful tool for planning trades ahead of time.
#### 3. **Versatile Visualization Options**
The **Uptrick: ACO** is designed with flexibility in mind, allowing users to choose between two distinct display modes:
- **Buy/Sell Signals:** In this mode, the indicator generates clear buy and sell signals based on crossovers of the trend line and the cloud boundaries. These signals are visualized directly on the chart with up and down labels, making it easy for traders to identify potential entry and exit points.
- **Cloud Fill Only:** For traders who prefer a cleaner chart, this mode removes the buy/sell signals and instead focuses on coloring the area between the upper and lower cloud boundaries. The color of the cloud fill changes based on the trend direction, providing a visual representation of the market's momentum.
- **Optional EMA Line:** An Exponential Moving Average (EMA) line can be optionally displayed on the chart. The EMA serves as an additional trend filter, helping traders further refine their entries and exits. The length, color, and thickness of the EMA are fully customizable to fit individual trading strategies.
### Practical Applications
#### 1. **Trend Following and Reversals**
The **Uptrick: ACO** excels in identifying and following trends. By analyzing the relationship between the trend line and the cloud, traders can determine the strength and direction of the current market trend. The cloud’s dynamic nature means it can adapt to both trending and ranging markets, providing consistent insights regardless of market conditions.
- **Example:** If the trend line crosses above the upper cloud boundary, it signals a potential buy opportunity. Conversely, a cross below the lower cloud boundary suggests a sell opportunity. Traders can use these signals to enter trades aligned with the prevailing trend.
#### 2. **Support and Resistance Identification**
The forward-displaced cloud acts as a predictive support and resistance zone. Traders can use these zones to set stop-loss levels, determine take-profit targets, or identify potential reversal points.
- **Example:** When the price approaches the upper cloud boundary from below, the boundary may act as resistance, indicating a potential reversal or pullback. If the price breaks through this level, it may signal a continuation of the bullish trend.
#### 3. **Volatility-Based Analysis**
By incorporating ATR into its calculations, the **Uptrick: ACO** provides a built-in mechanism to adapt to varying levels of market volatility. This makes it particularly useful in markets prone to sudden spikes in volatility, such as during major economic announcements or geopolitical events.
- **Example:** In a high-volatility environment, the cloud widens, allowing for greater price fluctuations within the trend. Traders can use this information to adjust their risk management strategies, such as widening stop-loss levels during volatile periods to avoid being stopped out prematurely.
### Customization and Flexibility
The **Uptrick: ACO** is designed to be highly customizable, ensuring it can meet the needs of traders with different strategies and preferences. Key customization options include:
- **Cloud and Trend Settings:** Traders can adjust the length of the cloud, the smoothing factor for the trend line, and the displacement of the cloud to optimize the indicator for their specific market and timeframe.
- **Display Modes:** With a simple dropdown selection, traders can choose whether to display buy/sell signals or focus solely on the cloud fill, providing flexibility in how the indicator is visualized.
- **Color and Style Customization:** The colors for bullish and bearish trends, cloud fill, buy/sell signals, and the EMA line can all be customized, allowing traders to integrate the **Uptrick: ACO** seamlessly into their existing chart setups.
### Conclusion
The **Uptrick: Adaptive Cloud Oscillator (ACO)** is more than just a trend indicator—it's a comprehensive market analysis tool that provides traders with a deep understanding of market dynamics. Its combination of adaptive trend analysis, dynamic support and resistance levels, and versatile visualization options makes it an essential tool for traders looking to gain an edge in any market environment.
Whether you're a seasoned trader or just starting, the **Uptrick: ACO** offers the insights and flexibility needed to make informed trading decisions. By helping you identify trends, anticipate reversals, and adapt to changing market conditions, the **Uptrick: ACO** can significantly enhance your trading strategy and improve your overall trading performance.

FX Index Curve Oscillator (FICO)We can approximate the TVC:DXY with simple multiplication, rather than using geometric weighted averages; the values will be different, but the charts will look almost the same. Because we can make a "good enough" version of DXY, we can also extend this concept to the other major currencies:
AUD - Yellow
CAD - Red
CHF - Orange
EUR - Purple
GBP - Green
JPY - White
NZD - Lime green
USD - Blue
This indicator works by constructing an "index" for each currency, performing a lookback to figure out the rate of change, and then smoothing the values. These values are fed through an oscillator to normalize them between -1.00 and +1.00, before finally being smoothed again. Interestingly, using HMA to smooth them the second time will cause the values to leak past 1.00, which we can also use as a signal.
If you want to change the values, I find that the biggest difference comes from the lookback and oscillator settings; the MA/smoothing is probably good enough. The default settings are for doing forex trades on the daily chart. Other timeframes are possible, but I could not find any settings that work. It might also be possible to use a similar approach on other assets (crypto, metals, indexes, etc) but I have not tried yet.
In my own testing, what I found to be a good approach is to look for a currency to be above +1 and another to be below -1, and then look for color changes; ideally this will happen on the same bar/candle.
You can also consider two line crosses, breaking above or below 1, etc as other entry signals. I find that price will either move immediately, or take a candle or two to retrace and then start moving.
Happy trading!
Unfortunately, the indicator pane can get quite crowded; if you're testing for a single currency pair, you may want to disable some of the plotted lines:

Ichimoku OscillatorHello All,
This is Ichimoku Oscillator that creates different oscillator layers, calculates the trend and possible entry/exit levels by using Ichimoku Cloud features.
There are four layer:
First layer is the distance between closing price and cloud (min or max, depending on the main trend)
Second layer is the distance between Lagging and Cloud X bars ago (X: the displacement)
Third layer is the distance between Conversion and Base lines
Fourth layer is the distance between both Leadlines
If all layers are visible maning that positive according to the main trend, you can take long/short position and when main trend changed then you should close the position. so it doesn't mean you can take position when main trend changed, you need to wait for all other conditions met (all layers(
there is take profit partially option. if Conversion and base lines cross then you can take profit partially. Optionally you can take profit partially when EMA line crosses Fourth layer.
Optionally ATR (average true range) is used for Conversion and baseline for protection from whipsaws. you can use it to stay on the trend longer time.
I added options to enable/disable the alert and customize alert messages. You can change alert messages as you wish. if you use ' close ' in the alert message then you can get closing price in the alert message when the alert was triggered.
There is an option Bounce Off Support/Resistance , if there is trend and if the price bounce off Support/Resistance zone then a tiny triangle is shown.
There are many other options for coloring, alerts etc.
Some screenshots:
Main trend:
Taking/closing positions:
Example alert messages:
Bounce off:
Colors:
Colors:
Colors:
Non-colored background:
P.S. For a few months I haven't published any new script because of some health issues. hope to be healthy and create new scripts in 2024 :)
Enjoy!

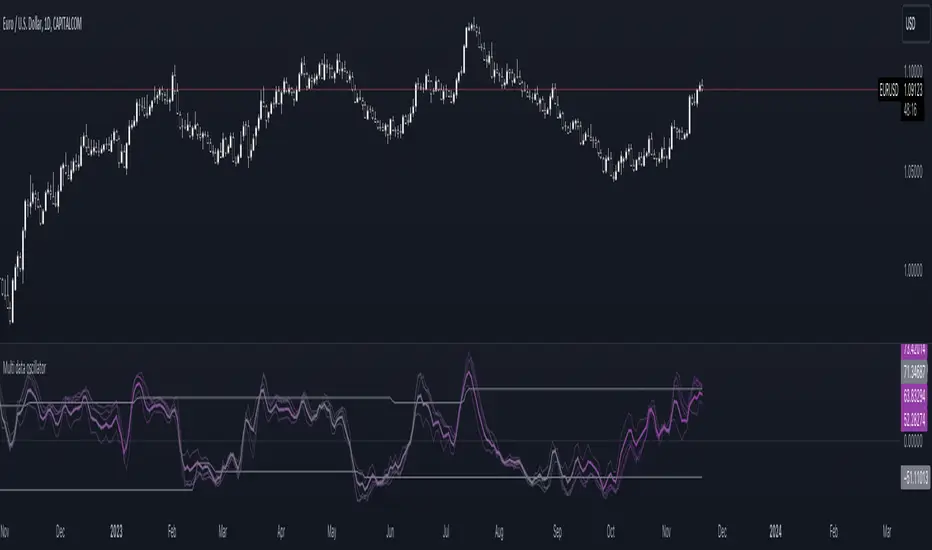
Multi-data oscillatorThe multi-data oscillator is a tool created to help traders visualize clearly how an oscillator works and moves considering different input parameters.
In this tool, you can choose to visualize the script as the RSI, the CCI, the LOC indicator, a custom-created formula that simply shows the location of the data considering X past values, or the average of all of these three indicators.
In the settings, you can choose both the length of the indicator and the smoothing factor.
Additionally, the indicator has a gradient color that changes considering the deviation and the variance of the different lines used to calculate the average line, displayed with more thickness.
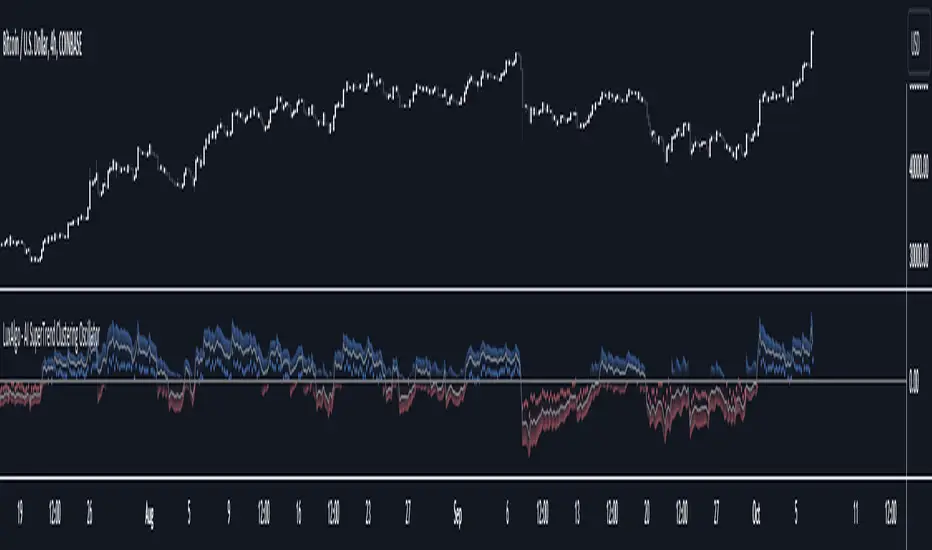
AI SuperTrend Clustering Oscillator [LuxAlgo]The AI SuperTrend Clustering Oscillator is an oscillator returning the most bullish/average/bearish centroids given by multiple instances of the difference between SuperTrend indicators.
This script is an extension of our previously posted SuperTrend AI indicator that makes use of k-means clustering. If you want to learn more about it see:
🔶 USAGE
The AI SuperTrend Clustering Oscillator is made of 3 distinct components, a bullish output (always the highest), a bearish output (always the lowest), and a "consensus" output always within the two others.
The general trend is given by the consensus output, with a value above 0 indicating an uptrend and under 0 indicating a downtrend. Using a higher minimum factor will weigh results toward longer-term trends, while lowering the maximum factor will weigh results toward shorter-term trends.
Strong trends are indicated when the bullish/bearish outputs are indicating an opposite sentiment. A strong bullish trend would for example be indicated when the bearish output is above 0, while a strong bearish trend would be indicated when the bullish output is below 0.
When the consensus output is indicating a specific trend direction, an opposite indication from the bullish/bearish output can highlight a potential reversal or retracement.
🔶 DETAILS
The indicator construction is based on finding three clusters from the difference between the closing price and various SuperTrend using different factors. The centroid of each cluster is then returned. This operation is done over all historical bars.
The highest cluster will be composed of the differences between the price and SuperTrends that are the highest, thus creating a more bullish group. The lowest cluster will be composed of the differences between the price and SuperTrends that are the lowest, thus creating a more bearish group.
The consensus cluster is composed of the differences between the price and SuperTrends that are not significant enough to be part of the other clusters.
🔶 SETTINGS
ATR Length: ATR period used for the calculation of the SuperTrends.
Factor Range: Determine the minimum and maximum factor values for the calculation of the SuperTrends.
Step: Increments of the factor range.
Smooth: Degree of smoothness of each output from the indicator.
🔹 Optimization
This group of settings affects the runtime performances of the script.
Maximum Iteration Steps: Maximum number of iterations allowed for finding centroids. Excessively low values can return a better script load time but poor clustering.
Historical Bars Calculation: Calculation window of the script (in bars).
OBV Oscillator Volume FilterOBV Oscillator Volume Filter
Introduction
The On-Balance Volume (OBV) is a widely-used technical indicator that aims to relate price and volume in trading. Price and volume are two of the most basic and yet crucial concepts in price movement. Together, they can reveal a lot about the instruments trends and the market's sentiment. This On Balance Volume (OBV) Oscillator incorporates enhanced features like a volume filter using a rolling window to detect outliers in accumulated volume, making it an advanced and more refined version of the standard OBV.
Interpreting the OBV Indicator
The primary function of the OBV is to accumulate volume. In simpler terms:
When the market closes higher than the previous candle, all of that candle's volume is considered 'up-volume'.
Conversely, when the market closes lower than the previous day, all of that candle's volume is considered 'down-volume'.
A rising OBV suggests that volume is being accumulated, indicating bullish market sentiment. A declining OBV, on the other hand, points to a bearish sentiment.
Features of the Script
1. Moving Averages Selection:
The script provides users with the option to select among six types of moving averages (EMA, DEMA, TEMA, SMA, WMA, HMA) to calculate the OBV. This feature offers flexibility and enables traders to choose an MA type they're most comfortable with or find the most effective.
2. Smoothing Option:
To reduce the inherent noise in the indicator, there's an option to apply smoothing. It uses a Simple Moving Average (SMA) to produce a clearer signal, making it easier for traders to interpret and respond to. If you don't want to use smoothing, just simply change the input length of smoothing to 1 in the settings.
3. Outlier Detection:
One of the standout features is the use of a rolling window to detect volume outliers. This ensures that the OBV only reacts to significant volume changes and isn't overly influenced by random spikes or drops. The volume filter is calculated based on a % of the highest OBV volume of X number of bars back. Users can adjust the time (# bars) and the sensitivity (%) of the volume filter. A longer timeperiode (# bars) and a higher % (sensitivity) in the settings result to less signals presented by the indicator.
4. Divergence Detection:
The script automatically highlights both regular and hidden divergences on the chart. Divergences can be a powerful signal of potential price reversals. This feature aids traders in spotting potential buy or sell opportunities based on divergences between price and OBV.
Regular Bullish Divergence: When the price makes lower lows, but the OBV makes higher lows.
Hidden Bullish Divergence: When the price makes higher lows, but the OBV makes lower lows.
Regular Bearish Divergence: When the price makes higher highs, but the OBV makes lower highs.
Hidden Bearish Divergence: When the price makes lower highs, but the OBV makes higher highs.
5. Alerts for Trend Reversals:
The script incorporates alerts that notify traders when the OBV indicates potential trend reversals. This feature can be instrumental in catching early entries or exits.
Disclaimer
It's crucial to understand that no single indicator should be used in isolation. To increase the probability of making accurate market predictions, always use the OBV Oscillator in conjunction with other indicators and tools. Remember that all trading involves risk, and it's possible to lose your invested capital. Always seek advice from a financial advisor before making any trading decisions. By enhancing the OBV with features like the volume filter, multiple MA types, smoothing, and divergence detection, this script becomes a potent tool in a trader's arsenal. Use it wisely, and always ensure to maintain proper risk management.

Trend Correlation Oscillator [SS]Hello,
Publishing this simple indicator.
What is it?
The Trend Correlation Oscillator takes the concept of my autocorrelation oscillator but applies it simply to time instead of autocorrelation.
It performs a correlation assessment to time. The theory behind it is the stronger the correlation, the more "exhausted" the trend and the more likely the trend will reverse. It is kind of building off of random walk theory in which the market should be random and efficient.
Does it work?
If you follow me on my indicator side, you will know that my indicators are all based on my own research and findings and stuff that I personally find that works. All of this comes from years of losing money trying to use conventional systems and finally developing my own stuff that I find works well. This is such an invention. It does work extremely well but its best applied for day traders. If you want to use this as a swing trader, play around with the lookback length. I don't have general recommendations to swing traders wanting to use this because this isn't an indicator I personally would use for swing trading (I would use the autocorrelation oscillator for that).
How to use it:
The default setting is to a 14 candle lookback. This works the best. It also should really be used on the 5 minute chart and not the 1 minute chart, as from my experience this works much better.
When a trend is approaching "exhaustion" to the upside, the indicator will turn red to let you know we are approaching a trend exhaustion. Once the exhaustion is at its peak and beginning to reverse, the indicator will place a cross symbol on where your entry should be. See the image below for an example:
It also works well if you combine it with my PTCR Correlation Indicator:
Closing thoughts
That is basically the indicator. Its one of my more simple ones, but many times simple is better and most effective!
Hopefully you find it helpful.
As always let me know your questions, comments and feedback/recommendations for improvements below.
Please know I do read and make note of all recommendations for indicators and improvements, however as it is just me managing them, it takes time for implementation and review :-).
Safe trades!

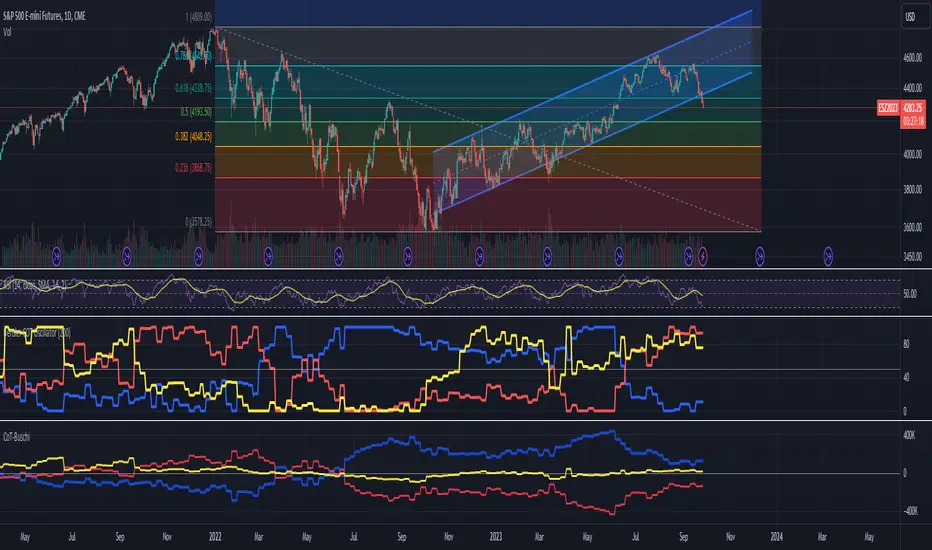
Bensler COT OscillatorI tried to replicate the indicator I think Jason Shapiro from Crowded Market Report has kind of alluded to on his interviews and YouTube channel. I think I made the default colors on my indicator match Shapiro's. It's best if used in parallel with the indicator CoT-Buschi which is a nice COT indicator that I based my oscillator off of. That way you can see the effect of the oscillator and decide if you like how the time period affects the output. I am a total noob so just in case you think I know what I'm talking about or doing, I don't.
Volume Accumulation Oscillator (VAO)The Volume Accumulation Oscillator (VAO) is a powerful momentum-based indicator designed to assess the strength of volume accumulation in a given asset. It helps traders identify periods of intense buying or selling pressure and potential trend reversals.
The VAO calculates the Net Volume Accumulation (NVA) by considering the volume, open, close, high, and low prices. It then applies exponential moving averages (EMAs) to smooth the NVA and calculates the VAO by comparing the smoothed NVA with its EMA over a specified signal period.
The VAO is plotted as a line chart, providing a clear visual representation of its values. Positive VAO values indicate strong bullish volume accumulation, suggesting potential upward price movement. Conversely, negative VAO values indicate significant selling pressure and the possibility of a downtrend.
To enhance the analysis, the indicator includes reference levels such as the zero line and +/-1 levels. These levels serve as important reference points for interpreting the VAO values and identifying key turning points in the market.
Additionally, the VAO histogram is included, which further illustrates the strength and direction of volume accumulation. The histogram bars are color-coded, with green bars representing positive VAO values and red bars representing negative VAO values.
The Volume Accumulation Oscillator is a versatile tool that can be used in various trading strategies. Traders can look for divergences between the VAO and the price chart to identify potential trend reversals. Combining the VAO with other technical analysis techniques can provide valuable insights into market dynamics and help traders make informed trading decisions.
Note: It is recommended to customize the indicator's parameters and conduct thorough backtesting to align it with your specific trading strategy and preferences before using it for live trading.
Disclaimer: This indicator is provided for educational and informational purposes only. Trading involves risks, and it is important to exercise caution and conduct your own analysis before making any investment decisions.

Implied Correlation Divergence OscillatorImplied Correlation Divergence Oscillator (ICDO)
ICDO uses an SMA calculation as a low-pass filter to determine divergences from trend. This can be useful for multiple strategies, including detecting overbought or oversold trends, and finding dispersion opportunities, including zero delta straddle plays using options for indices and single assets within the S&P 500 Index.
The aim of the oscillator is to provide a unique perspective on the existing signals provided by the CBOE (Chicago Board Options Exchange)
First choose from a variety of Implied Correlation symbols including: COR1M, COR3M, COR6M, COR9M, COR1Y, COR10D, COR30D, COR70D, COR90D
Then once an IC signal is chosen, configure the moving average (MA) as a customized low-pass filter that will determine the sensitivity of the divergence signal.
The resulting signal is an oscillator around the zero bound, which is color coded for bullish (green), or (bearish) signals.

Dynamic Linear Regression Oscillator | AdulariDescription:
This dynamic linear regression oscillator visualizes the general price trend of specific ranges in the chart based on the linear regression calculation, it automatically determines these ranges with pivot detection. The central line of the indicator is the baseline of the linear regression itself. This is a good tool to use to determine when a price is unusually far away from its baseline. The lines above or below it are overbought and oversold zones. These zones are based on the high or low of the range, in combination with the set multipliers.
The overbought and oversold lines indicate support and resistance; when the prices stay outside these levels for a significant period of time, a reversal can be expected soon. When the oscillator's value crosses above the signal or smoothed line the trend may become bullish. When it crosses below, the trend may become bearish.
This indicator is quite special, as it first determines price ranges using pivot detection. It then uses the middle of the range to determine how far the current price is from the baseline. This value is then rescaled compared to a set amount of bars back, putting it into relevant proportions with the current price action.
How do I use it?
Never use this indicator as standalone trading signal, it should be used as confluence.
When the value crosses above the signal this indicates the current bearish trend is getting weak and may reverse upwards.
When the value crosses below the signal this indicates the current bullish trend is getting weak and may reverse downwards.
When the value is above the middle line this shows the bullish trend is strong.
When the value is below the middle line this shows the bearish trend is strong.
When the value crosses above the upper line this indicates the trend may reverse downwards.
When the value crosses below the lower line this indicates the trend may reverse upwards.
Features:
Oscillator value indicating how far the price has currently deviated from the middle of the range. Proportioned to data from a set amount of bars ago.
Signal value to indicate whether or not the price is abnormally far from the middle of the range.
Horizontal lines such as oversold, overbought and middle lines, indicating possible reversal zones.
Automatic range detection using pivots.
Built-in rescaling functionality to ensure values are proportionate with the latest data.
How does it work? (simplified)
1 — Calculate the middle of the range.
2 — Define whether the current price is above the middle of the range or below.
3 — If above the middle of the range, calculate the difference of the current high and the middle line. If below, calculate the difference of the current low and the middle line.
4 — Smooth the value using a set moving average type.
5 — Rescale the value to proportionate it with the latest data.

True Momentum OscillatorThe True Momentum Oscillator (TMO) calculates the delta of the price using the open and close. We have taken the true momentum oscillator a step further and have added the momentum of the main signal (TMO) and the smooth signal line. We believe this helps give a clearer picture of price momentum and helps verify crossovers of the TMO and the smooth signal line. The momentum lines can also help confirm a divergence of the TMO. We have also added multiple moving average options so the user can customize the TMO to suit their needs.
TMO- Green when above Smooth Signal Line, red when below Smooth Signal Line
Smooth Signal- Gray Line
Histogram- TMO-Smooth Signal
TMO Momentum- Orange line
Smooth Signal Momentum- Yellow line
Overbought/Oversold regions- Gray highlighted boundaries
The TMO has defined overbought and oversold regions where either a crossover signal or divergence in the oscillator itself can be taken as a signal. Similar to the MACD, a crossover of the zero line by the TMO can also be utilized as a signal.

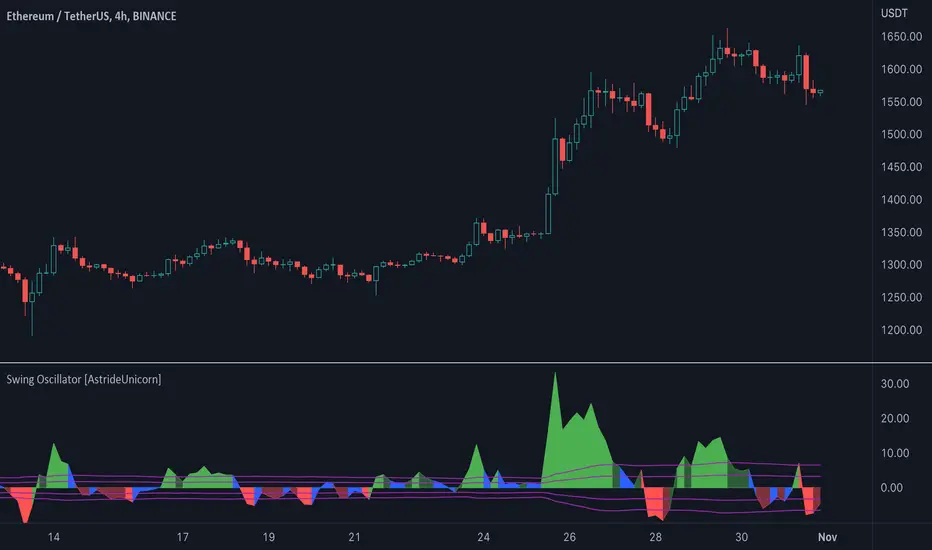
Swing Oscillator [AstrideUnicorn]The Swing Oscillator is an indicator that can help you catch small price movements, called swings. Swings are minor trends that occur when price moves between the highs and lows of a trend or range. Because of the short-term nature of swings, a new movement should be identified as soon as possible.
The indicator is based on our original formula, which averages the length of candlestick bodies and compares the result to several thresholds. This allows the algorithm to determine the direction and strength of the price movement.
HOW TO USE
When the indicator is above the zero level and colored green, it means that the price is in an upward swing. When the indicator is below the zero level and colored red, the price is in a downward swing. When the indicator is blue, the price swing is slowing down or the market is moving sideways. The amplitude of the oscillator shows the price volatility.
Bayesian BBSMA + nQQE Oscillator + Bank funds (whales detector)Three trend indicators in one. Fork of Gunslinger2005 indicator, with a fix to display the nQQE oscillator correctly and clearly, and converted to pinescript v5 (allowing to set a different timeframe and gaps).
How to use: Essentially, nQQE is a long term trend indicator which is more adequate in daily or weekly timeframe to indicate the current market cycle. Banker Fund seems better suited to indicate current local trend, although it is sensitive to relief rallies. Bayesian BBSMA is an awesome tool to visualize the buildup in bullish/bearish sentiment, and when it is more likely to get released, however it is unreliable, so it needs to be combined with other indicators.
Please show the original indicators some love:
Bayesian BBSMA:
nQQE:
L3 Banker Fund Flow Trend:
Originally mixed together by Gunslinger2005:

[blackcat] L1 Vitali Apirine Compare Price Momentum OscillatorLevel 1
Background
Traders’ Tips of August 2020, the focus is Vitali Apirine’s article in the August issue, “The Compare Price Momentum Oscillator (CPMO)”.
Function
In his article in this issue, “The Compare Price Momentum Oscillator (CPMO),” author Vitali Apirine reintroduces us to the DecisionPoint PMO originally developed by Carl Swenlin and presents a new way to use it to compare the relative momentum of two different securities. Trading signals can be derived in a number of ways including momentum, signal line, and zero-line crossovers.
Remarks
This is a Level 1 free and open source indicator.
Feedbacks are appreciated.

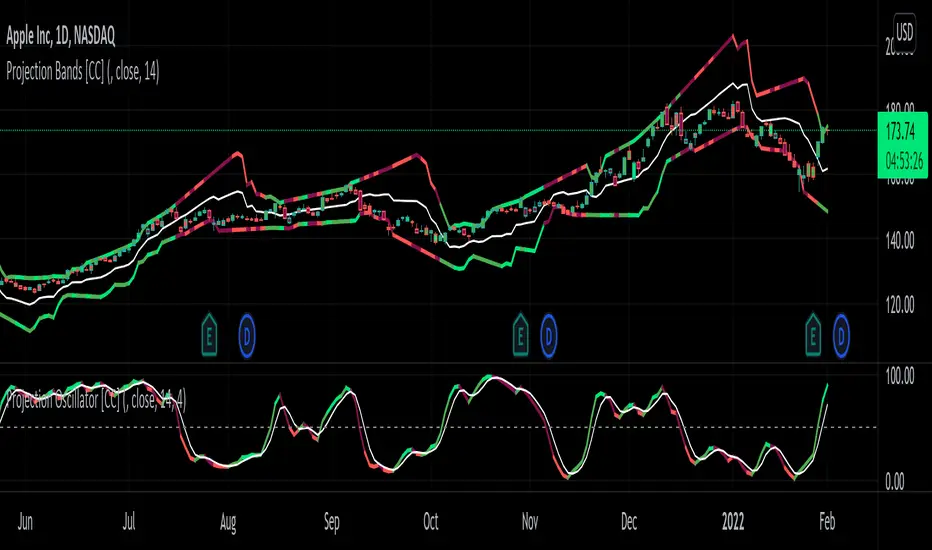
Projection Oscillator [CC]The Projection Oscillator was created by Mel Widner (Stocks and Commodities Jul 1995) and this is another hidden gem that is of course a great complementary indicator to my previous Projection Bands . I would recommend to use both on the same chart so you get the full array of information. This indicator tells you where the current price falls between the bands and the higher the oscillator is, the closer the price is to the upper band and vice versa. Now since the price never falls outside of the bands, the indicator is limited from 0 to 100. You will notice that with this indicator it gives even earlier signals than the Projection Bands so a very useful indicator indeed. I have included strong buy and sell signals in addition to normal ones so strong signals are darker in color and normal signals are lighter in color. Buy when the line turns green and sell when it turns red.
Let me know if there are any other indicators or scripts you would like to see me publish!
Volume Zone Oscillator (VZO)My interpretation of Walid Khalil's Volume Zone Oscillator (VZO) as published in the 2009 International Federation of Technical Analysis Journal.
This VZO indicator is also the same as Danielle Shay's popular Simpler Trading TurboVZO indicator.
ABOUT:
The oscillator breaks up volume activity into positive and negative categories. It is positive when the current closing price is greater than the prior closing price and negative when it's lower than the prior closing price. The resulting curve plots through relative percentage levels that yield a series of buy and sell signals, depending on level and indicator direction.
HOW TO USE THE INDICATOR:
The default period is 14 but can be adjusted after backtesting.
The VZO points to a positive trend when it rises above and maintains the 5% level, and a negative trend when it falls below the 5% level and fails to turn higher. Oscillations between the 5% and 40% levels mark a bullish trend zone, while oscillations between -40% and 5% mark a bearish trend zone. Meanwhile, readings above 40% signal an overbought condition, while readings above 60% signal an extremely overbought condition. Alternatively, readings below -40% indicate an oversold condition, which becomes extremely oversold below -60%.
Kahlil recommends confirming VZO signals with a 14-period average directional index (ADX), with values greater than 18 pointing to a trending market - search Tradingview's built-in indicators for the Directional Movement Index (DMI).
INTRADAY SCALPING:
Whilst the VZO is already smoothed with an exponential moving average, the indicator settings include an additional 'smoothing' function to remove any excess 'noise' in the plots for intraday use.

[Sextan] Delta-RSI Oscillator BacktestLevel: 1
NOTE: This is a request by @scantor516 to backtest Delta-RSI Oscillator by tbiktag with my Sextan framework. You can backtest many of my indicators in minutes now! Of course,you can define your own indicator in the highlighted area in compliance with the uniform format, which guarantee when you use "Indicator on Indicator" function, it would not produce any error.
Courtesy of tbiktag for his Delta-RSI Oscillator Strategy
Background
Backtesting of technical indicators and strategies is the most common way to understand a quantitative strategy. However, the complicated configuration and adaptation work of backtesting many quantitative tools makes many traders who do not understand the code daunted. Moreover, although I have written a lot of strategies, I am still not very satisfied with the backtest configuration and writing efficiency. Therefore, I have been thinking about how to build a backtesting framework that can quickly and easily evaluate the backtesting performance of any indicator with a "long/short entry" indicator, that is, a "simple backtesting tool for dummies". The performance requirements should be stable, and the operation should be simple and convenient. It is best to "copy", "paste", and "a few mouse clicks" to complete the quick backtest and evaluation of a new indicator.
Luckily, I recently realized that TradingView provides an "Indicator on Indicator" feature, which is the perfect foundation for doing "hot swap" backtesting. My basic idea is to use a two-layer design. The first layer is the technical indicator signal source that needs to be embedded, which is only used to provide buy and sell signals of custom strategies; the second layer is the trading system, which is used to receive the output signals of the first layer, and filter the signals according to the agreed specifications. , Take Profit, Stop Loss, draw buy and sell signals and cost lines, define and send custom buy and sell alert messages to mobile phones, social software or trading interfaces. In general, this two-layer design is a flexible combination of "death and alive", which can meet the needs of most traders to quickly evaluate the performance of a certain technical indicator. The first layer here is flexible. Users can insert their own strategy codes according to my template, and they can draw buy and sell signals and output them to the second layer. The second layer is fixed, and the overall framework is solidified to ensure the stability and unity of the trading system. It is convenient to compare different or similar strategies under the same conditions. Finally, all trading signals are drawn on the chart, and the output strategy returns. test report.
The main function:
The first layer: "{Sextan} Your Indicator Source", the script provides a template for personalized strategy input, and the signal and definition interfaces ensure full compatibility with the second layer. Backtesting is performed stably in the backtesting framework of the layer. The first layer of this script is also relatively simple: enter your script in the highlighted custom script area, and after ensuring the final buy and sell signals long = bool condition, short = bool condition, the design of the first layer is considered complete. Input it into the PINE script editor of TradingView, save it and add it to the chart, you can see the pulse sequence in yellow (buy) and purple (sell) on the sub-picture, corresponding to the main picture, you can subjectively judge that the quality of the trading point of the strategy is good Bad.
The second layer: "{Sextan} PINEv4 Sextans Backtest Framework". This script is the standardized trading system strategy execution and alarm, used to generate the final report of the strategy backtest and some key indicators that I have customized that I find useful, such as: winning rate , Odds, Winning Surface, Kelly Ratio, Take Profit and Stop Loss Thresholds, Trading Frequency, etc. are evaluated according to the Kelly formula. To use the second layer, first load it into the TrainingView chart, no markers will appear on the chart, since you have not specified any strategy source signals, click on the gear-shaped setting next to the "{Sextan} PINEv4 Sextans BTFW" header button, you can open the backtest settings, the first item is to select your custom strategy source. Because we have added the strategy source to the chart in the previous step, you can easily find an option "{Sextan} Your Indicator Source: Signal" at the bottom of the list, this is the strategy source input we need, select and confirm , you can see various markers on the main graph, and quickly generate a backtesting profit graph and a list of backtesting reports. You can generate files and download the backtesting reports locally. You can also click the gear on the backtest chart interface to customize some conditions of the backtest, including: initial capital amount, currency type, percentage of each order placed, amount of pyramid additions, commission fees, slippage, etc. configuration. Note: The configuration in the interface dialog overrides the same configuration implemented by the code in the backtest script.
How to output charts:
The first layer: "{Sextan} Your Indicator Source", the output of this script is the pulse value of yellow and purple, yellow +1 means buy, purple -1 means sell.
The second layer: PINEv4 Sextans Backtest Framework". The output of this script is a bit complicated. After all, it is the entire trading system with a lot of information:
1. Blue and red arrows. The blue upward arrow indicates long position, the red downward arrow indicates short position, and the horizontal bar at the end of the purple arrow indicates take profit or stop loss exit.
2. Red and green lines. This is the holding cost line of the strategy, green represents the cost of holding a long position, and red represents the cost of holding a short position. The cost line is a continuous solid line and the price action is relatively close.
3. Green and yellow long take profit and stop loss area and green and yellow long take profit and stop loss fork. Once a long position is held, there is a conditional order for take profit and stop loss. The green horizontal line is the long take profit ratio line, and the yellow is the long stop loss ratio line; the green cross indicates the long take profit price, and the yellow cross indicates the long position. Stop loss price. It's worth noting that the prongs and wires don't necessarily go together. Because of the optimization of the algorithm, for a strong market, the take profit will occur after breaking the take profit line, and the profit will not be taken until the price falls.
4. The purple and red short take profit and stop loss area and the purple red short stop loss fork. Once a short position is held, there will be a take profit and stop loss conditional order, the red is the short take profit ratio line, and the purple is the short stop loss ratio line; the red cross indicates the short take profit price, and the purple cross indicates the short stop loss price.
5. In addition to the above signs, there are also text and numbers indicating the profit and loss values of long and short positions. "L" means long; "S" means short; "XL" means close long; "XS" means close short.
TradingView Strategy Tester Panel:
The overview graph is an intuitive graph that plots the blue (gain) and red (loss) curves of all backtest periods together, and notes: the absolute value and percentage of net profit, the number of all closed positions, the winning percentage, the profit factor, The maximum trading loss, the absolute value and ratio of the average trading profit and loss, and the average number of K-lines held in all trades.
Another is the performance summary. This is to display all long and short statistical indicators of backtesting in the form of a list, such as: net profit, gross profit, Sharpe ratio, maximum position, commission, times of profit and loss, etc.
Finally, the transaction list is a table indexed by the transaction serial number, showing the signal direction, date and time, price, profit and loss, accumulated profit and loss, maximum transaction profit, transaction loss and other values.
Remarks
Finally, I will explain that this is just the beginning of this model. I will continue to optimize the trading system of the second layer. Various optimization feedback and suggestions are welcome. For valuable feedback, I am willing to provide some L4/L5 technical indicators as rewards for free subscription rights.

TASC 2022.02 Ehlers' Elegant Oscillator█ OVERVIEW
TASC's February 2022 edition of Traders' Tips includes the "Inverse Fisher Transform Redux — An Elegant Oscillator" article authored by John Ehlers. This is the code implementing the "Elegant Oscillator" from the article.
█ CONCEPTS
By applying the inverse Fisher transform to a waveform with a nominal Gaussian probability distribution using root mean square ( RMS ) scaling and smoothing the result, John Ehlers creates an oscillator that swings between -1 and 1.
█ CALCULATIONS
The calculation process uses the following steps:
• Compute the 2-bar difference of closing prices.
• Calculate the root mean square (RMS) of the differences.
• Scale the differences using the computed RMS.
• Apply the inverse Fisher transform to the scaled values.
• Smooth the transformed data with the SuperSmoother filter.
Join TradingView!

TFS Volume Oscillator Noise FilteredINTRODUCTION
This indicator is inspired from " HPotter’s TFS: Volume Oscillator " but I have used Heiken Ashi and Hull Moving Average in calculations in order to reduce noise for better trades.
The concept is similar to that of On-Balance Volume indicator (OBV). It is calculated according to these rules:
If Heiken Ashi Close > Heiken Ashi Open, Volume is positive
If Heiken Ashi Close < Heiken Ashi Open, Volume is negative
If Heiken Ashi Close = Heiken Ashi Open, Volume is neutral
BAR COLORS
Green Color:
Strong Uptrend with good volume supported momentum.
Faded Green Color:
Volume is relatively weakening.
Red Color:
Strong Downtrend with volume support.
Gray Color:
Downtrend negative volume is relatively weakening.
DEFAULTS SETTINGS
Volume length is 30 (Better for timeframes higher than 1H)
Hull Moving Average length is 14 but Linear Regression Curve can be selected with same length
