Fair Value Gap Oscillator | Flux Charts💎 GENERAL OVERVIEW
Introducing the new Fair Value Gap Oscillator (FVG Oscillator) indicator! This unique indicator identifies and tracks Fair Value Gaps (FVGs) in price action, presenting them in an oscillator format to reveal market momentum based on FVG strength. It highlights bullish and bearish FVGs while enabling traders to adjust detection sensitivity and apply volume and ATR-based filters for more precise setups. For more information about the process, check the "📌 HOW DOES IT WORK" section.
Features of the new FVG Oscillator:
Fully Customizable FVG Detection
An Oscillator Approach To FVGs
Divergence Markers For Potential Reversals
Alerts For Divergence Labels
Customizable Styling
📌 HOW DOES IT WORK?
Fair Value Gaps are price gaps within bars that indicate inefficiencies, often filled as the market retraces. The FVG Oscillator scans historical bars to identify these gaps, then filters them based on ATR or volume. Each FVG is marked as bullish or bearish according to the trend direction that preceded its formation.
An oscillator is calculated using recent FVGs with this formula :
1. The Oscillator starts as 0.
2. When a new FVG Appears, it contributes (FVG Width / ATR) to the oscillator of the corresponding type.
3. Each confirmed bar, the oscillator is recalculated as OSC = OSC * (1 - Decay Coefficient)
The oscillator aggregates and decays past FVGs, allowing recent FVG activity to dominate the signal. This approach emphasizes current market momentum, with oscillations moving bullish or bearish based on FVG intensity. Divergences are marked where FVG oscillations suggest potential reversals. Bullish Divergence conditions are as follows :
1. The current candlestick low must be the lowest of last 25 bars.
2. Net Oscillator (Shown in gray line by default) must be > 0.
3. The current Bullish FVG Oscillator value should be no more than 0.1 below the highest value from the last 25 bars.
Traders can use divergence signals to get an idea of potential reversals, and use the Net FVG Oscillator as a trend following marker.
🚩 UNIQUENESS
The Fair Value Gap Oscillator stands out by converting FVG activity into an oscillator format, providing a momentum-based visualization of FVGs that reveals market sentiment dynamically. Unlike traditional indicators that statically mark FVG zones, the oscillator decays older FVGs over time, showing only the most recent, relevant activity. This approach allows for real-time insight into market conditions and potential reversals based on oscillating FVG strength, making it both intuitive and powerful for momentum trading.
Another unique feature is the combination of customizable ATR and volume filters, letting traders adapt the indicator to match their strategy and market type. You can also set-up alerts for bullish & bearish divergences.
⚙️ SETTINGS
1. General Configuration
Decay Coefficient -> The decay coefficient for oscillators. Increasing this setting will result in oscillators giving the weight to recent FVGs, while decreasing it will distribute the weight equally to the past and recent FVGs.
2. Fair Value Gaps
Zone Invalidation -> Select between Wick & Close price for FVG Zone Invalidation.
Zone Filtering -> With "Average Range" selected, algorithm will find FVG zones in comparison with average range of last bars in the chart. With the "Volume Threshold" option, you may select a Volume Threshold % to spot FVGs with a larger total volume than average.
FVG Detection -> With the "Same Type" option, all 3 bars that formed the FVG should be the same type. (Bullish / Bearish). If the "All" option is selected, bar types may vary between Bullish / Bearish.
Detection Sensitivity -> You may select between Low, Normal or High FVG detection sensitivity. This will essentially determine the size of the spotted FVGs, with lower sensitivies resulting in spotting bigger FVGs, and higher sensitivies resulting in spotting all sizes of FVGs.
3. Style
Divergence Labels On -> You can switch divergence labels to show up on the chart or the oscillator plot.
Cerca negli script per "oscillator"

EMD Oscillator (Zeiierman)█ Overview
The Empirical Mode Decomposition (EMD) Oscillator is an advanced indicator designed to analyze market trends and cycles with high precision. It breaks down complex price data into simpler parts called Intrinsic Mode Functions (IMFs), allowing traders to see underlying patterns and trends that aren’t visible with traditional indicators. The result is a dynamic oscillator that provides insights into overbought and oversold conditions, as well as trend direction and strength. This indicator is suitable for all types of traders, from beginners to advanced, looking to gain deeper insights into market behavior.
█ How It Works
The core of this indicator is the Empirical Mode Decomposition (EMD) process, a method typically used in signal processing and advanced scientific fields. It works by breaking down price data into various “layers,” each representing different frequencies in the market’s movement. Imagine peeling layers off an onion: each layer (or IMF) reveals a different aspect of the price action.
⚪ Data Decomposition (Sifting): The indicator “sifts” through historical price data to detect natural oscillations within it. Each oscillation (or IMF) highlights a unique rhythm in price behavior, from rapid fluctuations to broader, slower trends.
⚪ Adaptive Signal Reconstruction: The EMD Oscillator allows traders to select specific IMFs for a custom signal reconstruction. This reconstructed signal provides a composite view of market behavior, showing both short-term cycles and long-term trends based on which IMFs are included.
⚪ Normalization: To make the oscillator easy to interpret, the reconstructed signal is scaled between -1 and 1. This normalization lets traders quickly spot overbought and oversold conditions, as well as trend direction, without worrying about the raw magnitude of price changes.
The indicator adapts to changing market conditions, making it effective for identifying real-time market cycles and potential turning points.
█ Key Calculations: The Math Behind the EMD Oscillator
The EMD Oscillator’s advanced nature lies in its high-level mathematical operations:
⚪ Intrinsic Mode Functions (IMFs)
IMFs are extracted from the data and act as the building blocks of this indicator. Each IMF is a unique oscillation within the price data, similar to how a band might be divided into treble, mid, and bass frequencies. In the EMD Oscillator:
Higher-Frequency IMFs: Represent short-term market “noise” and quick fluctuations.
Lower-Frequency IMFs: Capture broader market trends, showing more stable and long-term patterns.
⚪ Sifting Process: The Heart of EMD
The sifting process isolates each IMF by repeatedly separating and refining the data. Think of this as filtering water through finer and finer mesh sieves until only the clearest parts remain. Mathematically, it involves:
Extrema Detection: Finding all peaks and troughs (local maxima and minima) in the data.
Envelope Calculation: Smoothing these peaks and troughs into upper and lower envelopes using cubic spline interpolation (a method for creating smooth curves between data points).
Mean Removal: Calculating the average between these envelopes and subtracting it from the data to isolate one IMF. This process repeats until the IMF criteria are met, resulting in a clean oscillation without trend influences.
⚪ Spline Interpolation
The cubic spline interpolation is an advanced mathematical technique that allows smooth curves between points, which is essential for creating the upper and lower envelopes around each IMF. This interpolation solves a tridiagonal matrix (a specialized mathematical problem) to ensure that the envelopes align smoothly with the data’s natural oscillations.
To give a relatable example: imagine drawing a smooth line that passes through each peak and trough of a mountain range on a map. Spline interpolation ensures that line is as smooth and close to reality as possible. Achieving this in Pine Script is technically demanding and demonstrates a high level of mathematical coding.
⚪ Amplitude Normalization
To make the oscillator more readable, the final signal is scaled by its maximum amplitude. This amplitude normalization brings the oscillator into a range of -1 to 1, creating consistent signals regardless of price level or volatility.
█ Comparison with Other Signal Processing Methods
Unlike standard technical indicators that often rely on fixed parameters or pre-defined mathematical functions, the EMD adapts to the data itself, capturing natural cycles and irregularities in real-time. For example, if the market becomes more volatile, EMD adjusts automatically to reflect this without requiring parameter changes from the trader. In this way, it behaves more like a “smart” indicator, intuitively adapting to the market, unlike most traditional methods. EMD’s adaptive approach is akin to AI’s ability to learn from data, making it both resilient and robust in non-linear markets. This makes it a great alternative to methods that struggle in volatile environments, such as fixed-parameter oscillators or moving averages.
█ How to Use
Identify Market Cycles and Trends: Use the EMD Oscillator to spot market cycles that represent phases of buying or selling pressure. The smoothed version of the oscillator can help highlight broader trends, while the main oscillator reveals immediate cycles.
Spot Overbought and Oversold Levels: When the oscillator approaches +1 or -1, it may indicate that the market is overbought or oversold, signaling potential entry or exit points.
Confirm Divergences: If the price movement diverges from the oscillator's direction, it may indicate a potential reversal. For example, if prices make higher highs while the oscillator makes lower highs, it could be a sign of weakening trend strength.
█ Settings
Window Length (N): Defines the number of historical bars used for EMD analysis. A larger window captures more data but may slow down performance.
Number of IMFs (M): Sets how many IMFs to extract. Higher values allow for a more detailed decomposition, isolating smaller cycles within the data.
Amplitude Window (L): Controls the length of the window used for amplitude calculation, affecting the smoothness of the normalized oscillator.
Extraction Range (IMF Start and End): Allows you to select which IMFs to include in the reconstructed signal. Starting with lower IMFs captures faster cycles, while ending with higher IMFs includes slower, trend-based components.
Sifting Stopping Criterion (S-number): Sets how precisely each IMF should be refined. Higher values yield more accurate IMFs but take longer to compute.
Max Sifting Iterations (num_siftings): Limits the number of sifting iterations for each IMF extraction, balancing between performance and accuracy.
Source: The price data used for the analysis, such as close or open prices. This determines which price movements are decomposed by the indicator.
-----------------
Disclaimer
The information contained in my Scripts/Indicators/Ideas/Algos/Systems does not constitute financial advice or a solicitation to buy or sell any securities of any type. I will not accept liability for any loss or damage, including without limitation any loss of profit, which may arise directly or indirectly from the use of or reliance on such information.
All investments involve risk, and the past performance of a security, industry, sector, market, financial product, trading strategy, backtest, or individual's trading does not guarantee future results or returns. Investors are fully responsible for any investment decisions they make. Such decisions should be based solely on an evaluation of their financial circumstances, investment objectives, risk tolerance, and liquidity needs.
My Scripts/Indicators/Ideas/Algos/Systems are only for educational purposes!

Time-Decaying Percentile Oscillator [BackQuant]Time-Decaying Percentile Oscillator
1. Big-picture idea
Traditional percentile or stochastic oscillators treat every bar in the look-back window as equally important. That is fine when markets are slow, but if volatility regime changes quickly yesterday’s print should matter more than last month’s. The Time-Decaying Percentile Oscillator attempts to fix that blind spot by assigning an adjustable weight to every past price before it is ranked. The result is a percentile score that “breathes” with market tempo much faster to flag new extremes yet still smooth enough to ignore random noise.
2. What the script actually does
Build a weight curve
• You pick a look-back length (default 28 bars).
• You decide whether weights fall Linearly , Exponentially , by Power-law or Logarithmically .
• A decay factor (lower = faster fade) shapes how quickly the oldest price loses influence.
• The array is normalised so all weights still sum to 1.
Rank prices by weighted mass
• Every close in the window is paired with its weight.
• The pairs are sorted from low to high.
• The cumulative weight is walked until it equals your chosen percentile level (default 50 = median).
• That price becomes the Time-Decayed Percentile .
Find dispersion with robust statistics
• Instead of a fragile standard deviation the script measures weighted Median-Absolute-Deviation about the new percentile.
• You multiply that deviation by the Deviation Multiplier slider (default 1.0) to get a non-parametric volatility band.
Build an adaptive channel
• Upper band = percentile + (multiplier × deviation)
• Lower band = percentile – (multiplier × deviation)
Normalise into a 0-100 oscillator
• The current close is mapped inside that band:
0 = lower band, 50 = centre, 100 = upper band.
• If the channel squeezes, tiny moves still travel the full scale; if volatility explodes, it automatically widens.
Optional smoothing
• A second-stage moving average (EMA, SMA, DEMA, TEMA, etc.) tames the jitter.
• Length 22 EMA by default—change it to tune reaction speed.
Threshold logic
• Upper Threshold 70 and Lower Threshold 30 separate standard overbought/oversold states.
• Extreme bands 85 and 15 paint background heat when aggressive fade or breakout trades might trigger.
Divergence engine
• Looks back twenty bars.
• Flags Bullish divergence when price makes a lower low but oscillator refuses to confirm (value < 40).
• Flags Bearish divergence when price prints a higher high but oscillator stalls (value > 60).
3. Component walk-through
• Source – Any price series. Close by default, switch to typical price or custom OHLC4 for futures spreads.
• Look-back Period – How many bars to rank. Short = faster, long = slower.
• Base Percentile Level – 50 shows relative position around the median; set to 25 / 75 for quartile tracking or 90 / 10 for extreme tails.
• Deviation Multiplier – Higher values widen the dynamic channel, lowering whipsaw but delaying signals.
• Decay Settings
– Type decides the curve shape. Exponential (default 1.16) mimics EMA logic.
– Factor < 1 shrinks influence faster; > 1 spreads influence flatter.
– Toggle Enable Time Decay off to compare with classic equal-weight stochastic.
• Smoothing Block – Choose one of seven MA flavours plus length.
• Thresholds – Overbought / Oversold / Extreme levels. Push them out when working on very mean-reverting assets like FX; pull them in for trend monsters like crypto.
• Display toggles – Show or hide threshold lines, extreme filler zones, bar colouring, divergence labels.
• Colours – Bullish green, bearish red, neutral grey. Every gradient step is automatically blended to generate a heat map across the 0-100 range.
4. How to read the chart
• Oscillator creeping above 70 = market auctioning near the top of its adaptive range.
• Fast poke above 85 with no follow-through = exhaustion fade candidate.
• Slow grind that lives above 70 for many bars = valid bullish trend, not a fade.
• Cross back through 50 shows balance has shifted; treat it like a micro trend change.
• Divergence arrows add extra confidence when you already see two-bar reversal candles at range extremes.
• Background shading (semi-transparent red / green) warns of extreme states and throttles your position size.
5. Practical trading playbook
Mean-reversion scalps
1. Wait for oscillator to reach your desired OB/ OS levels
2. Check the slope of the smoothing MA—if it is flattening the squeeze is mature.
3. Look for a one- or two-bar reversal pattern.
4. Enter against the move; first target = midline 50, second target = opposite threshold.
5. Stop loss just beyond the extreme band.
Trend continuation pullbacks
1. Identify a clean directional trend on the price chart.
2. During the trend, TDP will oscillate between midline and extreme of that side.
3. Buy dips when oscillator hits OS levels, and the same for OB levels & shorting
4. Exit when oscillator re-tags the same-side extreme or prints divergence.
Volatility regime filter
• Use the Enable Time Decay switch as a regime test.
• If equal-weight oscillator and decayed oscillator diverge widely, market is entering a new volatility regime—tighten stops and trade smaller.
Divergence confirmation for other indicators
• Pair TDP divergence arrows with MACD histogram or RSI to filter false positives.
• The weighted nature means TDP often spots divergence a bar or two earlier than standard RSI.
Swing breakout strategy
1. During consolidation, band width compresses and oscillator oscillates around 50.
2. Watch for sudden expansion where oscillator blasts through extreme bands and stays pinned.
3. Enter with momentum in breakout direction; trail stop behind upper or lower band as it re-expands.
6. Customising decay mathematics
Linear – Each older bar loses the same fixed amount of influence. Intuitive and stable; good for slow swing charts.
Exponential – Influence halves every “decay factor” steps. Mirrors EMA thinking and is fastest to react.
Power-law – Mid-history bars keep more authority than exponential but oldest data still fades. Handy for commodities where seasonality matters.
Logarithmic – The gentlest curve; weight drops sharply at first then levels off. Mimics how traders remember dramatic moves for weeks but forget ordinary noise quickly.
Turn decay off to verify the tool’s added value; most users never switch back.
7. Alert catalogue
• TD Overbought / TD Oversold – Cross of regular thresholds.
• TD Extreme OB / OS – Breach of danger zones.
• TD Bullish / Bearish Divergence – High-probability reversal watch.
• TD Midline Cross – Momentum shift that often precedes a window where trend-following systems perform.
8. Visual hygiene tips
• If you already plot price on a dark background pick Bullish Color and Bearish Color default; change to pastel tones for light themes.
• Hide threshold lines after you memorise the zones to declutter scalping layouts.
• Overlay mode set to false so the oscillator lives in its own panel; keep height about 30 % of screen for best resolution.
9. Final notes
Time-Decaying Percentile Oscillator marries robust statistical ranking, adaptive dispersion and decay-aware weighting into a simple oscillator. It respects both recent order-flow shocks and historical context, offers granular control over responsiveness and ships with divergence and alert plumbing out of the box. Bolt it onto your price action framework, trend-following system or volatility mean-reversion playbook and see how much sooner it recognises genuine extremes compared to legacy oscillators.
Backtest thoroughly, experiment with decay curves on each asset class and remember: in trading, timing beats timidity but patience beats impulse. May this tool help you find that edge.

Ultimate Oscillator + DivergencesUltimate Oscillator (UO) + Divergences + Alerts + Lookback periods.
This version of the Ultimate Oscillator adds the following 3 additional features to the stock UO by Tradingview:
- Optional divergence lines drawn directly onto the oscillator.
- Configurable alerts to notify you when divergences occur.
- Configurable lookback periods to fine tune the divergences drawn in order to suit different trading styles and timeframes.
This indicator adds additional features onto the stock Ultimate Oscillator by Tradingview, whose core calculations remain unchanged. Namely the configurable option to automatically, quickly and clearly draw divergence lines onto the oscillator for you as they occur, with minimal delay. It also has the addition of unique alerts, so you can be notified when divergences occur without spending all day watching the charts. Furthermore, this version of the Ultimate Oscillator comes with configurable lookback periods, which can be configured in order to adjust the sensitivity of the divergences, in order to suit shorter or higher timeframe trading approaches.
The Ultimate Oscillator
Tradingview describes the Ultimate Oscillator as follows:
“The Ultimate Oscillator indicator (UO) indicator is a technical analysis tool used to measure momentum across three varying timeframes. The problem with many momentum oscillators is that after a rapid advance or decline in price, they can form false divergence trading signals. For example, after a rapid rise in price, a bearish divergence signal may present itself, however price continues to rise. The ultimate Oscillator attempts to correct this by using multiple timeframes in its calculation as opposed to just one timeframe which is what is used in most other momentum oscillators.”
More information on the history, use cases and calculations of the Ultimate Oscillator can be found here: www.tradingview.com
What are divergences?
Divergence is when the price of an asset is moving in the opposite direction of a technical indicator, such as an oscillator, or is moving contrary to other data. Divergence warns that the current price trend may be weakening, and in some cases may lead to the price changing direction.
There are 4 main types of divergence, which are split into 2 categories;
regular divergences and hidden divergences . Regular divergences indicate possible trend reversals, and hidden divergences indicate possible trend continuation.
Regular bullish divergence: An indication of a potential trend reversal, from the current downtrend, to an uptrend.
Regular bearish divergence: An indication of a potential trend reversal, from the current uptrend, to a downtrend.
Hidden bullish divergence: An indication of a potential uptrend continuation.
Hidden bearish divergence: An indication of a potential downtrend continuation.
Setting alerts.
With this indicator you can set alerts to notify you when any/all of the above types of divergences occur, on any chart timeframe you choose.
Configurable lookback values.
You can adjust the default lookback values to suit your prefered trading style and timeframe. If you like to trade a shorter time frame, lowering the default lookback values will make the divergences drawn more sensitive to short term price action.
How do traders use divergences in their trading?
A divergence is considered a leading indicator in technical analysis, meaning it has the ability to indicate a potential price move in the short term future.
Hidden bullish and hidden bearish divergences, which indicate a potential continuation of the current trend are sometimes considered a good place for traders to begin, since trend continuation occurs more frequently than reversals, or trend changes.
When trading regular bullish divergences and regular bearish divergences, which are indications of a trend reversal, the probability of it doing so may increase when these occur at a strong support or resistance level. A common mistake new traders make is to get into a regular divergence trade too early, assuming it will immediately reverse, but these can continue to form for some time before the trend eventually changes, by using forms of support or resistance as an added confluence, such as when price reaches a moving average, the success rate when trading these patterns may increase.
Typically, traders will manually draw lines across the swing highs and swing lows of both the price chart and the oscillator to see whether they appear to present a divergence, this indicator will draw them for you, quickly and clearly, and can notify you when they occur.
Disclaimer : This script includes code from the stock UO by Tradingview as well as the RSI divergence indicator.
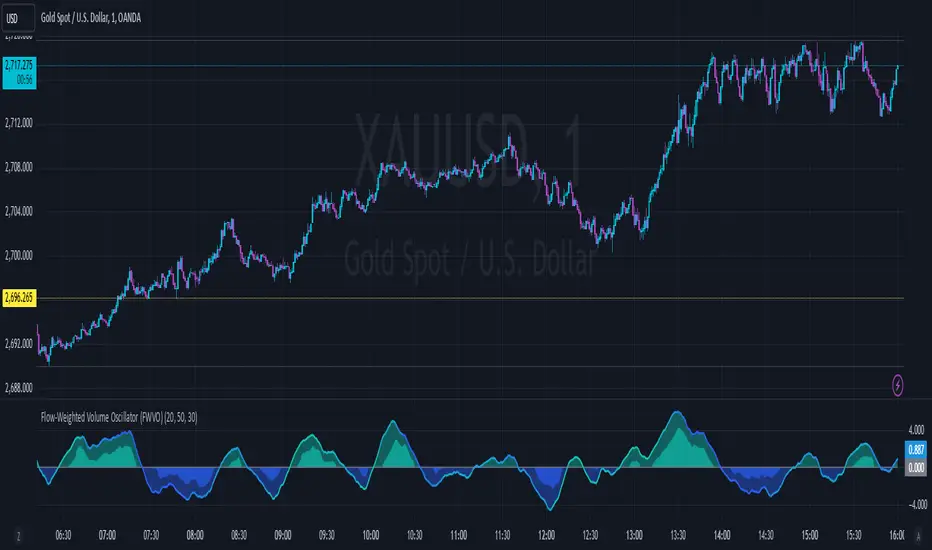
Flow-Weighted Volume Oscillator (FWVO)Volume Dynamics Oscillator (VDO)
Description
The Volume Dynamics Oscillator (VDO) is a powerful and innovative tool designed to analyze volume trends and provide traders with actionable insights into market dynamics. This indicator goes beyond simple volume analysis by incorporating a smoothed oscillator that visualizes the flow and momentum of trading activity, giving traders a clearer understanding of volume behavior over time.
What It Does
The VDO calculates the flow of volume by scaling raw volume data relative to its highest and lowest values over a user-defined period. This scaled volume is then smoothed using an exponential moving average (EMA) to eliminate noise and highlight significant trends. The oscillator dynamically shifts above or below a zero line, providing clear visual cues for bullish or bearish volume pressure.
Key features include:
Smoothed Oscillator: Displays the direction and momentum of volume using gradient colors.
Threshold Markers: Highlights overbought or oversold zones based on upper and lower bounds of the oscillator.
Visual Fill Zones: Uses color-filled areas to emphasize positive and negative volume flow, making it easy to interpret market sentiment.
How It Works
The calculation consists of several steps:
Smoothing with EMA: An EMA of the scaled volume is applied to reduce noise and enhance trends. A separate EMA period can be adjusted by the user (Volume EMA Period).
Dynamic Thresholds: The script determines upper and lower bounds around the smoothed oscillator, derived from its recent highest and lowest values. These thresholds indicate critical zones of volume momentum.
How to Use It
Bullish Signals: When the oscillator is above zero and green, it suggests strong buying pressure. A crossover from negative to positive can signal the start of an uptrend.
Bearish Signals: When the oscillator is below zero and blue, it indicates selling pressure. A crossover from positive to negative signals potential bearish momentum.
Overbought/Oversold Zones: Use the upper and lower threshold levels as indicators of extreme volume momentum. These can act as early warnings for trend reversals.
Traders can adjust the following inputs to customize the indicator:
High/Low Period: Defines the period for volume scaling.
Volume EMA Period: Adjusts the smoothing factor for the oscillator.
Smooth Factor: Controls the responsiveness of the smoothed oscillator.
Originality and Usefulness
The VDO stands out by combining dynamic volume scaling, EMA smoothing, and gradient-based visualization into a single, cohesive tool. Unlike traditional volume indicators, which often display raw or cumulative data, the VDO emphasizes relative volume strength and flow, making it particularly useful for spotting reversals, confirming trends, and identifying breakout opportunities.
The integration of color-coded fills and thresholds enhances usability, allowing traders to quickly interpret market conditions without requiring deep technical expertise.
Chart Recommendations
To maximize the effectiveness of the VDO, use it on a clean chart without additional indicators. The gradient coloring and filled zones make it self-explanatory, but traders can overlay basic trendlines or support/resistance levels for additional context.
For advanced users, the VDO can be paired with price action strategies, candlestick patterns, or other trend-following indicators to improve accuracy and timing.
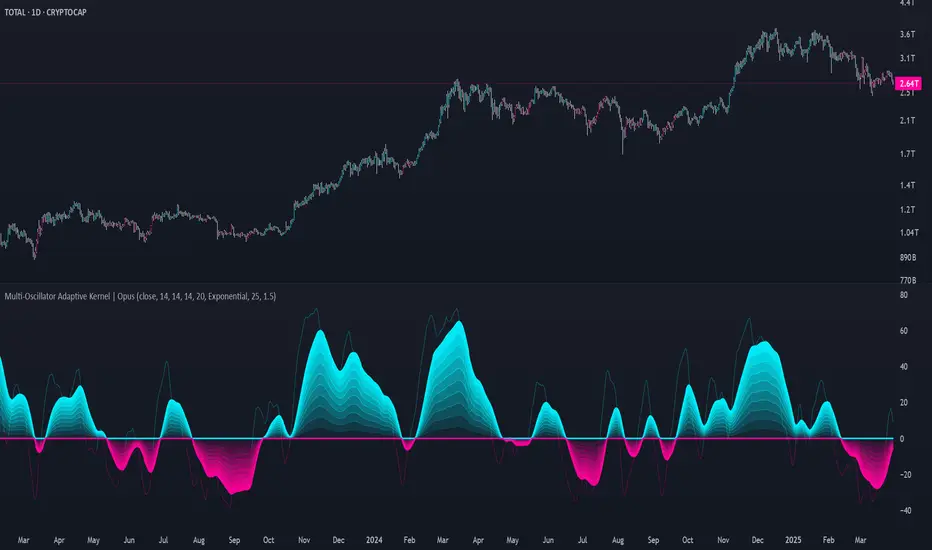
Multi-Oscillator Adaptive Kernel | AlphaAlgosMulti-Oscillator Adaptive Kernel | AlphaAlgos
Overview
The Multi-Oscillator Adaptive Kernel (MOAK) is an advanced technical analysis tool that combines multiple oscillators through sophisticated kernel-based smoothing algorithms. This indicator is designed to provide clearer trend signals while filtering out market noise, offering traders a comprehensive view of market momentum across multiple timeframes.
Key Features
• Fusion of multiple technical oscillators (RSI, Stochastic, MFI, CCI)
• Advanced kernel smoothing technology with three distinct mathematical models
• Customizable sensitivity and lookback periods
• Clear visual signals for trend shifts and reversals
• Overbought/oversold zones for precise entry and exit timing
• Adaptive signal that responds to varying market conditions
Technical Components
The MOAK indicator utilizes a multi-layer approach to signal generation:
1. Oscillator Fusion
The core of the indicator combines normalized readings from up to four popular oscillators:
• RSI (Relative Strength Index) - Measures the speed and change of price movements
• Stochastic - Compares the closing price to the price range over a specific period
• MFI (Money Flow Index) - Volume-weighted RSI that includes trading volume
• CCI (Commodity Channel Index) - Measures current price level relative to an average price
2. Kernel Smoothing
The combined oscillator data is processed through one of three kernel functions:
• Exponential Kernel - Provides stronger weighting to recent data with exponential decay
• Linear Kernel - Applies a linear weighting from most recent to oldest data points
• Gaussian Kernel - Uses a bell curve distribution that helps filter out extreme values
3. Dual Signal Lines
• Fast Signal Line - Responds quickly to price changes
• Slow Signal Line - Provides confirmation and shows the underlying trend direction
Configuration Options
Oscillator Selection:
• Enable/disable each oscillator (RSI, Stochastic, MFI, CCI)
• Customize individual lookback periods for each oscillator
Kernel Settings:
• Kernel Type - Choose between Exponential, Linear, or Gaussian mathematical models
• Kernel Length - Adjust the smoothing period (higher values = smoother line)
• Sensitivity - Fine-tune the indicator's responsiveness (higher values = more responsive)
Display Options:
• Color Bars - Toggle price bar coloring based on indicator direction
How to Interpret the Indicator
Signal Line Direction:
• Upward movement (teal) indicates bullish momentum
• Downward movement (magenta) indicates bearish momentum
Trend Shifts:
• Small circles mark the beginning of new uptrends
• X-marks indicate the start of new downtrends
Overbought/Oversold Conditions:
• Values above +50 suggest overbought conditions (potential reversal or pullback)
• Values below -50 suggest oversold conditions (potential reversal or bounce)
Trading Strategies
Trend Following:
• Enter long positions when the signal line turns teal and shows an uptrend
• Enter short positions when the signal line turns magenta and shows a downtrend
• Use the slow signal line (area fill) as confirmation of the underlying trend
Counter-Trend Trading:
• Look for divergences between price and the indicator
• Consider profit-taking when the indicator reaches overbought/oversold areas
• Wait for trend shift signals before entering counter-trend positions
Multiple Timeframe Analysis:
• Use the indicator across different timeframes for confirmation
• Higher timeframe signals carry more weight than lower timeframe signals
Best Practices
• Experiment with different kernel types for various market conditions
• Gaussian kernels often work well in ranging markets
• Exponential kernels can provide earlier signals in trending markets
• Combine with volume analysis for higher probability trades
• Use appropriate stop-loss levels as the indicator does not guarantee price movements
This indicator is provided as-is with no guarantees of profit. Always use proper risk management when trading with any technical indicator. Nothing is financial advise.
Adaptive Oscillator constructor [lastguru]Adaptive Oscillators use the same principle as Adaptive Moving Averages. This is an experiment to separate length generation from oscillators, offering multiple alternatives to be combined. Some of the combinations are widely known, some are not. Note that all Oscillators here are normalized to -1..1 range. This indicator is based on my previously published public libraries and also serve as a usage demonstration for them. I will try to expand the collection (suggestions are welcome), however it is not meant as an encyclopaedic resource , so you are encouraged to experiment yourself: by looking on the source code of this indicator, I am sure you will see how trivial it is to use the provided libraries and expand them with your own ideas and combinations. I give no recommendation on what settings to use, but if you find some useful setting, combination or application ideas (or bugs in my code), I would be happy to read about them in the comments section.
The indicator works in three stages: Prefiltering, Length Adaptation and Oscillators.
Prefiltering is a fast smoothing to get rid of high-frequency (2, 3 or 4 bar) noise.
Adaptation algorithms are roughly subdivided in two categories: classic Length Adaptations and Cycle Estimators (they are also implemented in separate libraries), all are selected in Adaptation dropdown. Length Adaptation used in the Adaptive Moving Averages and the Adaptive Oscillators try to follow price movements and accelerate/decelerate accordingly (usually quite rapidly with a huge range). Cycle Estimators, on the other hand, try to measure the cycle period of the current market, which does not reflect price movement or the rate of change (the rate of change may also differ depending on the cycle phase, but the cycle period itself usually changes slowly).
Chande (Price) - based on Chande's Dynamic Momentum Index (CDMI or DYMOI), which is dynamic RSI with this length
Chande (Volume) - a variant of Chande's algorithm, where volume is used instead of price
VIDYA - based on VIDYA algorithm. The period oscillates from the Lower Bound up (slow)
VIDYA-RS - based on Vitali Apirine's modification of VIDYA algorithm (he calls it Relative Strength Moving Average). The period oscillates from the Upper Bound down (fast)
Kaufman Efficiency Scaling - based on Efficiency Ratio calculation originally used in KAMA
Deviation Scaling - based on DSSS by John F. Ehlers
Median Average - based on Median Average Adaptive Filter by John F. Ehlers
Fractal Adaptation - based on FRAMA by John F. Ehlers
MESA MAMA Alpha - based on MESA Adaptive Moving Average by John F. Ehlers
MESA MAMA Cycle - based on MESA Adaptive Moving Average by John F. Ehlers , but unlike Alpha calculation, this adaptation estimates cycle period
Pearson Autocorrelation* - based on Pearson Autocorrelation Periodogram by John F. Ehlers
DFT Cycle* - based on Discrete Fourier Transform Spectrum estimator by John F. Ehlers
Phase Accumulation* - based on Dominant Cycle from Phase Accumulation by John F. Ehlers
Length Adaptation usually take two parameters: Bound From (lower bound) and To (upper bound). These are the limits for Adaptation values. Note that the Cycle Estimators marked with asterisks(*) are very computationally intensive, so the bounds should not be set much higher than 50, otherwise you may receive a timeout error (also, it does not seem to be a useful thing to do, but you may correct me if I'm wrong).
The Cycle Estimators marked with asterisks(*) also have 3 checkboxes: HP (Highpass Filter), SS (Super Smoother) and HW (Hann Window). These enable or disable their internal prefilters, which are recommended by their author - John F. Ehlers . I do not know, which combination works best, so you can experiment.
Chande's Adaptations also have 3 additional parameters: SD Length (lookback length of Standard deviation), Smooth (smoothing length of Standard deviation) and Power ( exponent of the length adaptation - lower is smaller variation). These are internal tweaks for the calculation.
Oscillators section offer you a choice of Oscillator algorithms:
Stochastic - Stochastic
Super Smooth Stochastic - Super Smooth Stochastic (part of MESA Stochastic) by John F. Ehlers
CMO - Chande Momentum Oscillator
RSI - Relative Strength Index
Volume-scaled RSI - my own version of RSI. It scales price movements by the proportion of RMS of volume
Momentum RSI - RSI of price momentum
Rocket RSI - inspired by RocketRSI by John F. Ehlers (not an exact implementation)
MFI - Money Flow Index
LRSI - Laguerre RSI by John F. Ehlers
LRSI with Fractal Energy - a combo oscillator that uses Fractal Energy to tune LRSI gamma
Fractal Energy - Fractal Energy or Choppiness Index by E. W. Dreiss
Efficiency ratio - based on Kaufman Adaptive Moving Average calculation
DMI - Directional Movement Index (only ADX is drawn)
Fast DMI - same as DMI, but without secondary smoothing
If no Adaptation is selected (None option), you can set Length directly. If an Adaptation is selected, then Cycle multiplier can be set.
Before an Oscillator, a High Pass filter may be executed to remove cyclic components longer than the provided Highpass Length (no High Pass filter, if Highpass Length = 0). Both before and after the Oscillator a Moving Average can be applied. The following Moving Averages are included: SMA, RMA, EMA, HMA , VWMA, 2-pole Super Smoother, 3-pole Super Smoother, Filt11, Triangle Window, Hamming Window, Hann Window, Lowpass, DSSS. For more details on these Moving Averages, you can check my other Adaptive Constructor indicator:
The Oscillator output may be renormalized and postprocessed with the following Normalization algorithms:
Stochastic - Stochastic
Super Smooth Stochastic - Super Smooth Stochastic (part of MESA Stochastic) by John F. Ehlers
Inverse Fisher Transform - Inverse Fisher Transform
Noise Elimination Technology - a simplified Kendall correlation algorithm "Noise Elimination Technology" by John F. Ehlers
Except for Inverse Fisher Transform, all Normalization algorithms can have Length parameter. If it is not specified (set to 0), then the calculated Oscillator length is used.
More information on the algorithms is given in the code for the libraries used. I am also very grateful to other TradingView community members (they are also mentioned in the library code) without whom this script would not have been possible.

WillyCycle Oscillator&DoubleMa/ErkOzi/"This code creates a technical analysis indicator used to calculate and visualize the WillyCycle oscillator and double moving average indicators on the price of a financial asset. The functionality can be summarized as follows:
*Calculate the WillyCycle oscillator: The WillyCycle is an oscillator calculated based on the highest and lowest values of an asset. This oscillator is used to measure overbought or oversold conditions of the asset.
*Calculate the double moving average: The double moving average helps determine trends by calculating the short-term and long-term moving averages of asset prices.
*Use the WillyCycle oscillator and double moving average indicators together: The WillyCycle oscillator is combined with the double moving averages to provide a clearer indication of overbought and oversold conditions.
*Visualize the indicator with color coding: The indicator is color-coded to show overbought and oversold conditions. Additionally, line and background colors are changed to make the indicator more readable.
Many parameters can be adjusted on the indicator: The indicator can be customized and modified by the user. For example, the period of the WillyCycle oscillator and the lengths of the double moving averages can be adjusted."
The strategy is based on two indicators - the WillyCycle oscillator and the double moving average. The WillyCycle oscillator measures overbought and oversold conditions of the asset based on its highest and lowest values. The double moving average calculates short-term and long-term moving averages of the asset's price, which can help identify trends.
The WillyCycle oscillator and the double moving average are combined in this strategy to provide a clearer indication of overbought and oversold conditions. When the WillyCycle oscillator indicates that the asset is oversold and the short-term moving average crosses above the long-term moving average, it may signal a buy opportunity. Conversely, when the WillyCycle oscillator indicates that the asset is overbought and the short-term moving average crosses below the long-term moving average, it may signal a sell opportunity.
To make it easier for traders to read and interpret the indicator, color-coding is used to indicate overbought and oversold conditions. The user can also customize the indicator by adjusting parameters such as the period of the WillyCycle oscillator and the lengths of the double moving averages.
*ıt provides successful buy and sell signals for price reversals.
*You can open counter trades in overbought and oversold areas by following the averages.

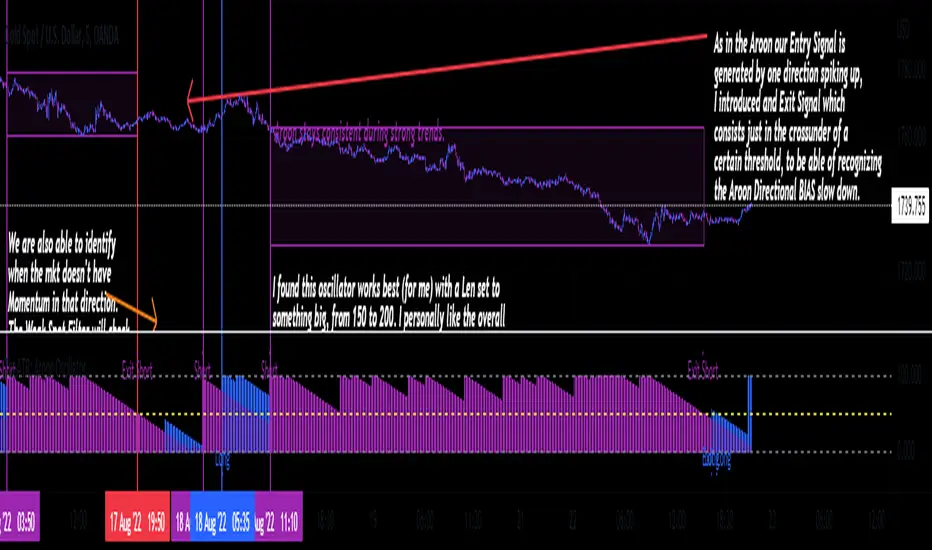
TheATR: Aroon Oscillator.Aroon Oscillator (AO).
The Aroon Oscillator, was developed by Tushar Chande, in 1995, to highlight the start of a new trend and to measure trend strength.
I re-branded a bit the whole thing, If you are familiar with how this Oscillator usually is, you are going to notice the differences.
Aroon Oscillator Components.
1 - Aroon Up -> Bullish Directional Component, highlighted in blue.
2 - Aroon Down -> Bearish Directional Component, highlighted in purple.
We also have the Oscillators static thresholds, which are:
- 0 Line.
- 100 Line.
- Exit Signal Line Level.
How to read the Aroon Oscillator.
The AO main goal, is to identify the trend from its first stages, to then come up with how strong that trend is.
So, classic interpretation for the AO would be:
-Aroon Up>Aroon Down = Bull Scenario.
-Aroon Up
Mean Reversion Oscillator [Alpha Extract]An advanced composite oscillator system specifically designed to identify extreme market conditions and high-probability mean reversion opportunities, combining five proven oscillators into a single, powerful analytical framework.
By integrating multiple momentum and volume-based indicators with sophisticated extreme level detection, this oscillator provides precise entry signals for contrarian trading strategies while filtering out false reversals through momentum confirmation.
🔶 Multi-Oscillator Composite Framework
Utilizes a comprehensive approach that combines Bollinger %B, RSI, Stochastic, Money Flow Index, and Williams %R into a unified composite score. This multi-dimensional analysis ensures robust signal generation by capturing different aspects of market extremes and momentum shifts.
// Weighted composite (equal weights)
normalized_bb = bb_percent
normalized_rsi = rsi
normalized_stoch = stoch_d_val
normalized_mfi = mfi
normalized_williams = williams_r
composite_raw = (normalized_bb + normalized_rsi + normalized_stoch + normalized_mfi + normalized_williams) / 5
composite = ta.sma(composite_raw, composite_smooth)
🔶 Advanced Extreme Level Detection
Features a sophisticated dual-threshold system that distinguishes between moderate and extreme market conditions. This hierarchical approach allows traders to identify varying degrees of mean reversion potential, from moderate oversold/overbought conditions to extreme levels that demand immediate attention.
🔶 Momentum Confirmation System
Incorporates a specialized momentum histogram that confirms mean reversion signals by analyzing the rate of change in the composite oscillator. This prevents premature entries during strong trending conditions while highlighting genuine reversal opportunities.
// Oscillator momentum (rate of change)
osc_momentum = ta.mom(composite, 5)
histogram = osc_momentum
// Momentum confirmation
momentum_bullish = histogram > histogram
momentum_bearish = histogram < histogram
// Confirmed signals
confirmed_bullish = bullish_entry and momentum_bullish
confirmed_bearish = bearish_entry and momentum_bearish
🔶 Dynamic Visual Intelligence
The oscillator line adapts its color intensity based on proximity to extreme levels, providing instant visual feedback about market conditions. Background shading creates clear zones that highlight when markets enter moderate or extreme territories.
🔶 Intelligent Signal Generation
Generates precise entry signals only when the composite oscillator crosses extreme thresholds with momentum confirmation. This dual-confirmation approach significantly reduces false signals while maintaining sensitivity to genuine mean reversion opportunities.
How It Works
🔶 Composite Score Calculation
The indicator simultaneously tracks five different oscillators, each normalized to a 0-100 scale, then combines them into a smoothed composite score. This approach eliminates the noise inherent in single-oscillator analysis while capturing the consensus view of multiple momentum indicators.
// Mean reversion entry signals
bullish_entry = ta.crossover(composite, 100 - extreme_level) and composite < (100 - extreme_level)
bearish_entry = ta.crossunder(composite, extreme_level) and composite > extreme_level
// Bollinger %B calculation
bb_basis = ta.sma(src, bb_length)
bb_dev = bb_mult * ta.stdev(src, bb_length)
bb_percent = (src - bb_lower) / (bb_upper - bb_lower) * 100
🔶 Extreme Zone Identification
The system automatically identifies when markets reach statistically significant extreme levels, both moderate (65/35) and extreme (80/20). These zones represent areas where mean reversion has the highest probability of success based on historical market behavior.
🔶 Momentum Histogram Analysis
A specialized momentum histogram tracks the velocity of oscillator changes, helping traders distinguish between healthy corrections and potential trend reversals. The histogram's color-coded display makes momentum shifts immediately apparent.
🔶 Divergence Detection Framework
Built-in divergence analysis identifies situations where price and oscillator movements diverge, often signaling impending reversals. Diamond-shaped markers highlight these critical divergence patterns for enhanced pattern recognition.
🔶 Real-Time Information Dashboard
An integrated information table provides instant access to current oscillator readings, market status, and individual component values. This dashboard eliminates the need to manually check multiple indicators while trading.
🔶 Individual Component Display
Optional display of individual oscillator components allows traders to understand which specific indicators are driving the composite signal. This transparency enables more informed decision-making and deeper market analysis.
🔶 Adaptive Background Coloring
Intelligent background shading automatically adjusts based on market conditions, creating visual zones that correspond to different levels of mean reversion potential. The subtle color gradations make pattern recognition effortless.
1D
3D
🔶 Comprehensive Alert System
Multi-tier alert system covers confirmed entry signals, divergence patterns, and extreme level breaches. Each alert type provides specific context about the detected condition, enabling traders to respond appropriately to different signal strengths.
🔶 Customizable Threshold Management
Fully adjustable extreme and moderate levels allow traders to fine-tune the indicator's sensitivity to match different market volatilities and trading timeframes. This flexibility ensures optimal performance across various market conditions.
🔶 Why Choose AE - Mean Reversion Oscillator?
This indicator provides the most comprehensive approach to mean reversion trading by combining multiple proven oscillators with advanced confirmation mechanisms. By offering clear visual hierarchies for different extreme levels and requiring momentum confirmation for signals, it empowers traders to identify high-probability contrarian opportunities while avoiding false reversals. The sophisticated composite methodology ensures that signals are both statistically significant and practically actionable, making it an essential tool for traders focused on mean reversion strategies across all market conditions.

Hull Butterfly Oscillator [LuxAlgo]The Hull Butterfly Oscillator (HBO) is an oscillator constructed from the difference between a regular Hull Moving Average (HMA) and another with coefficients flipped horizontally.
Levels are obtained from cumulative means of the absolute value of the oscillator. These are used to return dots indicating potential reversal points.
Settings
Length: Number of past price inputs processed by the oscillator.
Levels Multiplier: Determine how far the levels are from 0.
Src: Input source of the indicator.
Usage
The oscillator can be used like most available oscillators. The sign of the HBO allows determining the current trend direction, while divergences with price might indicate potential reversals.
The displayed levels can additionally indicate whether the market is overbought or oversold. When the direction of the oscillator changes while being above the upper or lower level a red dot (if above upper level) or green dot (if under lower level) will be displayed, indicating a potential reversal.
Details
The name of the indicator is directly derived behind the coefficients used for its calculation. Displaying regular Hull coefficients alongside those flipped horizontally slightly resemble a butterfly, the difference between these sets of coefficients allows obtaining the HBO.
This operation allows to obtain a more structured impulse response, potentially giving less undesired performances on the frequency domain compared to simpler operation involving subtracting the HMA to a SMA, EMA or WMA.

Range Oscillator Strategy + Stoch Confirm🔹 Short summary
This is a free, educational long-only strategy built on top of the public “Range Oscillator” by Zeiierman (used under CC BY-NC-SA 4.0), combined with a Stochastic timing filter, an EMA-based exit filter and an optional risk-management layer (SL/TP and R-multiple exits). It is NOT financial advice and it is NOT a magic money machine. It’s a structured framework to study how range-expansion + momentum + trend slope can be combined into one rule-based system, often with intentionally RARE trades.
────────────────────────
0. Legal / risk disclaimer
────────────────────────
• This script is FREE and public. I do not charge any fee for it.
• It is for EDUCATIONAL PURPOSES ONLY.
• It is NOT financial advice and does NOT guarantee profits.
• Backtest results can be very different from live results.
• Markets change over time; past performance is NOT indicative of future performance.
• You are fully responsible for your own trades and risk.
Please DO NOT use this script with money you cannot afford to lose. Always start in a demo / paper trading environment and make sure you understand what the logic does before you risk any capital.
────────────────────────
1. About default settings and risk (very important)
────────────────────────
The script is configured with the following defaults in the `strategy()` declaration:
• `initial_capital = 10000`
→ This is only an EXAMPLE account size.
• `default_qty_type = strategy.percent_of_equity`
• `default_qty_value = 100`
→ This means 100% of equity per trade in the default properties.
→ This is AGGRESSIVE and should be treated as a STRESS TEST of the logic, not as a realistic way to trade.
TradingView’s House Rules recommend risking only a small part of equity per trade (often 1–2%, max 5–10% in most cases). To align with these recommendations and to get more realistic backtest results, I STRONGLY RECOMMEND you to:
1. Open **Strategy Settings → Properties**.
2. Set:
• Order size: **Percent of equity**
• Order size (percent): e.g. **1–2%** per trade
3. Make sure **commission** and **slippage** match your own broker conditions.
• By default this script uses `commission_value = 0.1` (0.1%) and `slippage = 3`, which are reasonable example values for many crypto markets.
If you choose to run the strategy with 100% of equity per trade, please treat it ONLY as a stress-test of the logic. It is NOT a sustainable risk model for live trading.
────────────────────────
2. What this strategy tries to do (conceptual overview)
────────────────────────
This is a LONG-ONLY strategy designed to explore the combination of:
1. **Range Oscillator (Zeiierman-based)**
- Measures how far price has moved away from an adaptive mean.
- Uses an ATR-based range to normalize deviation.
- High positive oscillator values indicate strong price expansion away from the mean in a bullish direction.
2. **Stochastic as a timing filter**
- A classic Stochastic (%K and %D) is used.
- The logic requires %K to be below a user-defined level and then crossing above %D.
- This is intended to catch moments when momentum turns up again, rather than chasing every extreme.
3. **EMA Exit Filter (trend slope)**
- An EMA with configurable length (default 70) is calculated.
- The slope of the EMA is monitored: when the slope turns negative while in a long position, and the filter is enabled, it triggers an exit condition.
- This acts as a trend-protection exit: if the medium-term trend starts to weaken, the strategy exits even if the oscillator has not yet fully reverted.
4. **Optional risk-management layer**
- Percentage-based Stop Loss and Take Profit (SL/TP).
- Risk/Reward (R-multiple) exit based on the distance from entry to SL.
- Implemented as OCO orders that work *on top* of the logical exits.
The goal is not to create a “holy grail” system but to serve as a transparent, configurable framework for studying how these concepts behave together on different markets and timeframes.
────────────────────────
3. Components and how they work together
────────────────────────
(1) Range Oscillator (based on “Range Oscillator (Zeiierman)”)
• The script computes a weighted mean price and then measures how far price deviates from that mean.
• Deviation is normalized by an ATR-based range and expressed as an oscillator.
• When the oscillator is above the **entry threshold** (default 100), it signals a strong move away from the mean in the bullish direction.
• When it later drops below the **exit threshold** (default 30), it can trigger an exit (if enabled).
(2) Stochastic confirmation
• Classic Stochastic (%K and %D) is calculated.
• An entry requires:
- %K to be below a user-defined “Cross Level”, and
- then %K to cross above %D.
• This is a momentum confirmation: the strategy tries to enter when momentum turns up from a pullback rather than at any random point.
(3) EMA Exit Filter
• The EMA length is configurable via `emaLength` (default 70).
• The script monitors the EMA slope: it computes the relative change between the current EMA and the previous EMA.
• If the slope turns negative while the strategy holds a long position and the filter is enabled, it triggers an exit condition.
• This is meant to help protect profits or cut losses when the medium-term trend starts to roll over, even if the oscillator conditions are not (yet) signalling exit.
(4) Risk management (optional)
• Stop Loss (SL) and Take Profit (TP):
- Defined as percentages relative to average entry price.
- Both are disabled by default, but you can enable them in the Inputs.
• Risk/Reward Exit:
- Uses the distance from entry to SL to project a profit target at a configurable R-multiple.
- Also optional and disabled by default.
These exits are implemented as `strategy.exit()` OCO orders and can close trades independently of oscillator/EMA conditions if hit first.
────────────────────────
4. Entry & Exit logic (high level)
────────────────────────
A) Time filter
• You can choose a **Start Year** in the Inputs.
• Only candles between the selected start date and 31 Dec 2069 are used for backtesting (`timeCondition`).
• This prevents accidental use of tiny cherry-picked windows and makes tests more honest.
B) Entry condition (long-only)
A long entry is allowed when ALL the following are true:
1. `timeCondition` is true (inside the backtest window).
2. If `useOscEntry` is true:
- Range Oscillator value must be above `entryLevel`.
3. If `useStochEntry` is true:
- Stochastic condition (`stochCondition`) must be true:
- %K < `crossLevel`, then %K crosses above %D.
If these filters agree, the strategy calls `strategy.entry("Long", strategy.long)`.
C) Exit condition (logical exits)
A position can be closed when:
1. `timeCondition` is true AND a long position is open, AND
2. At least one of the following is true:
- If `useOscExit` is true: Oscillator is below `exitLevel`.
- If `useMagicExit` (EMA Exit Filter) is true: EMA slope is negative (`isDown = true`).
In that case, `strategy.close("Long")` is called.
D) Risk-management exits
While a position is open:
• If SL or TP is enabled:
- `strategy.exit("Long Risk", ...)` places an OCO stop/limit order based on the SL/TP percentages.
• If Risk/Reward exit is enabled:
- `strategy.exit("RR Exit", ...)` places an OCO order using a projected R-multiple (`rrMult`) of the SL distance.
These risk-based exits can trigger before the logical oscillator/EMA exits if price hits those levels.
────────────────────────
5. Recommended backtest configuration (to avoid misleading results)
────────────────────────
To align with TradingView House Rules and avoid misleading backtests:
1. **Initial capital**
- 10 000 (or any value you personally want to work with).
2. **Order size**
- Type: **Percent of equity**
- Size: **1–2%** per trade is a reasonable starting point.
- Avoid risking more than 5–10% per trade if you want results that could be sustainable in practice.
3. **Commission & slippage**
- Commission: around 0.1% if that matches your broker.
- Slippage: a few ticks (e.g. 3) to account for real fills.
4. **Timeframe & markets**
- Volatile symbols (e.g. crypto like BTCUSDT, or major indices).
- Timeframes: 1H / 4H / **1D (Daily)** are typical starting points.
- I strongly recommend trying the strategy on **different timeframes**, for example 1D, to see how the behaviour changes between intraday and higher timeframes.
5. **No “caution warning”**
- Make sure your chosen symbol + timeframe + settings do not trigger TradingView’s caution messages.
- If you see warnings (e.g. “too few trades”), adjust timeframe/symbol or the backtest period.
────────────────────────
5a. About low trade count and rare signals
────────────────────────
This strategy is intentionally designed to trade RARELY:
• It is **long-only**.
• It uses strict filters (Range Oscillator threshold + Stochastic confirmation + optional EMA Exit Filter).
• On higher timeframes (especially **1D / Daily**) this can result in a **low total number of trades**, sometimes WELL BELOW 100 trades over the whole backtest.
TradingView’s House Rules mention 100+ trades as a guideline for more robust statistics. In this specific case:
• The **low trade count is a conscious design choice**, not an attempt to cherry-pick a tiny, ultra-profitable window.
• The goal is to study a **small number of high-conviction long entries** on higher timeframes, not to generate frequent intraday signals.
• Because of the low trade count, results should NOT be interpreted as statistically strong or “proven” – they are only one sample of how this logic would have behaved on past data.
Please keep this in mind when you look at the equity curve and performance metrics. A beautiful curve with only a handful of trades is still just a small sample.
────────────────────────
6. How to use this strategy (step-by-step)
────────────────────────
1. Add the script to your chart.
2. Open the **Inputs** tab:
- Set the backtest start year.
- Decide whether to use Oscillator-based entry/exit, Stochastic confirmation, and EMA Exit Filter.
- Optionally enable SL, TP, and Risk/Reward exits.
3. Open the **Properties** tab:
- Set a realistic account size if you want.
- Set order size to a realistic % of equity (e.g. 1–2%).
- Confirm that commission and slippage are realistic for your broker.
4. Run the backtest:
- Look at Net Profit, Max Drawdown, number of trades, and equity curve.
- Remember that a low trade count means the statistics are not very strong.
5. Experiment:
- Tweak thresholds (`entryLevel`, `exitLevel`), Stochastic settings, EMA length, and risk params.
- See how the metrics and trade frequency change.
6. Forward-test:
- Before using any idea in live trading, forward-test on a demo account and observe behaviour in real time.
────────────────────────
7. Originality and usefulness (why this is more than a mashup)
────────────────────────
This script is not intended to be a random visual mashup of indicators. It is designed as a coherent, testable strategy with clear roles for each component:
• Range Oscillator:
- Handles mean vs. range-expansion states via an adaptive, ATR-normalized metric.
• Stochastic:
- Acts as a timing filter to avoid entering purely on extremes and instead waits for momentum to turn.
• EMA Exit Filter:
- Trend-slope-based safety net to exit when the medium-term direction changes against the position.
• Risk module:
- Provides practical, rule-based exits: SL, TP, and R-multiple exit, which are useful for structuring risk even if you modify the core logic.
It aims to give traders a ready-made **framework to study and modify**, not a black box or “signals” product.
────────────────────────
8. Limitations and good practices
────────────────────────
• No single strategy works on all markets or in all regimes.
• This script is long-only; it does not short the market.
• Performance can degrade when market structure changes.
• Overfitting (curve fitting) is a real risk if you endlessly tweak parameters to maximise historical profit.
Good practices:
- Test on multiple symbols and timeframes.
- Focus on stability and drawdown, not only on how high the profit line goes.
- View this as a learning tool and a basis for your own research.
────────────────────────
9. Licensing and credits
────────────────────────
• Core oscillator idea & base code:
- “Range Oscillator (Zeiierman)”
- © Zeiierman, licensed under CC BY-NC-SA 4.0.
• Strategy logic, Stochastic confirmation, EMA Exit Filter, and risk-management layer:
- Modifications by jokiniemi.
Please respect both the original license and TradingView House Rules if you fork or republish any part of this script.
────────────────────────
10. No payments / no vendor pitch
────────────────────────
• This script is completely FREE to use on TradingView.
• There is no paid subscription, no external payment link, and no private signals group attached to it.
• If you have questions, please use TradingView’s comment system or private messages instead of expecting financial advice.
Use this script as a tool to learn, experiment, and build your own understanding of markets.
────────────────────────
11. Example backtest settings used in screenshots
────────────────────────
To avoid any confusion about how the results shown in screenshots were produced, here is one concrete example configuration:
• Symbol: BTCUSDT (or similar major BTC pair)
• Timeframe: 1D (Daily)
• Backtest period: from 2018 to the most recent data
• Initial capital: 10 000
• Order size type: Percent of equity
• Order size: 2% per trade
• Commission: 0.1%
• Slippage: 3 ticks
• Risk settings: Stop Loss and Take Profit disabled by default, Risk/Reward exit disabled by default
• Filters: Range Oscillator entry/exit enabled, Stochastic confirmation enabled, EMA Exit Filter enabled
If you change any of these settings (symbol, timeframe, risk per trade, commission, slippage, filters, etc.), your results will look different. Please always adapt the configuration to your own risk tolerance, market, and trading style.

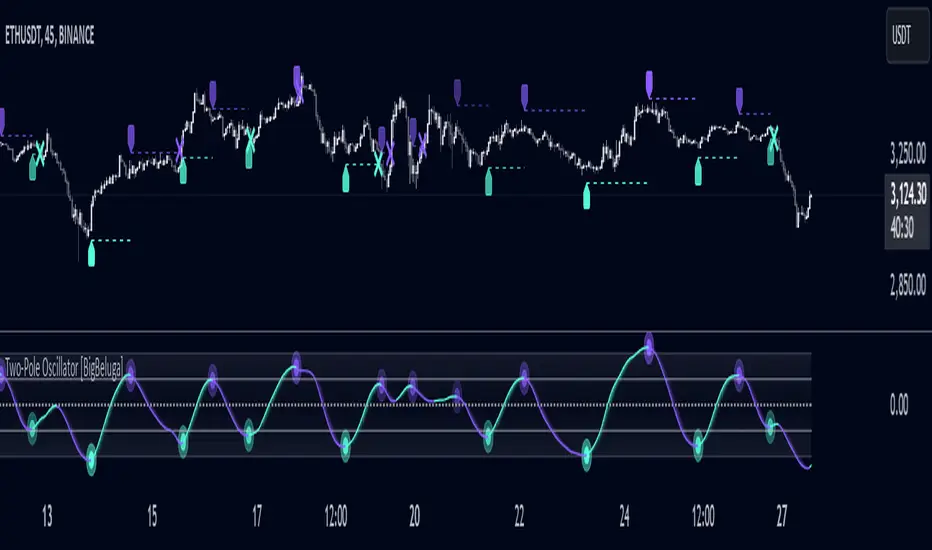
Two-Pole Oscillator [BigBeluga]
The Two-Pole Oscillator is an advanced smoothing oscillator designed to provide traders with precise market signals by leveraging deviation-based calculations combined with a unique two-pole filtering technique. It offers clear visual representation and actionable signals for smart trading decisions.
🔵Key Features:
Two-Pole Filtering: Smooths out the main oscillator signal to reduce noise, providing a cleaner and more reliable view of market momentum and trend strength.
// Two-pole smooth filter function
f_two_pole_filter(source, length) =>
var float smooth1 = na
var float smooth2 = na
alpha = 2.0 / (length + 1)
if na(smooth1)
smooth1 := source
else
smooth1 := (1 - alpha) * smooth1 + alpha * source
if na(smooth2)
smooth2 := smooth1
else
smooth2 := (1 - alpha) * smooth2 + alpha * smooth1
Deviation-Based Oscillator: Utilizes price deviations from the mean to generate dynamic signals, making it ideal for detecting overbought and oversold conditions.
float sma1 = ta.sma(close, 25)
float sma_n1 = ((close - sma1) - ta.sma(close - sma1, 25)) / ta.stdev(close - sma1, 25)
Signal Gradient Strength: Signals on the main oscillator line feature gradient coloring based on their proximity to the 0 level:
➔ Closer to 0: More transparent, indicating weaker signals.
➔ Closer to 1 or -1: Less transparent, highlighting stronger signals.
Level-Based Signal Validation: Parallel levels are plotted on the chart for each signal:
➔ If a level is crossed by price, the signal is invalidated, marked by an "X" at the invalidation point.
Trend Continuation
Invalidation Levels: Serve as potential stop-loss or trade-reversal zones, enabling traders to make more informed and disciplined trading decisions.
Dynamic Chart Plotting: Signals are plotted directly on the chart with corresponding levels, providing a comprehensive visual representation for easy interpretation.
🔵How It Works:
The oscillator calculates price deviation from a mean value and applies two-pole filtering to smooth the resulting signal.
Gradient-colored signals reflect their strength, with transparency indicating proximity to the 0 level on the oscillator scale.
Buy and sell signals are generated based on crossovers and crossunders of the oscillator line with a signal line.
If a level is crossed, the corresponding signal is marked with a "X" plotted on the chart at the crossover point.
🔵Use Cases:
Detecting overbought or oversold market conditions with a smoother, noise-free oscillator.
Using invalidation levels to set clear stop-loss or trade exit points.
Identifying strong momentum signals and filtering out weaker, less reliable ones.
Combining oscillator signals with price action for more precise trade entries and exits.
This indicator is perfect for traders seeking a refined approach to oscillator analysis, combining signal strength visualization with actionable invalidation levels to enhance trading precision and strategy.
Momentum Nexus Oscillator [UAlgo]The "Momentum Nexus Oscillator " indicator is a comprehensive momentum-based tool designed to provide traders with visual cues on market conditions using multiple oscillators. By combining four popular technical indicators—RSI (Relative Strength Index), VZO (Volume Zone Oscillator), MFI (Money Flow Index), and CCI (Commodity Channel Index)—this heatmap offers a holistic view of the market's momentum.
The indicator plots two lines: one representing the current chart’s combined momentum score and the other representing a higher timeframe’s (HTF) score, if enabled. Through smooth gradient color transitions and easy-to-read signals, the Momentum Nexus Heatmap allows traders to easily identify potential trend reversals or continuation patterns.
Traders can use this tool to detect overbought or oversold conditions, helping them anticipate possible long or short trade opportunities. The option to use a higher timeframe enhances the flexibility of the indicator for longer-term trend analysis.
🔶 Key Features
Multi-Oscillator Approach: Combines four popular momentum oscillators (RSI, VZO, MFI, and CCI) to generate a weighted score, providing a comprehensive picture of market momentum.
Dynamic Color Heatmap: Utilizes a smooth gradient transition between bullish and bearish colors, reflecting market momentum across different thresholds.
Higher Timeframe (HTF) Compatibility: Includes an optional higher timeframe input that displays a separate score line based on the same momentum metrics, allowing for multi-timeframe analysis.
Customizable Parameters: Adjustable RSI, VZO, MFI, and CCI lengths, as well as overbought and oversold levels, to match the trader’s strategy or preference.
Signal Alerts: Built-in alert conditions for both the current chart and higher timeframe scores, notifying traders when long or short entry signals are triggered.
Buy/Sell Signals: Displays visual signals (▲ and ▼) on the chart when combined scores reach overbought or oversold levels, providing clear entry cues.
User-Friendly Visualization: The heatmap is separated into four sections representing each indicator, providing a transparent view of how each contributes to the overall momentum score.
🔶 Interpreting Indicator:
Combined Score
The indicator generates a combined score by weighing the individual contributions of RSI, VZO, MFI, and CCI. This score ranges from 0 to 100 and is plotted as a line on the chart. Lower values suggest potential oversold conditions, while higher values indicate overbought conditions.
Color Heatmap
The indicator divides the combined score into four distinct sections, each representing one of the underlying momentum oscillators (RSI, VZO, MFI, and CCI). Bullish (greenish) colors indicate upward momentum, while bearish (grayish) colors suggest downward momentum.
Long/Short Signals
When the combined score drops below the oversold threshold (default is 26), a long signal (▲) is displayed on the chart, indicating a potential buying opportunity.
When the combined score exceeds the overbought threshold (default is 74), a short signal (▼) is shown, signaling a potential sell or short opportunity.
Higher Timeframe Analysis
If enabled, the indicator also plots a line representing the combined score for a higher timeframe. This can be used to align lower timeframe trades with the broader trend of a higher timeframe, providing added confirmation.
Signals for long and short entries are also plotted for the higher timeframe when its combined score reaches overbought or oversold levels.
🔶Purpose of Using Multiple Technical Indicators
The combination of RSI, VZO, MFI, and CCI in the Momentum Nexus Heatmap provides a comprehensive approach to analyzing market momentum by leveraging the unique strengths of each indicator. This multi-indicator method minimizes the limitations of using just one tool, resulting in more reliable signals and a clearer understanding of market conditions.
RSI (Relative Strength Index)
RSI contributes by measuring the strength and speed of recent price movements. It helps identify overbought or oversold levels, signaling potential trend reversals or corrections. Its simplicity and effectiveness make it one of the most widely used indicators in technical analysis, contributing to momentum assessment in a straightforward manner.
VZO (Volume Zone Oscillator)
VZO adds the critical element of volume to the analysis. By assessing whether price movements are supported by significant volume, VZO distinguishes between price changes that are driven by real market conviction and those that might be short-lived. It helps validate the strength of a trend or alert the trader to potential weakness when price moves are unsupported by volume.
MFI (Money Flow Index)
MFI enhances the analysis by combining price and volume to gauge money flow into and out of an asset. This indicator provides insight into the participation of large players in the market, showing if money is pouring into or exiting the asset. MFI acts as a volume-weighted version of RSI, giving more weight to volume shifts and helping traders understand the sustainability of price trends.
CCI (Commodity Channel Index)
CCI contributes by measuring how far the price deviates from its statistical average. This helps in identifying extreme conditions where the market might be overextended in either direction. CCI is especially useful for spotting trend reversals or continuations, particularly during market extremes, and for identifying divergence signals.
🔶 Disclaimer
Use with Caution: This indicator is provided for educational and informational purposes only and should not be considered as financial advice. Users should exercise caution and perform their own analysis before making trading decisions based on the indicator's signals.
Not Financial Advice: The information provided by this indicator does not constitute financial advice, and the creator (UAlgo) shall not be held responsible for any trading losses incurred as a result of using this indicator.
Backtesting Recommended: Traders are encouraged to backtest the indicator thoroughly on historical data before using it in live trading to assess its performance and suitability for their trading strategies.
Risk Management: Trading involves inherent risks, and users should implement proper risk management strategies, including but not limited to stop-loss orders and position sizing, to mitigate potential losses.
No Guarantees: The accuracy and reliability of the indicator's signals cannot be guaranteed, as they are based on historical price data and past performance may not be indicative of future results.

Dap's Oscillator- Short Term Momentum and Trend. BINANCE:BTCUSDT BYBIT:BTCUSDT BYBIT:ETHUSDT BINANCE:ETHUSDT
DAP's OSCILLATOR:
WHAT IS IT?
This Oscillator was created to inspire confidence in the short-term trend of traders. This will work very well with a volatility metric (I recommend BBWP by @The_Caretaker)
WHAT IS IT MADE OF?
1. Consists of a series of equations (mainly the difference between simple to exponential moving averages) and Standard deviations of these moving average differences (length equivalent to the length of sampled ma's)
2. These equations are then boiled down through an averaging process array, after averaging the covariants are equated against the variants of the positive side of the array. This is what is presented as the aqua line.
3. The RC average (yellow) is the sma following the DAP'S Oscillator at a specified length
4. The most important part of this indicator is simply the momentum oscillator represented as a green or red line based on the value relative to the Oscillators.
HOW DO I USE THIS?
As I mentioned before mixed with a volatility metric, it should set you up for a good decision based on short-term trends. I would say to be careful for periods of consolidation, with the consolidation the momentum often meets hands with DAP's Oscillator and can cause fake-outs. You want to spot divergences from the price to the momentum difference, as well as room to work down or upward to secure a good entry on a position.
CHEAT CODE'S NOTES:
I appreciate everyone who has boosted my previous scripts, it means a lot. If you want to translate words to pine script onto a chart, feel free to PM me. I would be happy to help bring an indicator to life. I may take a quick break but will be back shortly to help create more cheat codes for yall. Thanks!
-Cheat Code

SuperTrend Oscillator [LuxAlgo]This oscillator is made of three components, all derived from the SuperTrend indicator. This approach allows the user to easily determine overbought/sold zones, identify whether a retracement is present or if the price is ranging or trending. It also allows for the anticipation of the potential price cross with the SuperTrend.
We provide additional information including whether a signal returned by the SuperTrend was false, as well as the percentage of false signals.
Settings
Length: Period of the "average true range" used in the calculation of the SuperTrend
Mult: Multiplicative factor for the "average true range"
Smooth: Determines the degree of smoothing of the histogram
Misc:
Fixed Transparency: Use a fixed transparency for the main oscillator
Show Lines: Show the lines displayed by the indicator
Show Labels: Show the labels displayed by the indicator
Usage
The indicator is in a range of (-100,100) with values closer to 100/-100 indicating a stronger trend. The main oscillator value above 0 indicates that the price is above the SuperTrend.
It is possible to identify when a retracement is present in a trend. This is often indicated by an oscillator value moving within 50/-50.
Each overbought/oversold level can be used to determine potential exit points.
The indicator also includes two additional oscillators derived from the main oscillator. A smoothed version of the main oscillator (Signal), and a smoothed version of the difference between the Main and Signal oscillators (Histogram), thus making the oscillator part of the indicator more similar to MACD.
One can use the histogram to anticipate when the price might cross the SuperTrend by comparing the sign between the main and histogram. Potential false signals can also be filtered with this method.
Certain crosses between the price and SuperTrend can be filtered out when the histogram and main oscillator have a different sign (here main = 1, histogram = -1).
We include various indications in order to analyze the signals returned by the SuperTrend. The indicator displays symbols indicating whether a signal was false or not.
A cross symbol will be displayed at the top of the displayed lines when the previous Buy signal was false, else a checkmark is displayed. Symbols displayed at the bottom of the lines are referring to sell signals. We also provide a percentage of false signals, calculated over the entire chart history.
Details
The scaling method used is similar to max-min normalization. We first compute the difference between the price and SuperTrend and divide the result by the difference between the upper and lower extremity used to compute the SuperTrend. Values higher than (1,-1) can occur when price crosses the SuperTrend and as such we use the max and min functions to attenuate these.
The filter used to compute the signal line is based on exponential averaging and is fully adaptive. The smoothing factor used for its computation is the squared value of the main oscillator, divided by length . Since higher values of the oscillator are associated with trending markets, the filter will be closer to the main oscillator when the market is ranging.

ATR-Based Trend Oscillator with Donchian ChannelsThis script, my Magnum Opus, combines the best elements of trend detection into a powerful ATR-based trend strength oscillator. It has been meticulously engineered to give traders a consistent edge in trend analysis across any asset, including highly volatile markets like crypto and forex. The oscillator normalizes trend strength as a percentage of ATR, smoothing out noise and allowing the oscillator to remain highly responsive while adapting to varying asset volatility.
Key Features:
ATR-Based Oscillator: Measures trend strength in relation to Average True Range, which enhances accuracy and consistency across different assets. By normalizing to ATR, the oscillator produces stable and reliable values that capture shifts in trend momentum effectively.
Dual Moving Averages for Smoothing: This script features two customizable moving averages to help confirm trend direction and strength, making it adaptable for short- and long-term analysis alike.
Donchian Channels for Strength Bounds: A Donchian Channel over the smoothed trend strength oscillator visually bounds strength levels, enabling traders to spot breakout points or reversals quickly.
Ideal for Multi-Asset Trading: The versatility of this indicator makes it a perfect choice across various asset classes, from stocks to forex and cryptocurrencies, maintaining consistency in signals and reliability.
Suggested Pairing: Use this oscillator alongside a directional indicator, such as the Vortex Indicator, to confirm trend direction. This pairing allows traders to understand not only the strength but also the direction of the trend for optimized entry and exit points.
Why This Indicator Will Elevate Your Trading: This trend strength oscillator has been refined to provide clarity and edge for any trader. By incorporating ATR-based normalization, it maintains accuracy in volatile and steady markets alike. The Donchian Channels add structure to trend strength, giving clear overbought and oversold signals, while the two moving averages ensure that lag is minimized without sacrificing accuracy.
Whether you're scalping or trend-trading, this oscillator will enhance your ability to detect and interpret trend strength, making it an essential tool in any trading arsenal.
Ehlers Stochastic CG Oscillator [LazyBear]Another one from Ehlers.
Ehlers likes the idea behind StochRSI so much, he dedicated a full chapter in his book (linked below) on how stoch works with his "superlative" (his words, not mine) indicators. This is stoch of his CG oscillator.
Standard stochastic oscillator uses fixed period for calculations and does not adjust to the constantly changing market cycle length. Stochastic CG Oscillator does not have such a drawback.
Use this like normal stochRSI osc (Uncheck "Fill Osc/Trigger" option, sample chart below)
More info:
- CG oscillator:
- Cybernetic Analysis for Stocks and Futures (Ehlers)
List of my public indicators: bit.ly
List of my app-store indicators: blog.tradingview.com
IU Momentum OscillatorDESCRIPTION:
The IU Momentum Oscillator is a specialized trend-following tool designed to visualize the raw "energy" of price action. Unlike traditional oscillators that rely solely on closing prices relative to a range (like RSI), this indicator calculates momentum based on the ratio of bullish candles over a specific lookback period.
This "Neon Edition" has been engineered with a focus on visual clarity and aesthetic depth. It utilizes "Shadow Plotting" to create a glowing effect and dynamic "Trend Clouds" to highlight the strength of the move. The result is a clean, modern interface that allows traders to instantly gauge market sentiment—whether the bulls or bears are in control—without cluttering the chart with complex lines.
USER INPUTS:
- Momentum Length (Default: 20): The number of past candles analyzed to count bullish occurrences.
- Momentum Smoothing (Default: 20): An SMA filter applied to the raw data to reduce noise and provide a cleaner wave.
- Signal Line Length (Default: 5): The length of the EMA signal line used to generate crossover signals and the "Trend Cloud."
- Overbought / Oversold Levels (Default: 60 / 40): Thresholds that define extreme market conditions.
- Colors: Fully customizable Neon Cyan (Bullish) and Neon Magenta (Bearish) inputs to match your chart theme.
LONG CONDITION:
- Signal: A Buy signal is indicated by a small Cyan Circle.
- Logic: Occurs when the Main Momentum Line (Glowing) crosses ABOVE the Grey Signal Line.
- Visual Confirmation: The "Trend Cloud" turns Cyan and expands, indicating that bullish momentum is accelerating relative to the recent average.
SHORT CONDITIONS:
- Signal: A Sell signal is indicated by a small Magenta Circle.
- Logic: Occurs when the Main Momentum Line (Glowing) crosses BELOW the Grey Signal Line.
- Visual Confirmation: The "Trend Cloud" turns Magenta, indicating that bearish pressure is increasing.
WHY IT IS UNIQUE:
1. Candle-Count Logic: Most oscillators calculate price distance. This indicator calculates price participation (how many candles were actually green vs red). This offers a different perspective on trend sustainability.
2. Optimized Performance: The script uses math.sum functions rather than heavy for loops, ensuring it loads instantly and runs smoothly on all timeframes.
3. Visual Hierarchy: It uses dynamic gradients and transparency (Alpha channels) to create a "Glow" and "Cloud" effect. This makes the chart easier to read at a glance compared to flat, single-line oscillators.
HOW USER CAN BENEFIT FROM IT:
- Trend Confirmation: Traders can use the "Trend Cloud" to stay in trades longer. As long as the cloud is thick and colored, the trend is strong.
- Divergence Spotting: Because this calculates momentum differently than RSI, it can often show divergences (price goes up, but the count of bullish candles goes down) earlier than standard tools.
- Scalping: The crisp crossover signals (Circles) provide excellent entry triggers for scalpers on lower timeframes when combined with key support/resistance levels.
DISCLAIMER:
This source code and the information presented here are for educational and informational purposes only. It does not constitute financial, investment, or trading advice.
Trading in financial markets involves a high degree of risk and may not be suitable for all investors. You should not rely solely on this indicator to make trading decisions. Always perform your own due diligence, manage your risk appropriately, and consult with a qualified financial advisor before executing any trades.

Normalised Volume Oscillator [BackQuant]Normalised Volume Oscillator
A refined evolution of the Klinger Volume Oscillator, rebuilt for clarity, precision, and adaptability. This tool normalizes volume-driven momentum into a bounded scale so you can easily identify shifts in accumulation and distribution across any asset or timeframe, while keeping readings comparable between markets.
What this indicator does
The Normalised Volume Oscillator quantifies the balance between buying and selling pressure using the Klinger Volume Oscillator (KVO) as its base, then rescales it dynamically into a normalized range between -0.5 and +0.5. This normalization allows traders to interpret relative strength and exhaustion in volume flow, rather than dealing with raw unbounded values that differ across symbols.
It is a momentum-volume hybrid that reveals the strength of trend participation: when buyers dominate, normalized readings rise toward +0.5; when sellers dominate, they fall toward -0.5. The midline (0) acts as an equilibrium between accumulation and distribution.
Core components
Klinger Volume Oscillator: The foundation of this indicator, combining volume with price trend direction to measure long-term money flow relative to short-term movement.
Normalization process: The raw KVO is scaled over a user-defined Normalisation Period , computing `(KVO - lowest) / (highest - lowest) - 0.5`. This centers all readings around zero, allowing overbought/oversold detection independent of asset volatility or volume magnitude.
Signal moving average: The normalized KVO is smoothed with a user-selectable moving average type—SMA, EMA, DEMA, TEMA, HMA, ALMA, and others. This becomes the signal line for confirmation of trend direction or mean-reversion setups.
How it works conceptually
1. The KVO detects when volume supports price movement (bullish) or diverges from it (bearish).
2. The script normalizes the raw KVO so that relative magnitude is consistent—what is “strong buying pressure” looks the same on BTCUSD as it does on AAPL.
3. Overbought and oversold regions are derived statistically, rather than from arbitrary values, based on percentile zones around ±0.4 and ±0.5.
4. The oscillator is optionally combined with a moving average to help identify crossovers, momentum shifts, and divergence confirmation.
How to interpret it
Above 0: Indicates dominant buying pressure and likely continuation of upward momentum.
Below 0: Suggests dominant selling pressure and potential continuation of downward movement.
Crosses of 0: Often mark transitions between accumulation and distribution phases.
+0.4 to +0.5 zone: Overbought region where buying intensity is stretched; watch for deceleration or divergence.
[-0.4 to -0.5 zone: Oversold region indicating panic or exhaustion in selling.
Signal-line crossover: A traditional momentum confirmation method; when the normalized KVO crosses above its moving average, buyers regain control, and vice versa.
Why normalization matters
Typical volume oscillators are asset-specific—what is considered “high” volume for one symbol is not the same for another. By dynamically normalizing KVO values within a rolling lookback, this version transforms raw amplitude into a standardized scale. This means you can:
Compare multiple assets objectively.
Set consistent alert thresholds for overbought/oversold regions.
Avoid misleading interpretations from absolute oscillator values.
Customization and UI
Moving Average Type & Period: Select your preferred smoothing method (SMA, EMA, TEMA, etc.) and adjust its period to tune sensitivity.
Normalisation Period: Defines how many bars the KVO range is measured over; shorter periods adapt faster, longer ones smooth more.
Visual Toggles:
* Show Oscillator : enables or hides the core histogram.
* Show Moving Average : adds a smoothed overlay for signal confirmation.
* Paint Candles : optional color overlay for chart candles based on oscillator direction.
* Show Static Levels : displays ±0.4 and ±0.5 zones for overbought/oversold boundaries.
How to use it
Trend confirmation: Use midline (0) crossovers as confirmation of emerging trend shifts—cross above 0 suggests a new bullish phase, cross below 0 a bearish one.
Reversal spotting: Look for normalized readings reaching ±0.5 and flattening, or diverging against price extremes.
Divergence analysis: When price makes a new high but the normalized oscillator fails to, it signals waning buying conviction (and vice versa for lows).
Multi-timeframe integration: Works best alongside higher timeframe trend filters or moving averages; normalization makes this consistent.
Alerts
Prebuilt alert conditions allow quick automation:
Midline crossovers (0): transition between accumulation and distribution.
Overbought (+0.4) and Oversold (-0.4) triggers for potential exhaustion.
Signal moving-average crosses for confirmation entries.
Tips for use
Combine with price structure—don’t fade every overbought/oversold reading; confirm with break of structure or candle patterns.
Use longer normalization periods for position trading, shorter for intraday analysis.
In choppy markets, treat 0-line oscillations as noise filters, not trade triggers.
Summary
The Normalised Volume Oscillator modernizes the classic Klinger Volume Oscillator by normalizing its readings into a standardized range. This makes it more adaptive across assets and timeframes, improves interpretability, and provides intuitive, data-driven overbought/oversold levels. Whether used standalone or as a confirmation layer, it offers a clearer view of volume dynamics—revealing when markets are truly being accumulated, distributed, or stretched beyond their sustainable extremes.

EMA Oscillator [Alpha Extract]A precision mean reversion analysis tool that combines advanced Z-score methodology with dual threshold systems to identify extreme price deviations from trend equilibrium. Utilizing sophisticated statistical normalization and adaptive percentage-based thresholds, this indicator provides high-probability reversal signals based on standard deviation analysis and dynamic range calculations with institutional-grade accuracy for systematic counter-trend trading opportunities.
🔶 Advanced Statistical Normalization
Calculates normalized distance between price and exponential moving average using rolling standard deviation methodology for consistent interpretation across timeframes. The system applies Z-score transformation to quantify price displacement significance, ensuring statistical validity regardless of market volatility conditions.
// Core EMA and Oscillator Calculation
ema_values = ta.ema(close, ema_period)
oscillator_values = close - ema_values
rolling_std = ta.stdev(oscillator_values, ema_period)
z_score = oscillator_values / rolling_std
🔶 Dual Threshold System
Implements both statistical significance thresholds (±1σ, ±2σ, ±3σ) and percentage-based dynamic thresholds calculated from recent oscillator range extremes. This hybrid approach ensures consistent probability-based signals while adapting to varying market volatility regimes and maintaining signal relevance during structural market changes.
// Statistical Thresholds
mild_threshold = 1.0 // ±1σ (68% confidence)
moderate_threshold = 2.0 // ±2σ (95% confidence)
extreme_threshold = 3.0 // ±3σ (99.7% confidence)
// Percentage-Based Dynamic Thresholds
osc_high = ta.highest(math.abs(z_score), lookback_period)
mild_pct_thresh = osc_high * (mild_pct / 100.0)
moderate_pct_thresh = osc_high * (moderate_pct / 100.0)
extreme_pct_thresh = osc_high * (extreme_pct / 100.0)
🔶 Signal Generation Framework
Triggers buy/sell alerts when Z-score crosses extreme threshold boundaries, indicating statistically significant price deviations with high mean reversion probability. The system generates continuation signals at moderate levels and reversal signals at extreme boundaries with comprehensive alert integration.
// Extreme Signal Detection
sell_signal = ta.crossover(z_score, selected_extreme)
buy_signal = ta.crossunder(z_score, -selected_extreme)
// Dynamic Color Coding
signal_color = z_score >= selected_extreme ? #ff0303 : // Extremely Overbought
z_score >= selected_moderate ? #ff6a6a : // Overbought
z_score >= selected_mild ? #b86456 : // Mildly Overbought
z_score > -selected_mild ? #a1a1a1 : // Neutral
z_score > -selected_moderate ? #01b844 : // Mildly Oversold
z_score > -selected_extreme ? #00ff66 : // Oversold
#00ff66 // Extremely Oversold
🔶 Visual Structure Analysis
Provides a six-tier color gradient system with dynamic background zones indicating mild, moderate, and extreme conditions. The histogram visualization displays Z-score intensity with threshold reference lines and zero-line equilibrium context for precise mean reversion timing.
snapshot
4H
1D
🔶 Adaptive Threshold Selection
Features intelligent threshold switching between statistical significance levels and percentage-based dynamic ranges. The percentage system automatically adjusts to current volatility conditions using configurable lookback periods, while statistical thresholds maintain consistent probability-based signal generation across market cycles.
🔶 Performance Optimization
Utilizes efficient rolling calculations with configurable EMA periods and threshold parameters for optimal performance across all timeframes. The system includes comprehensive alert functionality with customizable notification preferences and visual signal overlay options.
🔶 Market Oscillator Interpretation
Z-score > +3σ indicates statistically significant overbought conditions with high reversal probability, while Z-score < -3σ signals extreme oversold levels suitable for counter-trend entries. Moderate thresholds (±2σ) capture 95% of normal price distributions, making breaches statistically significant for systematic trading approaches.
snapshot
🔶 Intelligent Signal Management
Automatic signal filtering prevents false alerts through extreme threshold crossover requirements, while maintaining sensitivity to genuine statistical deviations. The dual threshold system provides both conservative statistical approaches and adaptive market condition responses for varying trading styles.
Why Choose EMA Oscillator ?
This indicator provides traders with statistically-grounded mean reversion analysis through sophisticated Z-score normalization methodology. By combining traditional statistical significance thresholds with adaptive percentage-based extremes, it maintains effectiveness across varying market conditions while delivering high-probability reversal signals based on quantifiable price displacement from trend equilibrium, enabling systematic counter-trend trading approaches with defined statistical confidence levels and comprehensive risk management parameters.

Volume Oscillator RefurbishedThis is an experimental version of Volume Oscillator.
For more information about Volume Oscillator, please access the link below:
www.tradingview.com
Objective
The script presented here provides some improvements over the original indicator, namely:
Show multiple moving averages;
Color the bars according to the direction of the averages;
Color the bars when reaching predefined limits.
Below is the print comparing with the original indicator:
Thanks and credits:
Volume Oscillator: TradingView
Moving Averages: PineCoders, CrackingCryptocurrency, MightyZinger, Alex Orekhov (everget), alexgrover, paragjyoti2012, Franklin Moormann (cheatcountry)
Dynamic Price Oscillator (Zeiierman)█ Overview
The Dynamic Price Oscillator (DPO) by Zeiierman is designed to gauge the momentum and volatility of asset prices in trading markets. By integrating elements of traditional oscillators with volatility adjustments and Bollinger Bands, the DPO offers a unique approach to understanding market dynamics. This indicator is particularly useful for identifying overbought and oversold conditions, capturing price trends, and detecting potential reversal points.
█ How It Works
The DPO operates by calculating the difference between the current closing price and a moving average of the closing price, adjusted for volatility using the True Range method. This difference is then smoothed over a user-defined period to create the oscillator. Additionally, Bollinger Bands are applied to the oscillator itself, providing visual cues for volatility and potential breakout signals.
█ How to Use
⚪ Trend Confirmation
The DPO can serve as a confirmation tool for existing trends. Traders might look for the oscillator to maintain above or below its mean line to confirm bullish or bearish trends, respectively. A consistent direction in the oscillator's movement alongside price trend can provide additional confidence in the strength and sustainability of the trend.
⚪ Overbought/Oversold Conditions
With the application of Bollinger Bands directly on the oscillator, the DPO can highlight overbought or oversold conditions in a unique manner. When the oscillator moves outside the Bollinger Bands, it signifies an extreme condition.
⚪ Volatility Breakouts
The width of the Bollinger Bands on the oscillator reflects market volatility. Sudden expansions in the bands can indicate a breakout from a consolidation phase, which traders can use to enter trades in the direction of the breakout. Conversely, a contraction suggests a quieter market, which might be a signal for traders to wait or to look for range-bound strategies.
⚪ Momentum Trading
Momentum traders can use the DPO to spot moments when the market momentum is picking up. A sharp move of the oscillator towards either direction, especially when crossing the Bollinger Bands, can indicate the start of a strong price movement.
⚪ Mean Reversion
The DPO is also useful for mean reversion strategies, especially considering its volatility adjustment feature. When the oscillator touches or breaches the Bollinger Bands, it indicates a deviation from the normal price range. Traders might look for opportunities to enter trades anticipating a reversion to the mean.
⚪ Divergence Trading
Divergences between the oscillator and price action can be a powerful signal for reversals. For instance, if the price makes a new high but the oscillator fails to make a corresponding high, it may indicate weakening momentum and a potential reversal. Traders can use these divergence signals to initiate counter-trend moves.
█ Settings
Length: Determines the lookback period for the oscillator and Bollinger Bands calculation. Increasing this value smooths the oscillator and widens the Bollinger Bands, leading to fewer, more significant signals. Decreasing this value makes the oscillator more sensitive to recent price changes, offering more frequent signals but with increased noise.
Smoothing Factor: Adjusts the degree of smoothing applied to the oscillator's calculation. A higher smoothing factor reduces noise, offering clearer trend identification at the cost of signal timeliness. Conversely, a lower smoothing factor increases the oscillator's responsiveness to price movements, which may be useful for short-term trading but at the risk of false signals.
-----------------
Disclaimer
The information contained in my Scripts/Indicators/Ideas/Algos/Systems does not constitute financial advice or a solicitation to buy or sell any securities of any type. I will not accept liability for any loss or damage, including without limitation any loss of profit, which may arise directly or indirectly from the use of or reliance on such information.
All investments involve risk, and the past performance of a security, industry, sector, market, financial product, trading strategy, backtest, or individual's trading does not guarantee future results or returns. Investors are fully responsible for any investment decisions they make. Such decisions should be based solely on an evaluation of their financial circumstances, investment objectives, risk tolerance, and liquidity needs.
My Scripts/Indicators/Ideas/Algos/Systems are only for educational purposes!
