[blackcat] L3 3-in-1 CCI Trader█ OVERVIEW
The L3 3-in-1 CCI Trader is a comprehensive overlay indicator that combines CCI (Commodity Channel Index) analysis across multiple timeframes with trend detection, divergence identification, and support/resistance level visualization. This all-in-one tool helps traders identify potential entry and exit points through multiple confirmation signals.
█ CONCEPTS
This indicator utilizes multi-period CCI analysis combined with weighted price averaging to identify trend direction, momentum shifts, and potential reversal points.
Core Principles:
• Multi-Timeframe CCI — Combines CCI calculations from 6, 10, 20, 30, and 60 periods for comprehensive momentum analysis
• Weighted Price Average — Uses a sophisticated weighted calculation (3×Close + High + Low + Open) / 6 for smoother trend identification
• Divergence Detection — Identifies bullish and bearish divergences using EMA crossovers and RSI-based analysis
• Dynamic Support/Resistance — Automatically calculates and displays key price levels based on historical highs and lows
█ HOW TO USE
1 — Add the indicator to your chart from the TradingView indicators library
2 — Observe the trend lines: the thick line shows short-term trend, the stepped line shows mid-term trend
3 — Watch for signal labels that appear on the chart indicating potential trading opportunities
4 — Use the color-coded background as a quick trend reference (green = uptrend, orange = downtrend)
5 — Set up alerts for the signal types that match your trading strategy
Trend Interpretation
• Green Fill — Short-term line above mid-term line (bullish bias)
• Orange Fill — Short-term line below mid-term line (bearish bias)
• Teal Dotted Line — Dynamic support level based on 34-bar lowest low
█ SIGNALS
Bullish Signals
• ▲ Bullish — Appears when CCI period 6 drops below negative CCI period 30 differential, indicating potential upward reversal
• ⬆ Bottom Div — Bullish divergence detected when fast EMA (3) crosses above slow EMA (21)
• ★☆ Confirmed — Star formation signal indicating strong reversal potential
• 📈 ∠45° Uptrend — Appears when price maintains a 45-degree upward angle with bullish confirmation
Bearish Signals
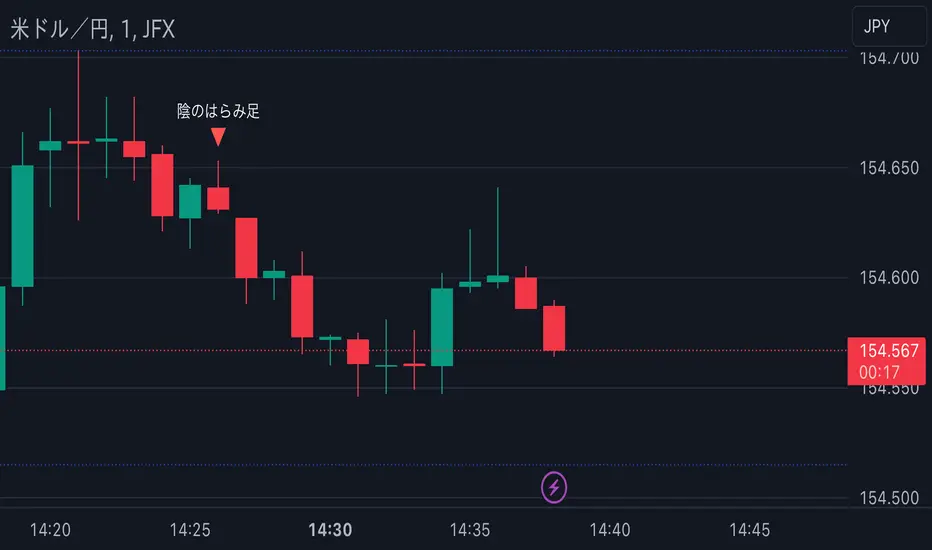
• ▼ Bearish — Appears when CCI period 6 exceeds CCI period 30 differential, indicating potential downward reversal
• ⬇ Top Div — Bearish divergence detected when RSI-based value crosses below 88
Visual Elements
• Green/Red Stepped Lines — Recent 20-bar high (resistance) and low (support) levels
• Trend Fill Colors — Green for uptrend, orange for downtrend
• Signal Candles — Small candlestick markers highlighting signal locations
█ ALERTS
This indicator includes 10 built-in alert conditions:
Individual Signal Alerts
• Bearish Signal — Potential downtrend ahead
• Bullish Signal — Potential uptrend ahead
• Star Confirmed Signal — Strong reversal pattern
• Bottom Divergence (Bullish) — Bullish reversal signal
• Top Divergence (Bearish) — Bearish reversal signal
• 45° Angle Uptrend — Strong bullish momentum
Trend Change Alerts
• Trend Change - Uptrend — Short-term line crossed above mid-term line
• Trend Change - Downtrend — Short-term line crossed below mid-term line
Combined Alerts
• Any Bullish Signal — Triggers on any bullish condition
• Any Bearish Signal — Triggers on any bearish condition
█ RECOMMENDED SETTINGS
• Timeframe — Works on all timeframes; optimal results on 15m to 4H charts
• Market Type — Suitable for forex, stocks, cryptocurrencies, and commodities
• Best Use — Use in conjunction with other confirmation indicators and proper risk management
█ LIMITATIONS
• Signals may produce false positives in strongly trending markets without pullbacks
• Divergence signals work best in ranging or slowly trending markets
• The indicator is based on historical data and cannot predict future price movements
• Multiple signals may appear simultaneously; prioritize based on your trading strategy
• Performance may vary across different asset classes and market conditions
█ NOTES
• This indicator is designed for educational purposes and should not be used as the sole basis for trading decisions
• Always practice proper risk management and use stop-loss orders
• Backtest thoroughly on your preferred instruments before live trading
• The indicator uses max_bars_back=5000 for calculations, ensuring sufficient historical data
• Labels are limited to 500 to maintain chart performance
═════════════════════════════════════════════════════════════════════════
For questions or feedback, use the comments section below.
Indicatore Pine Script®