Arrow-SimplyTrade vol1.5-FinalTitle: Arrow-SimplyTrade vol1.5-Final
Description:
This advanced trading indicator is designed to assist traders in analyzing market trends and identifying optimal entry signals. It combines several popular technical analysis tools and strategies, including EMA (Exponential Moving Average), MA (Simple Moving Averages), Bollinger Bands, and candlestick patterns. This indicator provides both trend-following and counter-trend signals, making it suitable for various trading styles, such as scalping and swing trading.
Main Features:
EMA (Exponential Moving Average):
EMA200 is the main trend line that helps determine the overall market direction. When the price is above EMA200, the trend is considered bullish, and when the price is below EMA200, the trend is considered bearish.
It helps filter out signals that go against the prevailing market trend.
Simple Moving Averages (MA5 and MA15):
This indicator uses two Simple Moving Averages: MA5 (Fast) and MA15 (Slow). Their crossovers create buy or sell signals:
Buy Signal: When MA5 crosses above MA15, signaling a potential upward trend.
Sell Signal: When MA5 crosses below MA15, signaling a potential downward trend.
Bollinger Bands:
Bollinger Bands measure market volatility and can identify periods of overbought or oversold conditions. The Upper and Lower Bands help detect potential breakout points, while the Middle Line (Basis) serves as dynamic support or resistance.
This tool is particularly useful for identifying volatile conditions and potential reversals.
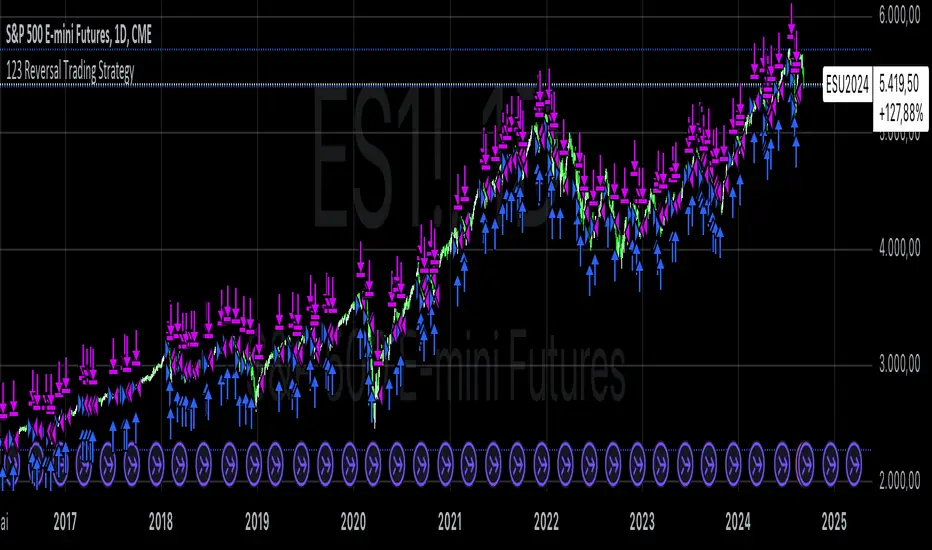
Arrows:
The indicator plots arrows on the chart to signal entry opportunities:
Green Arrows signal buy opportunities (when MA5 crosses above MA15 and price is above EMA200).
Red Arrows signal sell opportunities (when MA5 crosses below MA15 and price is below EMA200).
Opposite Arrows: Optionally, the indicator can also display arrows for counter-trend signals, triggered by MA5 and MA15 crossovers, regardless of the price's position relative to EMA200.
Candlestick Patterns:
The indicator detects popular candlestick patterns such as Bullish Engulfing, Bearish Engulfing, Hammer, and Doji.
These patterns are important for confirming entry points or anticipating trend reversals.
How to Use:
EMA200: The main trend line. If the price is above EMA200, consider long positions. If the price is below EMA200, consider short positions.
MA5 and MA15: Short-term trend indicators. The crossover of these averages generates buy or sell signals.
Bollinger Bands: Use these bands to spot overbought/oversold conditions. Breakouts from the bands may signal potential entry points.
Arrows: Green arrows represent buy signals, and red arrows represent sell signals. Opposite direction arrows can be used for counter-trend strategies.
Candlestick Patterns: Patterns like Bullish Engulfing or Doji can help confirm the signals.
Customizable Settings:
Fully customizable colors, line styles, and display settings for EMA, MAs, Bollinger Bands, and arrows.
The Candlestick Patterns feature can be toggled on or off based on user preference.
Important Notes:
This indicator is intended to be used in conjunction with other analysis tools.
Past performance does not guarantee future results.
Polish:
Tytuł: Arrow-SimplyTrade vol1.5-Final
Opis:
Ten zaawansowany wskaźnik handlowy jest zaprojektowany, aby pomóc traderom w analizie trendów rynkowych oraz identyfikowaniu optymalnych sygnałów wejścia. Łączy w sobie kilka popularnych narzędzi analizy technicznej i strategii, w tym EMA (Wykładnicza Średnia Ruchoma), MA (Prosta Średnia Ruchoma), Bollinger Bands oraz formacje świecowe. Wskaźnik generuje zarówno sygnały podążające za trendem, jak i przeciwnym trendowi, co sprawia, że jest odpowiedni do różnych stylów handlu, takich jak scalping oraz swing trading.
Główne Funkcje:
EMA (Wykładnicza Średnia Ruchoma):
EMA200 to główna linia trendu, która pomaga określić ogólny kierunek rynku. Gdy cena znajduje się powyżej EMA200, trend jest uznawany za wzrostowy, a gdy poniżej EMA200, za spadkowy.
Pomaga to filtrować sygnały, które są niezgodne z głównym trendem rynkowym.
Proste Średnie Ruchome (MA5 i MA15):
Wskaźnik używa dwóch Prostych Średnich Ruchomych: MA5 (szybka) oraz MA15 (wolna). Ich przecięcia generują sygnały kupna lub sprzedaży:
Sygnał Kupna: Kiedy MA5 przecina MA15 od dołu, sygnalizując potencjalny wzrost.
Sygnał Sprzedaży: Kiedy MA5 przecina MA15 od góry, sygnalizując potencjalny spadek.
Bollinger Bands:
Bollinger Bands mierzą zmienność rynku i mogą pomóc w identyfikowaniu okresów wykupienia lub wyprzedania rynku. Górna i dolna linia pomagają wykrywać punkty wybicia, a Środkowa Linia (Basis) działa jako dynamiczny poziom wsparcia lub oporu.
Narzędzie to jest szczególnie przydatne w wykrywaniu warunków zmienności i potencjalnych odwróceń trendu.
Strzałki:
Wskaźnik wyświetla strzałki na wykresie, które wskazują sygnały kupna i sprzedaży:
Zielona strzałka wskazuje sygnał kupna (gdy MA5 przecina MA15 i cena jest powyżej EMA200).
Czerwona strzałka wskazuje sygnał sprzedaży (gdy MA5 przecina MA15 i cena jest poniżej EMA200).
Strzałki w przeciwnym kierunku: Opcjonalna funkcja, która pokazuje strzałki w przeciwnym kierunku, uruchamiane przez przecięcia MA5 i MA15, niezależnie od pozycji ceny względem EMA200.
Formacje Świecowe:
Wskaźnik wykrywa popularne formacje świecowe, takie jak Bullish Engulfing, Bearish Engulfing, Hammer oraz Doji.
Formacje te pomagają traderom potwierdzić punkty wejścia i przewidzieć możliwe odwrócenia trendu.
Jak Używać:
EMA200: Główna linia trendu. Jeśli cena jest powyżej EMA200, rozważaj pozycje długie. Jeśli cena jest poniżej EMA200, rozważaj pozycje krótkie.
MA5 i MA15: Śledzą krótkoterminowe zmiany trendu. Przecięcia tych średnich generują sygnały kupna lub sprzedaży.
Bollinger Bands: Używaj tych pasm do wykrywania wykupionych lub wyprzedanych warunków. Wybicia z pasm mogą wskazywać potencjalne punkty wejścia.
Strzałki: Zielona strzałka wskazuje sygnał kupna, a czerwona strzałka sygnał sprzedaży. Strzałki w przeciwnym kierunku mogą być używane do strategii przeciwtrendowych.
Formacje Świecowe: Formacje takie jak Bullish Engulfing czy Doji mogą pomóc w potwierdzaniu sygnałów.
Ustawienia Personalizacji:
W pełni personalizowalne kolory, style linii i ustawienia wyświetlania dla EMA, MAs, Bollinger Bands oraz strzałek.
Funkcja Formacji Świecowych może być włączana lub wyłączana według preferencji użytkownika.
Ważne Uwagi:
Ten wskaźnik powinien być używany w połączeniu z innymi narzędziami analizy rynku.
Wyniki z przeszłości nie gwarantują wyników w przyszłości.
Indicatore Pine Script®