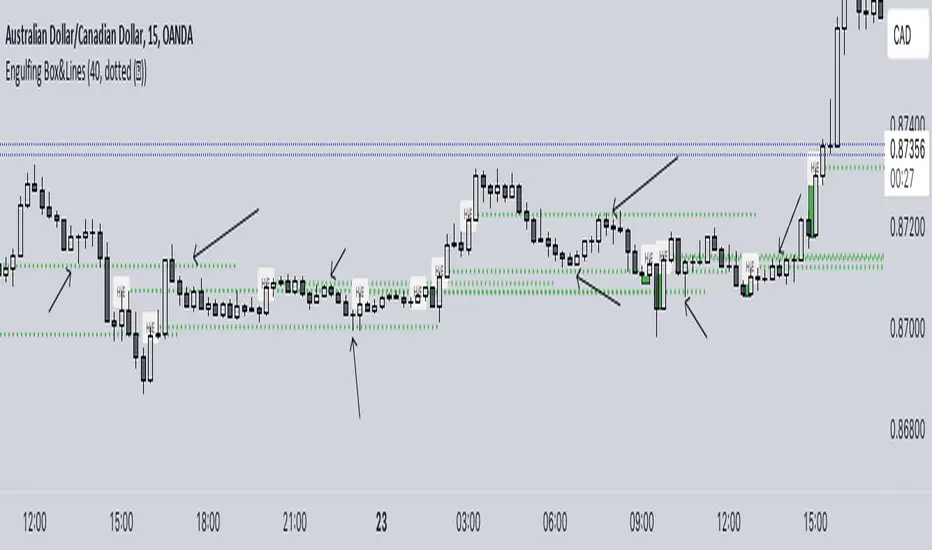
Seasonality Monte Carlo Forecaster [BackQuant]Seasonality Monte Carlo Forecaster
Plain-English overview
This tool projects a cone of plausible future prices by combining two ideas that traders already use intuitively: seasonality and uncertainty. It watches how your market typically behaves around this calendar date, turns that seasonal tendency into a small daily “drift,” then runs many randomized price paths forward to estimate where price could land tomorrow, next week, or a month from now. The result is a probability cone with a clear expected path, plus optional overlays that show how past years tended to move from this point on the calendar. It is a planning tool, not a crystal ball: the goal is to quantify ranges and odds so you can size, place stops, set targets, and time entries with more realism.
What Monte Carlo is and why quants rely on it
• Definition . Monte Carlo simulation is a way to answer “what might happen next?” when there is randomness in the system. Instead of producing a single forecast, it generates thousands of alternate futures by repeatedly sampling random shocks and adding them to a model of how prices evolve.
• Why it is used . Markets are noisy. A single point forecast hides risk. Monte Carlo gives a distribution of outcomes so you can reason in probabilities: the median path, the 68% band, the 95% band, tail risks, and the chance of hitting a specific level within a horizon.
• Core strengths in quant finance .
– Path-dependent questions : “What is the probability we touch a stop before a target?” “What is the expected drawdown on the way to my objective?”
– Pricing and risk : Useful for path-dependent options, Value-at-Risk (VaR), expected shortfall (CVaR), stress paths, and scenario analysis when closed-form formulas are unrealistic.
– Planning under uncertainty : Portfolio construction and rebalancing rules can be tested against a cloud of plausible futures rather than a single guess.
• Why it fits trading workflows . It turns gut feel like “seasonality is supportive here” into quantitative ranges: “median path suggests +X% with a 68% band of ±Y%; stop at Z has only ~16% odds of being tagged in N days.”
How this indicator builds its probability cone
1) Seasonal pattern discovery
The script builds two day-of-year maps as new data arrives:
• A return map where each calendar day stores an exponentially smoothed average of that day’s log return (yesterday→today). The smoothing (90% old, 10% new) behaves like an EWMA, letting older seasons matter while adapting to new information.
• A volatility map that tracks the typical absolute return for the same calendar day.
It calculates the day-of-year carefully (with leap-year adjustment) and indexes into a 365-slot seasonal array so “March 18” is compared with past March 18ths. This becomes the seasonal bias that gently nudges simulations up or down on each forecast day.
2) Choice of randomness engine
You can pick how the future shocks are generated:
• Daily mode uses a Gaussian draw with the seasonal bias as the mean and a volatility that comes from realized returns, scaled down to avoid over-fitting. It relies on the Box–Muller transform internally to turn two uniform random numbers into one normal shock.
• Weekly mode uses bootstrap sampling from the seasonal return history (resampling actual historical daily drifts and then blending in a fraction of the seasonal bias). Bootstrapping is robust when the empirical distribution has asymmetry or fatter tails than a normal distribution.
Both modes seed their random draws deterministically per path and day, which makes plots reproducible bar-to-bar and avoids flickering bands.
3) Volatility scaling to current conditions
Markets do not always live in average volatility. The engine computes a simple volatility factor from ATR(20)/price and scales the simulated shocks up or down within sensible bounds (clamped between 0.5× and 2.0×). When the current regime is quiet, the cone narrows; when ranges expand, the cone widens. This prevents the classic mistake of projecting calm markets into a storm or vice versa.
4) Many futures, summarized by percentiles
The model generates a matrix of price paths (capped at 100 runs for performance inside TradingView), each path stepping forward for your selected horizon. For each forecast day it sorts the simulated prices and pulls key percentiles:
• 5th and 95th → approximate 95% band (outer cone).
• 16th and 84th → approximate 68% band (inner cone).
• 50th → the median or “expected path.”
These are drawn as polylines so you can immediately see central tendency and dispersion.
5) A historical overlay (optional)
Turn on the overlay to sketch a dotted path of what a purely seasonal projection would look like for the next ~30 days using only the return map, no randomness. This is not a forecast; it is a visual reminder of the seasonal drift you are biasing toward.
Inputs you control and how to think about them
Monte Carlo Simulation
• Price Series for Calculation . The source series, typically close.
• Enable Probability Forecasts . Master switch for simulation and drawing.
• Simulation Iterations . Requested number of paths to run. Internally capped at 100 to protect performance, which is generally enough to estimate the percentiles for a trading chart. If you need ultra-smooth bands, shorten the horizon.
• Forecast Days Ahead . The length of the cone. Longer horizons dilute seasonal signal and widen uncertainty.
• Probability Bands . Draw all bands, just 95%, just 68%, or a custom level (display logic remains 68/95 internally; the custom number is for labeling and color choice).
• Pattern Resolution . Daily leans on day-of-year effects like “turn-of-month” or holiday patterns. Weekly biases toward day-of-week tendencies and bootstraps from history.
• Volatility Scaling . On by default so the cone respects today’s range context.
Plotting & UI
• Probability Cone . Plots the outer and inner percentile envelopes.
• Expected Path . Plots the median line through the cone.
• Historical Overlay . Dotted seasonal-only projection for context.
• Band Transparency/Colors . Customize primary (outer) and secondary (inner) band colors and the mean path color. Use higher transparency for cleaner charts.
What appears on your chart
• A cone starting at the most recent bar, fanning outward. The outer lines are the ~95% band; the inner lines are the ~68% band.
• A median path (default blue) running through the center of the cone.
• An info panel on the final historical bar that summarizes simulation count, forecast days, number of seasonal patterns learned, the current day-of-year, expected percentage return to the median, and the approximate 95% half-range in percent.
• Optional historical seasonal path drawn as dotted segments for the next 30 bars.
How to use it in trading
1) Position sizing and stop logic
The cone translates “volatility plus seasonality” into distances.
• Put stops outside the inner band if you want only ~16% odds of a stop-out due to noise before your thesis can play.
• Size positions so that a test of the inner band is survivable and a test of the outer band is rare but acceptable.
• If your target sits inside the 68% band at your horizon, the payoff is likely modest; outside the 68% but inside the 95% can justify “one-good-push” trades; beyond the 95% band is a low-probability flyer—consider scaling plans or optionality.
2) Entry timing with seasonal bias
When the median path slopes up from this calendar date and the cone is relatively narrow, a pullback toward the lower inner band can be a high-quality entry with a tight invalidation. If the median slopes down, fade rallies toward the upper band or step aside if it clashes with your system.
3) Target selection
Project your time horizon to N bars ahead, then pick targets around the median or the opposite inner band depending on your style. You can also anchor dynamic take-profits to the moving median as new bars arrive.
4) Scenario planning & “what-ifs”
Before events, glance at the cone: if the 95% band already spans a huge range, trade smaller, expect whips, and avoid placing stops at obvious band edges. If the cone is unusually tight, consider breakout tactics and be ready to add if volatility expands beyond the inner band with follow-through.
5) Options and vol tactics
• When the cone is tight : Prefer long gamma structures (debit spreads) only if you expect a regime shift; otherwise premium selling may dominate.
• When the cone is wide : Debit structures benefit from range; credit spreads need wider wings or smaller size. Align with your separate IV metrics.
Reading the probability cone like a pro
• Cone slope = seasonal drift. Upward slope means the calendar has historically favored positive drift from this date, downward slope the opposite.
• Cone width = regime volatility. A widening fan tells you that uncertainty grows fast; a narrow cone says the market typically stays contained.
• Mean vs. price gap . If spot trades well above the median path and the upper band, mean-reversion risk is high. If spot presses the lower inner band in an up-sloping cone, you are in the “buy fear” zone.
• Touches and pierces . Touching the inner band is common noise; piercing it with momentum signals potential regime change; the outer band should be rare and often brings snap-backs unless there is a structural catalyst.
Methodological notes (what the code actually does)
• Log returns are used for additivity and better statistical behavior: sim_ret is applied via exp(sim_ret) to evolve price.
• Seasonal arrays are updated online with EWMA (90/10) so the model keeps learning as each bar arrives.
• Leap years are handled; indexing still normalizes into a 365-slot map so the seasonal pattern remains stable.
• Gaussian engine (Daily mode) centers shocks on the seasonal bias with a conservative standard deviation.
• Bootstrap engine (Weekly mode) resamples from observed seasonal returns and adds a fraction of the bias, which captures skew and fat tails better.
• Volatility adjustment multiplies each daily shock by a factor derived from ATR(20)/price, clamped between 0.5 and 2.0 to avoid extreme cones.
• Performance guardrails : simulations are capped at 100 paths; the probability cone uses polylines (no heavy fills) and only draws on the last confirmed bar to keep charts responsive.
• Prerequisite data : at least ~30 seasonal entries are required before the model will draw a cone; otherwise it waits for more history.
Strengths and limitations
• Strengths :
– Probabilistic thinking replaces single-point guessing.
– Seasonality adds a small but meaningful directional bias that many markets exhibit.
– Volatility scaling adapts to the current regime so the cone stays realistic.
• Limitations :
– Seasonality can break around structural changes, policy shifts, or one-off events.
– The number of paths is performance-limited; percentile estimates are good for trading, not for academic precision.
– The model assumes tomorrow’s randomness resembles recent randomness; if regime shifts violently, the cone will lag until the EWMA adapts.
– Holidays and missing sessions can thin the seasonal sample for some assets; be cautious with very short histories.
Tuning guide
• Horizon : 10–20 bars for tactical trades; 30+ for swing planning when you care more about broad ranges than precise targets.
• Iterations : The default 100 is enough for stable 5/16/50/84/95 percentiles. If you crave smoother lines, shorten the horizon or run on higher timeframes.
• Daily vs. Weekly : Daily for equities and crypto where month-end and turn-of-month effects matter; Weekly for futures and FX where day-of-week behavior is strong.
• Volatility scaling : Keep it on. Turn off only when you intentionally want a “pure seasonality” cone unaffected by current turbulence.
Workflow examples
• Swing continuation : Cone slopes up, price pulls into the lower inner band, your system fires. Enter near the band, stop just outside the outer line for the next 3–5 bars, target near the median or the opposite inner band.
• Fade extremes : Cone is flat or down, price gaps to the upper outer band on news, then stalls. Favor mean-reversion toward the median, size small if volatility scaling is elevated.
• Event play : Before CPI or earnings on a proxy index, check cone width. If the inner band is already wide, cut size or prefer options structures that benefit from range.
Good habits
• Pair the cone with your entry engine (breakout, pullback, order flow). Let Monte Carlo do range math; let your system do signal quality.
• Do not anchor blindly to the median; recalc after each bar. When the cone’s slope flips or width jumps, the plan should adapt.
• Validate seasonality for your symbol and timeframe; not every market has strong calendar effects.
Summary
The Seasonality Monte Carlo Forecaster wraps institutional risk planning into a single overlay: a data-driven seasonal drift, realistic volatility scaling, and a probabilistic cone that answers “where could we be, with what odds?” within your trading horizon. Use it to place stops where randomness is less likely to take you out, to set targets aligned with realistic travel, and to size positions with confidence born from distributions rather than hunches. It will not predict the future, but it will keep your decisions anchored to probabilities—the language markets actually speak.
Cerca negli script per "pattern"
Smart Money Proxy IndexOverview
The Smart Money Proxy Index (SMPI) is an educational tool that attempts to identify potential institutional-style behavior patterns using publicly available market data. This comprehensive tool combines multiple institutional analysis techniques into a single, easy-to-read 0-100 oscillator.
Important Disclaimer
This is an educational proxy indicator that analyzes volume and price patterns. It cannot identify actual institutional trading activity and should not be interpreted as tracking real "smart money." Use for educational purposes and combine with other analysis methods.
Inspiration & Methodology
This indicator is inspired by MAPsignals' Big Money Index (BMI) methodology but uses publicly available price and volume data with original calculations. This is an independent educational interpretation designed to teach smart money concepts to retail traders.
What It Analyzes
SMPI tracks potential "smart money" activity by combining:
Block Trading Detection - Identifies unusual volume surges with significant price impact
Money Flow Analysis - Volume-weighted price pressure using Money Flow Index
Accumulation/Distribution Patterns - Modified On-Balance Volume signals
Institutional Control Proxy - End-of-day positioning and control analysis
Key Features
– Multi-Component Analysis - Combines 4 different institutional detection methods
– BMI-Style 0-100 Scale - Familiar oscillator range with clear extreme levels
– Professional Visualization - Dynamic colors, gradient fills, and clean data table
– Comprehensive Alerts - Buy/sell signals plus divergence detection
– Fully Customizable - Adjust all parameters, colors, and display options
– Non-Repainting Signals - All alerts use confirmed data for reliability
– Educational Focus - Designed to teach institutional flow concepts
How to Interpret
Above 80: Potential smart money distribution phase (bearish pressure)
Below 20: Potential smart money accumulation phase (bullish opportunity)
Signal Generation: Buy signals when crossing above 20, sell signals when crossing below 80
Divergences: Price vs SMPI divergences can signal potential trend changes
Volume Confirmation: Higher volume ratios strengthen signal reliability
Best Practices
Timeframes: Works best on higher timeframes for institutional behavior analysis
Confirmation: Combine with other technical analysis tools and market context
Volume: Pay attention to volume confirmation in the data table
Context: Consider overall market conditions and fundamental factors
Risk Management: Not recommended as standalone trading system
Customizable Parameters
Block Volume Threshold: Sensitivity for unusual volume detection (default: 2.5x average)
SMPI Smoothing Period: Index calculation smoothing (default: 25 bars)
Extreme Levels: Overbought/oversold thresholds (default: 80/20)
Money Flow Length: MFI calculation period (default: 14)
Visual Options: Colors, signals, and display preferences
Available Alerts
Buy Signal: SMPI crosses above oversold level (20)
Sell Signal: SMPI crosses below overbought level (80)
Extreme Levels: Alerts when reaching overbought/oversold zones
Divergence Detection: Bullish and bearish price vs SMPI divergences
Educational Purpose & Limitations
This indicator is designed as an educational proxy for understanding institutional flow concepts. It analyzes publicly available price and volume data to identify potential smart money behavior patterns.
Cannot access actual institutional transaction data
Signals may be slower than day-trading indicators (intentionally designed for institutional timeframes)
Should be used in conjunction with other analysis methods
Past performance does not guarantee future results
What Makes This Different
Unlike simple volume or momentum indicators, SMPI combines multiple institutional analysis techniques into one comprehensive tool. The multi-component approach provides a more robust view of potential smart money activity.
Period Highlighter ProPeriod Highlighter Pro is a versatile Pine Script indicator designed to visually highlight specific time periods on your TradingView charts, making it easier to analyze seasonal patterns, trading sessions, or specific weekdays. With customizable settings for months, weekdays, or intraday time ranges, this tool adapts to your trading strategy, allowing you to focus on key periods with precision.
Features
Flexible Highlight Modes: Choose from three modes to highlight:
Month Range: Highlight specific months or a range (e.g., March to June) for seasonal analysis.
Weekday Range: Highlight specific weekdays (e.g., Mondays or Monday to Wednesday) for weekly pattern analysis.
Time Range: Highlight daily time windows (e.g., 15:30–22:00) for intraday session analysis, restricted to weekdays.
Customizable Timezone: Set any IANA timezone (e.g., America/New_York, Europe/London) or UTC offset to align highlights with your preferred market hours.
Historical Range Control: Define how far back to apply highlights with options for years (Month Range), weeks (Weekday Range), or days (Time Range).
Visual Customization: Choose your highlight color to match your chart style.
User-Friendly Inputs: Intuitive dropdowns and tooltips guide you through configuring each mode, ensuring only relevant settings are adjusted.
How It Works
Select a highlight mode and configure the corresponding settings:
Month Range: Pick a start month and an optional end month (or "Disabled" for a single month) and set the number of years back.
Weekday Range: Choose a start weekday and an optional end weekday (or "Disabled" for a single day) and set the number of weeks back.
Time Range: Specify a start and end time (24-hour format) and the number of weekdays back. The indicator then applies a semi-transparent background color to chart bars that meet your criteria, making it easy to spot relevant periods.
Use Cases
Seasonal Traders: Highlight specific months to analyze recurring market patterns.
Day Traders: Focus on active trading sessions (e.g., New York open) with precise time range highlighting.
Weekly Pattern Analysts: Isolate specific weekdays to study price behavior.
Global Traders: Adjust for any timezone to align with your market of interest.
Why Use Period Highlighter Pro?
This indicator simplifies time-based analysis by providing a clear visual overlay for your chosen periods. Whether you're studying historical trends or focusing on specific trading hours, Period Highlighter Pro offers the flexibility and precision to enhance your chart analysis.
Licensed under the Mozilla Public License 2.0.
6FG Plan Checklist & Alerts - Final Version🧠 SCRIPT OVERVIEW: "6FG A+ SETUP - Simplified"
This script is designed to identify high-probability A+ trade setups in alignment with your personal 6FG trading plan, based on:
H1 Break of Structure (required)
4H trend confirmation
15M candle confirmation
Session filter
A+ Label & Visual Table Checklist
✅ KEY COMPONENTS
1. Toggle Inputs
These allow you to customize your view and filters without changing the code:
showSession: Only allow alerts inside Asian or NY sessions
show4hTrend: Include or ignore 4H directional bias
show15mConfirm: Include or ignore confirmation from 15M candles
showTable: Display checklist table on chart
showLabel: Display the “✅ A+” label on qualifying bars
2. Session Filter
Defines valid timeframes for trading (Asian or New York)
Helps avoid setups during low-liquidity hours
Controlled by showSession
3. 4H Trend (Confirmation Only)
Uses a 20-period SMA on 4H to detect general bias:
Bullish = Price above SMA
Bearish = Price below SMA
This trend is not mandatory for an alert if toggle is off
4. H1 Break of Structure (REQUIRED)
Looks at the highest high and lowest low of the last 10 candles on the 1H timeframe
Detects either:
Bullish BOS = Current close > highest high
Bearish BOS = Current close < lowest low
This is the core trigger for the A+ setup
If BOS doesn't happen, no entry is valid
5. 15M Confirmation Candles
(Optional - controlled by show15mConfirm)
Checks for one of three confirmation patterns:
Bullish Engulfing
Bearish Engulfing
Pin Bar
This adds confidence but can be toggled off
6. Entry Conditions (A+ Setup)
All the following must be true for entryOK = true:
✅ H1 BOS (required)
✅ Session is valid (if toggle is on)
✅ 15M confirmation pattern (if toggle is on)
✅ 4H trend (if toggle is on)
7. Visual Output
If entryOK = true:
✅ A green "A+" label appears below price
✅ A checklist table on the top-right shows:
Session status ✔️❌
4H bullish/bearish ✔️❌
H1 BOS ✔️❌
15M confirmation ✔️❌
Final Direction: Bullish / Bearish / —
A+ Setup: ✔️❌
8. Alerts
You will receive a TradingView alert when an A+ Setup is detected:
Engulfing Candles (ATR-Based) with Volume SpikeOverview:
This script is designed to detect high-probability bullish and bearish engulfing patterns — but with a twist: it filters them through ATR-based volatility and confirms strength with volume spikes, all while offering optional trend filtering. It's built for traders who want more than just surface-level candle patterns — it's for those who want contextual confirmation before entering a trade.
What Makes It Different:
Most engulfing candle indicators simply match two candle shapes. This script goes deeper by:
Measuring candle body size relative to recent volatility (via ATR).
Checking for volume confirmation using a dynamic spike threshold.
Filtering based on trend context using SMA-based structure detection.
This tri-layered logic aims to avoid false positives and give traders cleaner, more actionable entries that align with momentum.
Core Concepts:
1. Trend Detection (Optional)
You can choose between two structural filters:
SMA50 only: Looks for price above or below the 50-period SMA to define trend direction.
SMA50 + SMA200 alignment: A stricter rule requiring both fast and slow SMAs to confirm a trend.
Or turn off trend filtering entirely (No detection).
This helps ensure engulfing setups appear in line with the broader trend, increasing the likelihood of continuation.
2. ATR-Filtered Candle Bodies
To eliminate noise:
A candle is only considered a valid engulfing candle if it has a body larger than 1.5× ATR(14).
The previous candle must be a small-bodied candle (less than 0.5× ATR), creating a clear visual engulfing structure.
This method dynamically adjusts for market volatility, so setups are meaningful even during periods of compression or expansion.
3. Volume Spike Confirmation
Not all engulfing candles lead to follow-through. That’s why this script includes a volume confirmation filter:
A 20-period moving average of volume is calculated.
A spike is flagged if the current bar’s volume exceeds 1.5× this average (adjustable).
Patterns with this confirmation are marked with a “*” label (e.g., BU* or BE*) to distinguish volume-backed setups from weaker ones.
Visuals & Alerts:
BU = Bullish engulfing without volume spike
BU* = Bullish engulfing with volume spike
BE = Bearish engulfing without volume spike
BE* = Bearish engulfing with volume spike
A white background highlight is shown behind candles with volume-confirmed engulfing patterns.
Alerts are available for BU* and BE* so you can automate your edge.
How to Use:
Add the indicator to any chart.
Choose your trend filter from the settings panel.
Watch for BU* and BE* labels — these are your highest-conviction signals.
Optional: Combine with support/resistance, Fibonacci zones, or MTF confirmation to refine entries.
Use the included alerts to receive real-time push/email notifications when patterns emerge.
Performance Note:
I’ve found this script to be fairly good when applied to the 1-hour charts of the companies in the US100. The combination of ATR-based filtering and volume confirmation appears to provide clear, high-quality setups with good follow-through potential.
By blending candle patterns, volatility filtering, volume confirmation, and trend context, this script aims to filter out weak signals and highlight the most statistically significant engulfing opportunities.
Liquidity mark-out indicator(by Lumiere)This indicator marks out every High that has a bullish candle followed by a bearish one, vice versa for lows.
Once the price reaches the marked-out liquidity, the line is removed automatically.
This indicator only shows the current liquidity of the time frame you are at.
(To get it look like the picture just chance the length to 30-50)
Key Features of the Liquidity Mark-Out Indicator:
🔹 Identifies Liquidity Zones – Marks highs and lows based on candlestick patterns.
🔹 Customizable Settings – Toggle highs/lows visibility 🎚️, adjust line colors 🎨, and set line length (bars) 📏.
🔹 Smart Clean-Up – Automatically removes swept levels (when price breaks through) for a clean chart 🧹.
🔹 Pattern-Based Detection –
Highs: Detects two-candle reversal patterns (🟢 bullish close → 🔴 bearish close).
Lows: Detects two-candle reversal patterns (🔴 bearish close → 🟢 bullish close).
🔹 Dynamic Lines – Projects liquidity levels forward (adjustable length) to track key zones 📈.
Perfect For Traders Looking To:
✅ Spot potential liquidity grabs 🎯
✅ Identify key support/resistance levels 🛑
✅ Clean up their chart from outdated levels 🖥️
PCA Regime-Adjusted MomentumSummary
The PCA Regime-Adjusted Momentum (PCA-RAM) is an advanced market analysis tool designed to provide nuanced insights into market momentum and structural stability. It moves beyond traditional indicators by using Principal Component Analysis (PCA) to deconstruct market data into its most essential patterns.
The indicator provides two key pieces of information:
A smoothed momentum signal based on the market's dominant underlying trend.
A dynamic regime filter that gauges the stability and clarity of the market's structure, advising you when to trust or fade the momentum signals.
This allows traders to not only identify potential shifts in momentum but also to understand the context and confidence behind those signals.
Core Concepts & Methodology
The strength of this indicator lies in its sound, data-driven methodology.
1. Principal Component Analysis (PCA)
At its core, the indicator analyzes a rolling window (default 50 periods) of standardized market data (Open, High, Low, Close, and Volume). PCA is a powerful statistical technique that distills this complex, 5-dimensional data into its fundamental, uncorrelated components of variance. We focus on the First Principal Component (PC1), which represents the single most dominant pattern or "theme" driving the market's behavior in the lookback window.
2. The Momentum Signal
Instead of just looking at price, we project the current market data onto this dominant underlying pattern (PC1). This gives us a raw "projection score" that measures how strongly the current bar aligns with the historically dominant market structure. This raw score is then smoothed using two an exponential moving averages (a fast and a slow line) to create a clear, actionable momentum signal, similar in concept to a MACD.
3. The Dynamic Regime Filter
This is arguably the indicator's most powerful feature. It answers the question: "How clear is the current market picture?"
It calculates the Market Concentration Ratio, which is the percentage of total market variance explained by PC1 alone.
A high ratio indicates that the market is moving in a simple, one-dimensional way (e.g., a clear, strong trend).
A low ratio indicates the market is complex, multi-dimensional, and choppy, with no single dominant theme.
Crucially, this filter is dynamic. It compares the current concentration ratio to its own recent average, allowing it to adapt to any asset or timeframe. It automatically learns what "normal" and "choppy" look like for the specific chart you are viewing.
How to Interpret the Indicator
The indicator is displayed in a separate pane with two key visual elements:
The Momentum Lines (White & Gold)
White Line: The "Fast Line," representing the current momentum.
Gold Line: The "Slow Line," acting as the trend confirmation.
Bullish Signal: A crossover of the White Line above the Gold Line suggests a shift to positive momentum.
Bearish Signal: A crossover of the White Line below the Gold Line suggests a shift to negative momentum.
The Regime Filter (Purple & Dark Red Background)
This is your confidence gauge.
Navy Blue Background (High Concentration): The market structure is stable, simple, and trending. Momentum signals are more reliable and should be given higher priority.
Dark Red Background (Low Concentration): The market structure is complex, choppy, or directionless. Momentum signals are unreliable and prone to failure or "whipsaws." This is a signal to be cautious, tighten stops, or potentially stay out of the market.
Potential Trading Strategies
This tool is versatile and can be used in several ways:
1. Primary Signal Strategy
Condition: Wait for the background to turn Purple, confirming a stable, high-confidence regime.
Entry: Take the next crossover signal from the momentum lines (White over Gold for long, White under Gold for short).
Exit/Filter: Consider exiting positions or ignoring new signals when the background turns Navy.
2. As a Confirmation or Filter for Your Existing Strategy
Do you have a trend-following system? Only enable its long and short signals when the PCA-RAM background is Purple.
Do you have a range-trading or mean-reversion system? It might be most effective when the PCA-RAM background is Navy, indicating a lack of a clear trend.
3. Advanced Divergence Analysis
Look for classic divergences between price and the momentum lines. For example, if the price is making a new high, but the Gold Line is making a lower high, it may indicate underlying weakness in the trend, even on a Purple background. This divergence signal is more powerful because it shows that the new price high is not being confirmed by the market's dominant underlying pattern.
Inside/Outside Bar Sequence Detector# Inside/Outside Bar Sequence Detector
## English Description
**Inside/Outside Bar Sequence Detector**
This indicator identifies and visualizes sequences of Inside and Outside bars on any chart. It highlights important price action patterns that can signal potential market reversals or continuation moves.
**Key Features:**
- Automatically detects consecutive Inside bars (where price action is contained within the previous bar's range) and Outside bars (where price action exceeds the previous bar's range)
- Displays sequences with customizable labels showing the pattern type
- Highlights the price range of each sequence with a transparent box
- Marks individual Inside bars with "i" and Outside bars with "o" below each candle
- Applies special pattern recognition rules for more accurate trade signals
- Fully customizable appearance including colors, opacity, and label positioning
Adjust the minimum sequence length according to your trading timeframe and strategy to filter out noise and focus on significant patterns.
## 中文描述
**内包/外包K线序列检测器**
这个指标可以识别并可视化任何图表上的内包和外包K线序列。它突出显示重要的价格行为模式,这些模式可能预示市场潜在的反转或延续走势。
**主要特点:**
- 自动检测连续的内包K线(价格活动被限制在前一根K线范围内)和外包K线(价格活动超出前一根K线范围)
- 通过可自定义的标签显示模式类型
- 用透明框突出显示每个序列的价格范围
- 在每根K线下方用"i"标记内包蜡烛,用"o"标记外包蜡烛
- 应用特殊模式识别规则,提供更准确的交易信号
- 完全可自定义的外观,包括颜色、透明度和标签位置
根据您的交易时间框架和策略调整最小序列长度,以过滤噪音并专注于重要模式。
3 Candles Gap3 Candle Gap Indicator is made to detect these types of patterns:
1. 3 consecutive bullish or bearish candles
2. the middle candle true body (body excluding shadows) has a part that is not covered by previous and next candle shadows (gap)
This pattern helps traders to detect candles where price has moved in a direction and gap has formed (price is not covered by previous or next candles shadows), this is a signal showing price momentum where one side (bulls/bears) is so powerful at moving the price that the other side (bears/bulls) can't get price back to cover the gap.
This indicator has "repainting" by 1 candle which means, it uses the data from future to work, however this future data does not go further than 1 candle.
HarmonicMapLibLibrary "HarmonicMapLib"
Harmonic Pattern Library implementation utilising maps
method tostring(this)
convert Range value to string
Namespace types: Range
Parameters:
this (Range) : Range value
Returns: converted string representation
method tostring(this)
convert array of Range value to string
Namespace types: array
Parameters:
this (array) : array object
Returns: converted string representation
method tostring(this)
convert map of string to Range value to string
Namespace types: map
Parameters:
this (map) : map object
Returns: converted string representation
method tostring(this)
convert RatioMap to string
Namespace types: RatioMap
Parameters:
this (RatioMap) : RatioMap object
Returns: converted string representation
method tostring(this)
convert array of RatioMap to string
Namespace types: array
Parameters:
this (array) : array object
Returns: converted string representation
method tostring(this)
convert map of string to RatioMap to string
Namespace types: map
Parameters:
this (map) : map object
Returns: converted string representation
method tostring(this)
convert map of string to bool to string
Namespace types: map
Parameters:
this (map) : map object
Returns: converted string representation
method tostring(this)
convert PrzRange to string
Namespace types: PrzRange
Parameters:
this (PrzRange) : PrzRange object
Returns: converted string representation
method tostring(this)
convert array of PrzRange to string
Namespace types: array
Parameters:
this (array) : array object
Returns: converted string representation
getHarmonicMap()
Creates the RatioMap for harmonic patterns
Returns: map haronic ratio rules for all patterns
method evaluate(patternsMap, pattern, ratioRange, properties, ratioValue)
evaluates harmonic ratio range
Namespace types: map
Parameters:
patternsMap (map) : parameter containing valid pattern names
pattern (string) : Pattern type to be evaluated
ratioRange (Range) : ratio range to be checked
properties (ScanProperties) : Scan Properties
ratioValue (float)
Returns: void
method evaluate(przRange, pattern, ratioRange, priceRange, properties)
Evaluate PRZ ranges
Namespace types: map
Parameters:
przRange (map)
pattern (string) : Pattern name
ratioRange (Range) : Range of ratio for the pattern
priceRange (Range) : Price range based on ratio
properties (ScanProperties) : ScanProperties object
Returns: void
method scanRatio(currentPatterns, rules, properties, ratioName, ratioValue)
Scan for particular named ratio of harmonic pattern to filter valid patterns
Namespace types: map
Parameters:
currentPatterns (map) : Current valid patterns map
rules (map) : map Harmonic ratio rules
properties (ScanProperties) : ScanProperties object
ratioName (string) : Specific ratio name
ratioValue (float) : ratio value to be checked
Returns: updated currentPatterns object
method scanPatterns(patterns, x, a, b, c, d, properties)
Scan for patterns based on X, A, B, C, D values
Namespace types: map
Parameters:
patterns (map) : List of allowed patterns
x (float) : X coordinate
a (float) : A coordinate
b (float) : B coordinate
c (float) : C coordinate
d (float) : D coordinate
properties (ScanProperties) : ScanProperties object. If na, default values are initialised
Returns: updated valid patterns map
method scanProjections(patterns, x, a, b, c, properties)
Scan for projections based on X, A, B, C values
Namespace types: map
Parameters:
patterns (map) : List of allowed patterns
x (float) : X coordinate
a (float) : A coordinate
b (float) : B coordinate
c (float) : C coordinate
properties (ScanProperties) : ScanProperties object. If na, default values are initialised
Returns: updated valid projections map
method merge(this, other)
merge two ranges into one
Namespace types: Range
Parameters:
this (Range) : first range
other (Range) : second range
Returns: combined range
method union(this, other)
union of two ranges into one
Namespace types: Range
Parameters:
this (Range) : first range
other (Range) : second range
Returns: union range
method overlaps(this, other)
checks if two ranges intersect
Namespace types: Range
Parameters:
this (Range) : first range
other (Range) : second range
Returns: true if intersects, false otherwise
method consolidate(this)
Consolidate ranges into PRZ
Namespace types: map
Parameters:
this (map) : map of Ranges
Returns: consolidated PRZ
method consolidateMany(this)
Consolidate ranges into multiple PRZ ranges
Namespace types: map
Parameters:
this (map) : map of Ranges
Returns: consolidated array of PRZ ranges
method getRange(currentPatterns, x, a, b, c, properties)
Get D range based on X, A, B, C coordinates for the current patterns
Namespace types: map
Parameters:
currentPatterns (map) : List of valid patterns
x (float) : X coordinate
a (float) : A coordinate
b (float) : B coordinate
c (float) : C coordinate
properties (ScanProperties) : ScanProperties object. If na, default values are initialised
Returns: map of D ranges
method getPrzRange(currentPatterns, x, a, b, c, properties)
Get PRZ range based on X, A, B, C coordinates for the current patterns
Namespace types: map
Parameters:
currentPatterns (map) : List of valid patterns
x (float) : X coordinate
a (float) : A coordinate
b (float) : B coordinate
c (float) : C coordinate
properties (ScanProperties) : ScanProperties object. If na, default values are initialised
Returns: PRZRange for the pattern
method getProjectionRanges(currentPatterns, x, a, b, c, properties)
Get projection range based on X, A, B, C coordinates for the current patterns
Namespace types: map
Parameters:
currentPatterns (map) : List of valid patterns
x (float) : X coordinate
a (float) : A coordinate
b (float) : B coordinate
c (float) : C coordinate
properties (ScanProperties) : ScanProperties object. If na, default values are initialised
Returns: array of projection ranges
Range
Collection of range values
Fields:
values (array) : array of float values
RatioMap
ratio map for pattern
Fields:
ratioMap (map) : map of string to Range (array of float)
ScanProperties
Pattern Scanning properties
Fields:
strictMode (series bool) : strict scanning mode will check for overflows
logScale (series bool) : scan ratios in log scale
errorMin (series float) : min error threshold
errorMax (series float)
mintick (series float) : minimum tick value of price
PrzRange
Potential reversal zone range
Fields:
patterns (array) : array of pattern names for the given XABCD combination
prz (Range) : PRZ range
Fibonacci-Only Strategy V2Fibonacci-Only Strategy V2
This strategy combines Fibonacci retracement levels with pattern recognition and statistical confirmation to identify high-probability trading opportunities across multiple timeframes.
Core Strategy Components:
Fibonacci Levels: Uses key Fibonacci retracement levels (19% and 82.56%) to identify potential reversal zones
Pattern Recognition: Analyzes recent price patterns to find similar historical formations
Statistical Confirmation: Incorporates statistical analysis to validate entry signals
Risk Management: Includes customizable stop loss (fixed or ATR-based) and trailing stop features
Entry Signals:
Long entries occur when price touches or breaks the 19% Fibonacci level with bullish confirmation
Short entries require Fibonacci level interaction, bearish confirmation, and statistical validation
All signals are visually displayed with color-coded markers and dashboard
Trading Method:
When a triangle signal appears, open a position on the next candle
Alternatively, after seeing a signal on a higher timeframe, you can switch to a lower timeframe to find a more precise entry point
Entry signals are clearly marked with visual indicators for easy identification
Risk Management Features:
Adjustable stop loss (percentage-based or ATR-based)
Optional trailing stops for protecting profits
Multiple take-profit levels for strategic position exit
Customization Options:
Timeframe selection (1m to Daily)
Pattern length and similarity threshold adjustment
Statistical period and weight configuration
Risk parameters including stop loss and trailing stop settings
This strategy is particularly well-suited for cryptocurrency markets due to their tendency to respect Fibonacci levels and technical patterns. Crypto's volatility is effectively managed through the customizable stop-loss and trailing-stop mechanisms, making it an ideal tool for traders in digital asset markets.
For optimal performance, this strategy works best on higher timeframes (30m, 1h and above) and is not recommended for low timeframe scalping. The Fibonacci pattern recognition requires sufficient price movement to generate reliable signals, which is more consistently available in medium to higher timeframes.
Users should avoid trading during sideways market conditions, as the strategy performs best during trending markets with clear directional movement. The statistical confirmation component helps filter out some sideways market signals, but it's recommended to manually avoid ranging markets for best results.
Double Top/Bottom Fractals DetectorDouble Top/Bottom Detector with Williams Fractals (Extended + Early Signal)
This indicator combines the classic Williams Fractals methodology with an enhanced mechanism to detect potential reversal patterns—namely, double tops and double bottoms. It does so by using two separate detection schemes:
Confirmed Fractals for Pattern Formation:
The indicator calculates confirmed fractals using the traditional Williams Fractals rules. A fractal is confirmed if a bar’s high (for an up fractal) or low (for a down fractal) is the highest or lowest compared to a specified number of bars on both sides (default: 2 bars on the left and 2 on the right).
Once a confirmed fractal is identified, its price (high for tops, low for bottoms) and bar index are stored in an internal array (up to the 10 most recent confirmed fractals).
When a new confirmed fractal appears, the indicator compares it with previous confirmed fractals. If the new fractal is within a user-defined maximum bar distance (e.g., 20 bars) and the price difference is within a specified tolerance (default: 0.8%), the indicator assumes that a double top (if comparing highs) or a double bottom (if comparing lows) pattern is forming.
A signal is then generated by placing a label on the chart—SELL for a double top and BUY for a double bottom.
Early Signal Generation:
To capture potential reversals sooner, the indicator also includes an “early signal” mechanism. This uses asymmetric offsets different from the confirmed fractal calculation:
Signal Right Offset: Defines the candidate bar used for early signal detection (default is 1 bar).
Signal Left Offset: Defines the number of bars to the left of the candidate that must confirm the candidate’s price is the extreme (default is 2 bars).
For an early top candidate, the candidate bar’s high must be greater than the highs of the bars specified by the left offset and also higher than the bar immediately to its right. For an early bottom candidate, the corresponding condition applies for lows.
If the early candidate’s price level is within the acceptable tolerance when compared to any of the previously stored confirmed fractals (again, within the allowed bar distance), an early signal is generated—displayed as SELL_EARLY or BUY_EARLY.
The early signal block can be enabled or disabled via a checkbox input, allowing traders to choose whether to use these proactive signals.
Key Parameters:
n:
The number of bars used to confirm a fractal. The fractal is considered valid if the bar’s high (or low) is higher (or lower) than the highs (or lows) of the preceding and following n bars.
maxBarsApart:
The maximum number of bars allowed between two fractals for them to be considered part of the same double top or bottom pattern.
tolerancePercent:
The maximum allowed percentage difference (default: 0.8%) between the high (or low) values of two fractals to qualify them as matching for the pattern.
signalLeftOffset & signalRightOffset:
These parameters define the asymmetric offsets for early signal detection. The left offset (default: 2) specifies how many bars to look back, while the right offset (default: 1) specifies the candidate bar’s position.
earlySignalsEnabled:
A checkbox option that allows users to enable or disable early signal generation. When disabled, the indicator only uses confirmed fractal signals.
How It Works:
Fractal Calculation and Plotting:
The confirmed fractals are calculated using the traditional method, ensuring robust identification by verifying the pattern with a symmetrical offset. These confirmed fractals are plotted on the chart using triangle shapes (upwards for potential double bottoms and downwards for potential double tops).
Pattern Detection:
Upon detection of a new confirmed fractal, the indicator checks up to 10 previous fractals stored in internal arrays. If the new fractal’s high or low is within the tolerance range and close enough in terms of bars to one of the stored fractals, it signifies the formation of a double top or double bottom. A corresponding SELL or BUY label is then placed on the chart.
Early Signal Feature:
If enabled, the early signal block checks for candidate bars based on the defined asymmetric offsets. These candidates are evaluated to see if their high/low levels meet the early confirmation criteria relative to nearby bars. If they also match one of the confirmed fractal levels (within tolerance and bar distance), an early signal is issued with a label (SELL_EARLY or BUY_EARLY) on the chart.
Benefits for Traders:
Timely Alerts:
By combining both confirmed and early signals, the indicator offers a proactive approach to detect reversals sooner, potentially improving entry and exit timing.
Flexibility:
With adjustable parameters (including the option to disable early signals), traders can fine-tune the indicator to better suit different markets, timeframes, and trading styles.
Enhanced Pattern Recognition:
The dual-layered approach (confirmed fractals plus early detection) helps filter out false signals and captures the essential formation of double tops and bottoms more reliably.
Candle Emotion Index (CEI)The Candle Emotion Index (CEI) is a comprehensive sentiment analysis indicator that combines three sub-oscillators—Indecision Oscillator, Fear Oscillator, and Greed Oscillator—to provide a single, unified measure of market sentiment. By analyzing bullish, bearish, and indecisive candlestick patterns, the CEI delivers a holistic view of market emotions and helps traders identify key turning points.
How It Works
Indecision Oscillator: Measures market uncertainty using Doji and Spinning Top candlestick patterns. Scores their presence and normalizes the results over a user-defined lookback period.
Fear Oscillator: Measures bearish sentiment using Shooting Star, Hanging Man, and Bearish Engulfing candlestick patterns. Scores their presence and normalizes the results over a user-defined lookback period.
Greed Oscillator: Measures bullish sentiment using Marubozu, Bullish Engulfing, Hammer, and Three White Soldiers candlestick patterns. Scores their presence and normalizes the results over a user-defined lookback period.
Candle Emotion Index Calculation: The CEI is calculated as the average of the Indecision, Fear, and Greed Oscillators: CEI = (Indecision Oscillator + Fear Oscillator + Greed Oscillator) / 3
Plotting: The CEI is plotted as a single line on the chart, representing overall market sentiment.
Reference lines are added to indicate Low Emotion, Neutral, and High Emotion levels.
The Candle Emotion Index provides a unified perspective on market sentiment by blending indecision, fear, and greed into one easy-to-interpret metric. It serves as a powerful tool for traders seeking to gauge market psychology and identify high-probability trading opportunities. For best results, use the CEI in conjunction with other technical indicators to confirm signals.
Enigma Liquidity Concept
Empowering Traders with Multi-Timeframe Analysis and Dynamic Fibonacci Insights
Overview
The Enigma Liquidity Concept is an advanced indicator designed to bridge multi-timeframe price action with Fibonacci retracements. It provides traders with high-probability buy and sell signals by combining higher time frame market direction and lower time frame precision entries. Whether you're a scalper, day trader, or swing trader, this tool offers actionable insights to refine your entries and exits.
What Makes It Unique?
Multi-Timeframe Signal Synchronization:
Higher time frame bullish or bearish engulfing patterns are used to define the directional bias.
Lower time frame retracements are analyzed for potential entry opportunities.
Dynamic Fibonacci Layouts:
Automatically plots Fibonacci retracement levels for the most recent higher time frame signal.
Ensures a clean chart by avoiding clutter from historical signals.
Actionable Buy and Sell Signals:
Sell Signal: When the higher time frame is bearish and the price on the lower time frame retraces above the 50% Fibonacci level before forming a bearish candle.
Buy Signal: When the higher time frame is bullish and the price on the lower time frame retraces below the 50% Fibonacci level before forming a bullish candle.
Customizable Fibonacci Visuals:
Full control over Fibonacci levels, line styles, and background shading to tailor the chart to your preferences.
Integrated Alerts:
Real-time alerts for buy and sell signals on the lower time frame.
Alerts for bullish and bearish signals on the higher time frame.
How It Works
Higher Time Frame Analysis:
The indicator identifies bullish and bearish engulfing patterns to detect key reversals or continuation points.
Fibonacci retracement levels are calculated and plotted dynamically for the most recent signal:
Bullish Signal: 100% starts at the low, 0% at the high.
Bearish Signal: 100% starts at the high, 0% at the low.
Lower Time Frame Execution:
Monitors retracements relative to the higher time frame Fibonacci levels.
Provides visual and alert-based buy/sell signals when conditions align for a high-probability entry.
How to Use It
Setup:
Select your higher and lower time frames in the settings.
Customize Fibonacci levels, line styles, and background visuals for clarity.
Trade Execution:
Use the higher time frame signals to determine directional bias.
Watch for actionable buy/sell signals on the lower time frame:
Enter short trades on red triangle sell signals.
Enter long trades on green triangle buy signals.
Alerts:
Enable alerts for real-time notifications of buy/sell signals on lower time frames and higher time frame directional changes.
Concepts Underlying the Calculations
Engulfing Patterns: Represent key reversals or continuations in price action, making them reliable for defining directional bias on higher time frames.
Fibonacci Retracements: Fibonacci levels are used to identify critical zones for potential price reactions during retracements.
Multi-Timeframe Analysis: Combines the strength of higher time frame trends with the precision of lower time frame signals to enhance trades.
Important Notes
This indicator is best used in conjunction with your existing trading strategy and risk management plan.
It does not repaint signals and ensures clarity by displaying Fibonacci levels only for the most recent signal.
Ideal For:
Swing traders, day traders, and scalpers looking to optimize entries and exits with Fibonacci retracements.
Traders who prefer clean charts with actionable insights and customizable visuals.
Inside/Outside Bar Direction Highlighter
Here’s a trading indicator in Pine Script (v6) that combines the essence of the Inside Bar, Outside Bar, and directional patterns inspired by TT3 Theory. This indicator highlights bars based on their classification as inside, outside, or directional and provides potential trade signals.
Inside Outside Indicator
Explanation:
Bar Classification:
Inside Bar: Current high is less than the previous high, and the low is greater than the previous low.
Outside Bar: Current high exceeds the previous high, and the low breaks below the previous low.
Up/Down Bars: Closing prices relative to the previous high/low.
Visual Highlights:
Bars are visually highlighted with colors for easy identification.
Trade Signals:
Long Signal: When the close crosses above the previous high and it's a directional up bar.
Short Signal: When the close crosses below the previous low and it's a directional down bar.
Customizable Inputs:
Colors for inside, outside, up, and down bars can be modified.
You can copy and paste this script into the Pine Editor on TradingView to see it in action. Adjust the logic to fit your trading strategy as needed.
You said:
summary of how to use this indicator without buy/sell signal
ChatGPT said:
ChatGPT
How to Use the Inside/Outside Bar Direction Highlighter Indicator (Without Buy/Sell Signals)
Understand the Bar Classifications:
Inside Bars: Highlighted in blue (default). These indicate periods of market consolidation. Look for potential breakouts in either direction.
Outside Bars: Highlighted in orange (default). These represent increased volatility, where both higher highs and lower lows are made. Watch for reversals or continuations based on broader trends.
Directional Up Bars: Highlighted in green (default). These occur when the current close is above the previous high, signaling bullish momentum.
Directional Down Bars: Highlighted in red (default). These occur when the current close is below the previous low, indicating bearish momentum.
Identify Key Patterns:
Use the highlighted bars to spot price action setups, such as:
Breakouts from inside bars.
Reversal signals following outside bars.
Continuation patterns when directional bars align with the trend.
Combine with Your Analysis:
Trend Analysis: Match bar classifications with trend direction on larger timeframes (e.g., daily, 4-hour).
Support/Resistance: Use inside and outside bars near key levels for confirmation or reversal signals.
Volume: Higher volume on directional bars strengthens the momentum signal.
Customize the Colors:
Adjust the bar highlight colors to fit your chart theme for better visibility.
No Automatic Signals:
This indicator doesn’t provide explicit buy/sell recommendations. Instead, use the visual highlights to make informed decisions based on your trading strategy.
By interpreting these bar patterns, you can better gauge market behavior and make more confident decisions without relying on preset signals.
ForecastPro by BinhMyco1. Overview:
This Pine Script implements a custom forecasting tool on TradingView, labeled "BinhMyco." It provides a method to predict future price movements based on historical data and a comparison with similar historical patterns. The script supports two types of forecasts: **Prediction** and **Replication**, where the forecasted price can be either based on price peaks/troughs or an average direction. The script also calculates a confidence probability, showing how closely the forecasted data aligns with historical trends.
2. Inputs:
- Source (`src`): The input data source for forecasting, which defaults to `open`.
- Length (`len`): The length of the training data used for analysis (fixed at 200).
- Reference Length (`leng`): A fixed reference length for comparing similar historical patterns (set to 70).
- Forecast Length (`length`): The length of the forecast period (fixed at 60).
- Multiplier (`mult`): A constant multiplier for the forecast confidence cone (set to 4.0).
- Forecast Type (`typ`): Type of forecast, either **Prediction** or **Replication**.
- Direction Type (`dirtyp`): Defines how the forecast is calculated — either based on price **peaks/troughs** or an **average direction**.
- Forecast Divergence Cone (`divcone`): A boolean option to enable the display of a confidence cone around the forecast.
3. Color Constants:
- Green (`#00ffbb`): Color used for upward price movements.
- Red (`#ff0000`): Color used for downward price movements.
- Reference Data Color (`refcol`): Blue color for the reference data.
- Similar Data Color (`simcol`): Orange color for the most similar data.
- Forecast Data Color (`forcol`): Yellow color for forecasted data.
4. Error Checking:
- The script checks if the reference length is greater than half the training data length, and if the forecast length exceeds the reference length, raising errors if either condition is true.
5. Arrays for Calculation:
- Correlation Array (`c`): Holds the correlation values between the data source (`src`) and historical data points.
- Index Array (`index`): Stores the indices of the historical data for comparison.
6. Forecasting Logic:
- Correlation Calculation: The script calculates the correlation between the historical data (`src`) and the reference data over the given reference length. It then identifies the point in history most similar to the current data.
- Forecast Price Calculation: Based on the type of forecast (Prediction or Replication), the script calculates future prices either by predicting based on similar bars or by replicating past data. The forecasted prices are stored in the `forecastPrices` array.
- Forecast Line Drawing: The script draws lines to represent the forecasted price movements. These lines are color-coded based on whether the forecasted price is higher or lower than the current price.
7. Divergence Cone (Optional):
- If the **divcone** option is enabled, the script calculates and draws a confidence cone around the forecasted prices. The upper and lower bounds of the cone are calculated using a standard deviation factor, providing a visual representation of forecast uncertainty.
8. Probability Table:
- A table is displayed on the chart, showing the probability of the forecast being accurate. This probability is calculated using the correlation between the current data and the most similar historical pattern. If the probability is positive, the table background turns green; if negative, it turns red. The probability is presented as a percentage.
9. Key Functions:
- `highest_range` and `lowest_range`: Functions to find the highest and lowest price within a range of bars.
- `ftype`: Determines the forecast type (Prediction or Replication) and adjusts the forecasting logic accordingly.
- `ftypediff`: Computes the difference between the forecasted and actual prices based on the selected forecast type.
- `ftypelim`, `ftypeleft`, `ftyperight`: Additional functions to adjust the calculation of the forecast based on the forecast type.
10. Conclusion:
The "ForecastPro" script is a unique tool for forecasting future price movements on TradingView. It compares historical price data with similar historical trends to generate predictions. The script also offers a customizable confidence cone and displays the probability of the forecast's accuracy. This tool provides traders with valuable insights into future price action, potentially enhancing decision-making in trading strategies.
---
This script provides advanced functionality for traders who wish to explore price forecasting, and can be customized to fit various trading styles.
1-3-1 Strat Combo with 50% Level (12h)Logic Explanation
1-3-1 Combo Detection:
The script detects the 1-3-1 pattern using the previous 3 candles:
Candle 4: Inside Bar (Type 1).
Candle 3: Outside Bar (Type 3).
Candle 2: Inside Bar (Type 1).
4th Candle Behavior:
If the 4th candle (current bar):
Stays an inside bar (Type 1) → isFourthInsideBar is true.
Becomes a directional bar (Type 2) → isFourthDirectional is true.
If either of these conditions is true, the script stops calculating and waits for the next valid 1-3-1 setup.
50% Level Calculation:
If the conditions are not met (e.g., the 4th candle doesn’t stop the pattern), the script:
Plots a dotted line at the 50% level of the 3rd candle.
Adds a label showing the 50% level.
Stop Calculations:
No line, box, or label is drawn if the 4th candle is a Type 1 (inside bar) or Type 2 (directional bar).
Visual Outputs:
Dotted Box: Marks the 1-3-1 combo setup.
50% Line: Drawn only if the 4th candle does not invalidate the pattern.
Label: Displays the 50% level of the 3rd candle.
How to Use:
Apply this script on the 12-hour chart.
The script will:
Detect valid 1-3-1 patterns.
Stop drawing any calculations if the 4th candle is an inside bar (1) or a directional bar (2).
Wait for the next valid 1-3-1 combo.
Alternative Price [OmegaTools]The Alternative Price script is a sophisticated and flexible indicator designed to redefine how traders visualize and interpret price data. By offering multiple unique charting modes, robust customization options, and advanced features, this tool provides a comprehensive alternative to traditional price charts. It is particularly useful for identifying market trends, detecting patterns, and simplifying complex data into actionable insights.
This script is highly versatile, allowing users to choose from five distinct charting modes: Candles, Line, Channel, Renko, and Bubbles. Each mode serves a unique purpose and presents price information in an innovative way. When using this script, it is strongly recommended to hide the platform’s default price candles or chart data. Doing so will eliminate redundancy and provide a clearer and more focused view of the alternative price visualization.
The Candles mode offers a traditional candlestick charting style but with added flexibility. Users can choose to enable smoothed opens or smoothed closes, which adjust the way the open and close prices are calculated. When smoothed opens are enabled, the opening price is computed as the average of the actual open price and the closing prices of the previous two bars. This creates a more gradual representation of price transitions, particularly useful in markets prone to sudden spikes or irregularities. Similarly, smoothed closes modify the closing price by averaging it with the previous close, the high-low midpoint, and an exponential moving average of the high-low-close mean. This technique filters out noise, making trends and price momentum easier to identify.
In the Line mode, the script displays a simple line chart that connects the smoothed closing prices. This mode is ideal for traders who prefer minimalism or need to focus on the overall trend without the distraction of individual bar details. The Channel mode builds upon this by plotting additional lines representing the highs and lows of each bar. The resulting visualization resembles a price corridor that helps identify support and resistance zones or price compression areas.
The Renko mode introduces a more advanced and noise-filtering method of visualizing price movements. Renko charts, constructed using the ATR (Average True Range) as a baseline, display blocks that represent a specific price range. The script dynamically calculates the size of these blocks based on ATR, with separate thresholds for upward and downward movements. This makes Renko mode particularly effective for identifying sustained trends while ignoring minor price fluctuations. Additionally, the open and close values of Renko blocks can be smoothed to further refine the visualization.
The Bubbles mode represents price activity using circles or bubbles whose size corresponds to relative volume. This mode provides a quick and intuitive way to assess market participation at different price levels. Larger bubbles indicate higher trading volumes, while smaller bubbles highlight periods of lower activity. This visualization is particularly valuable in understanding the relationship between price movements and market liquidity.
The coloring of candles and other chart elements is a core feature of this script. Users can select between two color modes: Normal and Volume. In Normal mode, bullish candles are displayed in the user-defined bullish color, while bearish candles use the bearish color. Neutral elements, such as midpoints or undecided price movements, are shaded with a neutral color. In Volume mode, the candle colors are dynamically adjusted based on trading volume. A gradient color scale is applied, where the intensity of the bullish or bearish colors reflects the volume for that particular bar. This feature allows traders to visually identify periods of heightened activity and associate them with specific price movements.
Engulfing patterns, a popular technical analysis tool, are automatically detected and marked on the chart when the corresponding setting is enabled. The script identifies long engulfing patterns, where the current bar's range completely encompasses the previous bar’s range and indicates a potential bullish reversal. Similarly, short engulfing patterns are identified where the current bar fully engulfs the previous bar in the opposite direction, suggesting a bearish reversal. These patterns are visually highlighted with circular markers to draw the trader’s attention.
Each feature and mode is highly customizable. The colors for bullish, bearish, and neutral movements can be personalized, and the thresholds for patterns or smoothing can be fine-tuned to match specific trading strategies. The script's ability to toggle between various modes makes it adaptable to different market conditions and analysis preferences.
In summary, the Alternative Price script is a comprehensive tool that redefines the way traders view price charts. By offering multiple visualization modes, customizable features, and advanced detection algorithms, it provides a powerful way to uncover market trends, volume relationships, and significant patterns. The recommendation to hide default chart elements ensures that the focus remains on this innovative tool, enhancing its usability and clarity. This script empowers traders to gain deeper insights into market behavior and make informed trading decisions, all while maintaining a clean and visually appealing chart layout.
Keep in mind that some of the modes of this indicator might not reflect the actual closing price of the underlying asset, before opening a trade, check carefully the actual price!
TechniTrend: Advance Custom Candle Finder (CCF)🟦 Description:
The TechniTrend: Advanced Custom Candle Finder (CCF) is a versatile tool designed to help traders identify custom candlestick patterns using various configurable criteria. This indicator provides a flexible framework to filter and highlight specific candles based on volume, volatility, candle characteristics, and other important metrics. Below is a detailed explanation of each filter and its customization options:
🟦 Volume-Based Filters
🔸Volume Spike Filter:
Enable filtering based on volume spikes. Use the Volume Spike Multiplier to define what constitutes a significant increase in volume compared to the average. A spike indicates unusually high trading interest.
🔸Volume Range Filter:
Filter candles based on specific volume ranges. Set Minimum Volume and Maximum Volume thresholds to isolate candles with trading volumes within your desired boundaries.
🟦 Candle Body & Wick Filters
🔸Body Size Filter:
Filter candles based on the size of their body. A Body Size Multiplier determines what is considered a large body relative to historical averages.
🔸Body Percentage Filter:
Filter based on the proportion of the body to the entire candle size. Use the Body Percentage Threshold to highlight candles where the body makes up a certain percentage of the total candle range.
🔸Wick-to-Body Ratio Filter:
Identify candles with specific wick-to-body ratios. A higher Wick-to-Body Ratio can indicate indecision or reversals.
🟦 Volatility & Range Filters
🔸Volatility Filter:
Highlight candles based on price changes relative to volume. The Volatility Multiplier sets the threshold for what is considered a volatile candle.
🔸Candle Range Filter:
Filter based on the range (High - Low) of each candle. Use Minimum Candle Range and Maximum Candle Range to specify your desired candle size in points or pips.
🔸Short-Term and Long-Term Volatility Filters:
Analyze volatility over different periods. Enable Short-Term Volatility or Long-Term Volatility filters to compare recent volatility against historical averages, helping you detect sudden market shifts.
🟦 Candle Color & Open/Close Filters
🔸Candle Color Filter:
Filter based on the candle's color. Choose between Bullish (close > open) or Bearish (close < open) to focus on specific market sentiments.
🔸Open/Close Price Range Filter:
Filter based on the difference between the open and close prices. Use Minimum Open/Close Range and Maximum Open/Close Range to specify your acceptable range in price movements.
🟦 Core Functionality
The CCF indicator combines these filters to provide a final signal whenever a candle meets all the enabled criteria. By default, it highlights any qualifying candle directly on the chart and changes the background color for added visibility.
🟦 Key Features:
🔸Highly Customizable Filters: Adjust the parameters for each filter to tailor the indicator to your specific needs.
🔸Multiple Conditions: Combine several conditions to identify complex candlestick patterns.
🔸Real-Time Alerts: Receive instant notifications when a matching candle pattern is found based on your custom criteria.
🟦 How to Use:
🔸Enable the filters you wish to apply (e.g., Volume Spike, Candle Body Size, Volatility).
🔸Adjust the thresholds for each filter to fine-tune the pattern recognition criteria.
🔸Observe the chart to see visual cues for candles that match your specified conditions.
🟦 Notes:
🔸Ensure that you clearly understand each filter’s role. Over-filtering with very strict criteria may reduce the number of signals.
🔸This indicator is designed to be a customizable tool, not providing buy or sell recommendations.
🔸Use in combination with other analysis tools and indicators for the best results.
Optimus trader Optimus Trader
Indicator Description:
The Optimus Trader indicator is designed for technical traders looking for entry and exit points in financial markets. It combines signals based on volume, moving averages, VWAP (Volume Weighted Average Price), as well as the recognition of candlestick patterns such as Pin Bar and Inside Bars. This indicator helps identify opportune moments to buy or sell based on trends, volumes, and recent liquidity zones.
Parameters and Features:
1. Simple Moving Average (MA) and VWAP:
- Optimus Trader uses a 50-period simple moving average to determine the underlying trend. It also includes VWAP for precise price analysis based on traded volumes.
- These two indicators help identify whether the market is in an uptrend or downtrend, enhancing the reliability of buy and sell signals.
2. Volume :
- To avoid false signals, a volume threshold is set using a 20-period moving average, adjusted to 1.2 times the average volume. This filters signals by considering only high-volume periods, indicating heightened market interest.
3. Candlestick Pattern Recognition:
- Pin Bar: This sought-after candlestick pattern is detected for both bullish and bearish setups. A bullish or bearish *Pin Bar* often signals a possible reversal or continuation.
- *Inside Bar*: This price compression pattern is also detected, indicating a zone of indecision before a potential movement.
4. Trend:
- An uptrend is confirmed when the price is above the MA and VWAP, while a downtrend is identified when the price is below both indicators.
5. Liquidity Zones:
- Optimus Trader includes an approximate liquidity zone detection feature. By identifying recent support and resistance levels, the indicator detects if the price is near these zones. This feature strengthens the relevance of buy or sell signals.
6. Buy and Sell Signals:
- Buy: A buy signal is generated when the indicator detects a bullish *Pin Bar* or *Inside Bar* in an uptrend with high volume, and the price is close to a liquidity zone.
- Sell: A sell signal is generated when a bearish *Pin Bar* or *Inside Bar* is detected in a downtrend with high volume, and the price is near a liquidity zone.
Signal Display:
The signals are visible directly on the chart:
- A "BUY" label in green is displayed below the bar for buy signals.
- A "SELL" label in red is displayed above the bar for sell signals.
Summary:
This indicator is intended for traders seeking precise entry and exit points by integrating trend analysis, volume, and candlestick patterns. With liquidity zones, *Optimus Trader* helps minimize false signals, providing clear and accurate alerts.
---
This description can be directly added to TradingView to help users quickly understand the features and logic of this indicator.
Zig Zag with Adaptive ProjectionThe "Zig Zag with Adaptive Projection" is an advanced technical analysis tool designed for TradingView's Pine Script platform. This indicator builds upon the traditional ZigZag concept by incorporating adaptive projection capabilities, offering traders a more sophisticated approach to identifying significant price movements and forecasting potential future price levels.
At its core, the indicator utilizes a user-defined period to calculate and display the ZigZag pattern on the chart. This pattern connects significant highs and lows, effectively filtering out minor price fluctuations and highlighting the overall trend structure. Users can customize the appearance of the ZigZag lines, including their color, style (solid, dashed, or dotted), and width, allowing for easy visual integration with other chart elements.
What sets this indicator apart is its adaptive projection feature. By analyzing historical ZigZag patterns, the indicator calculates average lengths and slopes of both bullish and bearish trends. This data is then used to project potential future price movements, adapting to the current market context. The projection lines extend from the most recent ZigZag point, offering traders a visual representation of possible price targets based on historical behavior.
The adaptive nature of the projections is particularly noteworthy. The indicator considers the current trend direction, the length of the most recent ZigZag segment, and compares it to historical averages. This approach allows for more nuanced projections that account for recent market dynamics. If the current trend is stronger than average, the projection will extend further, and vice versa.
From a technical standpoint, the indicator leverages Pine Script v5's capabilities, utilizing arrays for efficient data management and implementing dynamic line drawing for both the ZigZag and projection lines. This ensures smooth performance even when analyzing large datasets.
Traders can fine-tune the indicator to their preferences with several customization options. The ZigZag period can be adjusted from 10 to 100, allowing for sensitivity adjustments to match different trading timeframes. The projection lines can be toggled on or off and their appearance customized, providing flexibility in how the forecast is displayed.
In essence, the "Zig Zag with Adaptive Projection" indicator combines traditional trend analysis with forward-looking projections. It offers traders a tool to not only identify significant price levels but also to anticipate potential future movements based on historical patterns. This blend of retrospective analysis and adaptive forecasting makes it a valuable addition to a trader's technical analysis toolkit, particularly for those interested in trend-following strategies or looking for potential reversal points.
Al Brooks - SuiteThis indicator is designed to identify some key terms and methodologies inspired by Al Brooks price action. It helps trades to easy recognize for example i/ii/iii patterns or shaved bars defined in his books.
i/ii/iii : Single to triple inside bars. Every bar an inside bar to the previous. This can indiciate a potential contination or reversal pattern. (marked with "i")
o/oo/ooo : Single to triple outside bars. Not defined by Al Brooks, but could be an interesting area to develop a strategy. (marked with "o")
Shaved bar : A bar with little or no tail/wick on one or both sides. It can indicate strong directional movement or momentum. (marked with "s"
The timeframe is not important for the validation of the patterns.
Confluence StrategyOverview of Confluence Strategy
The Confluence Strategy in trading refers to the combination of multiple technical indicators, support/resistance levels, and chart patterns to identify high-probability trading opportunities. The idea is that when several indicators agree on a price movement, the likelihood of that movement being successful increases.
Key Components
Technical Indicators:
Moving Averages (MA): Commonly used to determine the trend direction. Look for crossovers (e.g., the 50-day MA crossing above the 200-day MA).
Relative Strength Index (RSI): Helps identify overbought or oversold conditions. A reading above 70 may indicate overbought conditions, while below 30 suggests oversold.
MACD (Moving Average Convergence Divergence): Useful for spotting changes in momentum. Look for MACD crossovers and divergence from price.
Support and Resistance Levels:
Identify key levels where price has historically reversed. These can be drawn from previous highs/lows, Fibonacci retracement levels, or psychological price levels.
Chart Patterns:
Patterns like head and shoulders, double tops/bottoms, or flags can indicate potential reversals or continuations in price.
Strategy Implementation
Set Up Your Chart:
Add the desired indicators (e.g., MA, RSI, MACD) to your TradingView chart.
Mark significant support and resistance levels.
Identify Confluence Points:
Look for situations where multiple indicators align. For instance, if the price is near a support level, the RSI is below 30, and the MACD shows bullish divergence, this may signal a buying opportunity.
Entry and Exit Points:
Entry: Place a trade when your confluence conditions are met. Use limit orders for better prices.
Exit: Set profit targets based on resistance levels or use trailing stops. Consider the risk-reward ratio to ensure your trades are favorable.
Risk Management:
Always implement stop-loss orders to protect against unexpected market moves. Position size should reflect your risk tolerance.
Example of a Confluence Trade
Setup:
Price approaches a strong support level.
RSI shows oversold conditions (below 30).
The 50-day MA is about to cross above the 200-day MA (bullish crossover).
Action:
Enter a long position as the conditions align.
Set a stop loss just below the support level and a take profit at the next resistance level.
Conclusion
The Confluence Strategy can significantly enhance trading accuracy by ensuring that multiple indicators support a trade decision. Traders on TradingView can customize their indicators and charts to fit their personal trading styles, making it a flexible approach to technical analysis.


