3 Bar PlayThe "3 Bar Play" is a simple yet powerful pattern that traders look for as a signal of potential market movement. The pattern is defined by a sequence of three bars (or candlesticks) on the chart:
I saw Rake Trades post about this pattern. It not a new concept just wanted it to automatically be plotted on my chart rather then looking out for it.
Up 3 Bar Play: This pattern signals a potential upward movement.
The first bar (two bars ago from the current bar) must close higher than it opened, indicating a bullish bar.
The second bar (the previous bar) must close lower than it opened, indicating a bearish bar, but its low should be higher than the low of the first bar, showing that bears couldn't push the price much lower.
The third bar (the current bar) must open and close higher than the previous bar, closing above the high of the second bar, confirming the bullish sentiment.
Down 3 Bar Play: This pattern signals a potential downward movement.
The first bar (two bars ago from the current bar) must close lower than it opened, indicating a bearish bar.
The second bar (the previous bar) must close higher than it opened, indicating a bullish bar, but its high should be lower than the high of the first bar, showing that bulls couldn't push the price much higher.
The third bar (the current bar) must open and close lower than the previous bar, closing below the low of the second bar, confirming the bearish sentiment.
Plotting the Patterns
plotshape(): This function is used to plot shapes on the chart to visually highlight where the patterns occur.
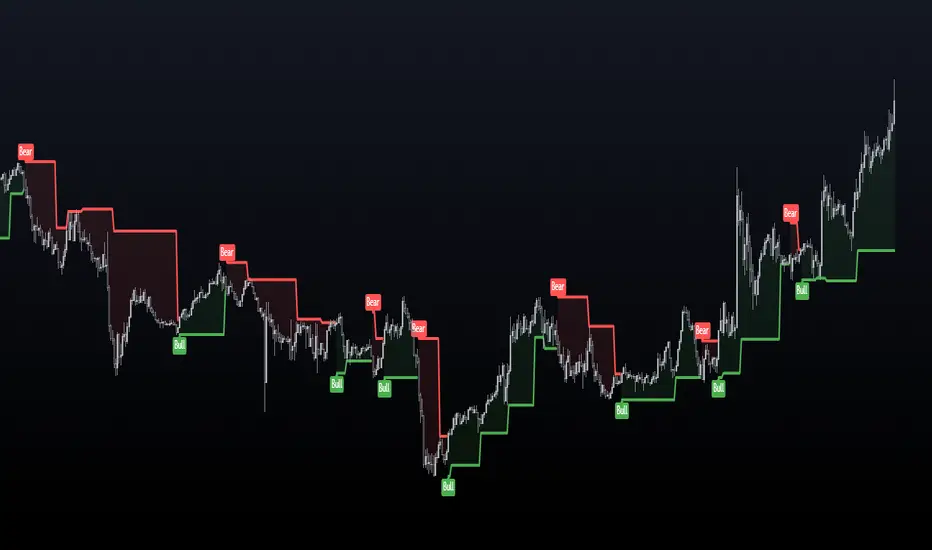
For an "Up 3 Bar Play", a green triangle pointing upwards is plotted below the bullish pattern to indicate a potential buy signal.
For a "Down 3 Bar Play", a red triangle pointing downwards is plotted above the bearish pattern to indicate a potential sell signal.
Key Points
This script helps traders quickly identify potential entry points based on the 3 Bar Play pattern without manually scanning the charts.
It's important to remember that no single pattern guarantees market movements, and it's often used in conjunction with other indicators and analysis methods.
This script is a practical tool for those looking to incorporate the 3 Bar Play pattern into their trading strategy, offering a clear visual cue on the chart whenever the pattern is identified.
Please understand the 3 bar play and where you should set your stop loss
Indicatore Pine Script®