RF+ Divergence Scalping SystemRF+ Divergence Scalping System + Custom Signals + Alerts.
This chart overlay indicator has been developed for the low timeframe divergence scalper.
Built upon the realtime divergence drawing code from the Divergence for Many indicator originally authored by Lonsometheblue, this chart overlay indicator bundles several additional unique features and modifications to serve as an all-in-one divergence scalping system. The current key features at the time of publishing are listed below (features are optional and can be enabled or disabled):
- Fully configurable realtime divergence drawing and alerting feature that can draw divergences directly on the chart using data sourced from up to 11 oscillators selected by the user, which have been included specifically for their ability to detect divergences, including oscillators not presently included in the original Divergence for Many indicator, such as the Ultimate Oscillator and TSI.
- Optional on chart table showing a summary of key statuses of various indicators, and nearby divergences.
- 2 x Range Filters with custom settings used for low timeframe trend detection.
- 3 x configurable multi-timeframe Stochastic RSI overbought and oversold signals with presentation options.
- On-chart pivot points drawn automatically.
- Automatically adjusted pivot period for up to 4 configurable time frames to fine tune divergences drawn for optimal divergence detection.
- Real-price line for use with Heikin Ashi candles, with styling options.
- Real-price close dots for use with Heikin Ashi candles, with styling options.
- A selection of custom signals that can be printed on-chart and alerted.
- Sessions indicator for the London, New York, Tokyo and Sydney trading sessions, including daylight savings toggle, and unique ‘invert background color’ option, which colours the entire chart - except the trading session you have selected, leaving your chart clear of distracting background color.
- Up to 4 fully configurable moving averages.
- Additional configurable settings for numerous built in indicators, allowing you to alter the lengths and source types, including the UO, TSI, MFI, TSV, 2 x Range Filters.
- Configurable RSI Trend detection signal filter used in a number of the signals, which filters buy signals where the RSI is over the RSI moving average, and only prints sell signals where RSI is under the moving average.
- Customisable on-chart watermark, with inputs for a custom title, subtitle, and also an optional symbol | timeframe | date feature.
The Oscillators able to be selected for use in drawing divergences at the time of publishing are as follows:
- Ultimate Oscillator (UO)
- True Strength Indicator (TSI)
- Money Flow Index (MFI)
- Cumulative Delta Volume (CDV)
- Time Segmented Volume (TSV)
- Commodity Channel Index (CCI)
- Awesome Oscillator
- Relative Strength Index (RSI)
- Stochastic
- On Balance Volume (OBV)
- MACD Histogram
What are divergences?
Divergence is when the price of an asset is moving in the opposite direction of a technical indicator, such as an oscillator, or is moving contrary to other data. Divergence warns that the current price trend may be weakening, and in some cases may lead to the price changing direction.
There are 4 main types of divergence, which are split into 2 categories;
regular divergences and hidden divergences. Regular divergences indicate possible trend reversals, and hidden divergences indicate possible trend continuation.
Regular bullish divergence: An indication of a potential trend reversal, from the current downtrend, to an uptrend.
Regular bearish divergence: An indication of a potential trend reversal, from the current uptrend, to a downtrend.
Hidden bullish divergence: An indication of a potential uptrend continuation.
Hidden bearish divergence: An indication of a potential downtrend continuation.
Setting alerts.
With this indicator you can set alerts to notify you when any/all of the above types of divergences occur, on any chart timeframe you choose, also when the triple timeframe Stochastic RSI overbought and oversold confluences occur, as well as when custom signals are printed.
Configurable pivot period values.
You can adjust the default pivot period values to suit your prefered trading style and timeframe. If you like to trade a shorter time frame, lowering the default lookback values will make the divergences drawn more sensitive to short term price action. By default, this indicator has enabled the automatic adjustment of the pivot periods for 4 configurable time frames, in a bid to optimize the divergences drawn when the indicator is loaded onto any of the 4 time frames selected. These time frames and their associated pivot periods can be fully reconfigured within the settings menu. By default, these have been further optimized for the low timeframe scalper trading on the 1-15 minute time frames.
How do traders use divergences in their trading?
A divergence is considered a leading indicator in technical analysis , meaning it has the ability to indicate a potential price move in the short term future.
Hidden bullish and hidden bearish divergences, which indicate a potential continuation of the current trend are sometimes considered a good place for traders to begin, since trend continuation occurs more frequently than reversals, or trend changes.
When trading regular bullish divergences and regular bearish divergences, which are indications of a trend reversal, the probability of it doing so may increase when these occur at a strong support or resistance level . A common mistake new traders make is to get into a regular divergence trade too early, assuming it will immediately reverse, but these can continue to form for some time before the trend eventually changes, by using forms of support or resistance as an added confluence, such as when price reaches a moving average, the success rate when trading these patterns may increase.
Typically, traders will manually draw lines across the swing highs and swing lows of both the price chart and the oscillator to see whether they appear to present a divergence, this indicator will draw them for you, quickly and clearly, and can notify you when they occur.
How do traders use overbought and oversold levels in their trading?
The oversold level is when the Stochastic RSI is above the 80 level is typically interpreted as being 'overbought', and below the 20 level is typically considered 'oversold'. Traders will often use the Stochastic RSI at, or crossing down from an overbought level as a confluence for entry into a short position, and the Stochastic RSI at, or crossing up from an oversold level as a confluence for an entry into a long position. These levels do not mean that price will necessarily reverse at those levels in a reliable way, however. This is why this version of the Stoch RSI employs the triple timeframe overbought and oversold confluence, in an attempt to add a more confluence and reliability to this usage of the Stoch RSI.
This indicator is intended for use in conjunction with related panel indicators including the TSI+ (True Strength Indicator + Realtime Divergences), UO+ (Ultimate Oscillator + Realtime Divergences), and optionally the STRSI+ (MTF Stochastic RSI + Realtime Divergences) and MFI+ (Money Flow Index + Realtime Divergences) available via this authors’ Tradingview profile, under the scripts section. The realtime divergence drawing code will not identify all divergences, so it is suggested that you also have panel indicators to observe. Each panel indicator also offers additional means of entry confirmation into divergence trades, for example, the Stochastic can indicate when it is crossing down from overbought or up from oversold, the TSi can indicate when the 2 TSI bands cross over one another upward or downward, and the UO and MFI can indicate an entry confluence when they are nearing, or crossing their centerlines, for more confidence in your divergence trade entries.
Additional information on the settings for this indicator can be found via the tooltips within the settings menu itself. Further information on feature updates, and usage tips & tricks will be added to the comments section below in due course.
Disclaimer: This indicator uses code adapted from the Divergence for Many v4 indicator authored by Lonesometheblue, and several stock indicators authored by Tradingview. With many thanks.
Cerca negli script per "pivot points"

Adoptive Supertrend - PivotsAnother experiment with Supertrend by making use of pivot point high/lows.
Trailing Stop types used in this indicator are:
ATR - plain ATR based supertrend
Breakout - ATR based supertrend combined with breakout. (Trailing triggered only if price change is higher than HighPriceChange multiplier times ATR.
Pivot Points - Trail only when new pivots created. Pivot stop multiplier is used below pivot low.
Combined - Combine everything together

[JRL] Murrey Math LinesMurrey Math Lines are support and resistance lines based on geometric mathematical formulas developed by T.
H. Murrey. MM lines are a derivation of the observations of W.D. Gann. Murrey's geometry facilitate the use of Gann's theories in a somewhat easier application. According to Gann's theory, price tends to trend and retrace in 1/8th intervals. The most important MM line levels are the 0/8, 4/8 and 8/8 levels, which typically provide strong support and resistance points. The 3/8 and 5/8 levels represent the low and high of the typical trading range. When price is above the typical trading range, it is considered overbought, and when it is below it is considered oversold. The 2/8 and 6/8 levels provide strong pivot points.
Some of the other Murrey Math indicators on TradingView use different formulas and therefore produce varying results. I've checked my indicator against MM indicators on other platforms and it is consistent with those indicators.
This indicator also allows users to switch to alternative timeframes for analysis and it includes labels for the MM lines. If you have any suggestions or comments, please leave them below.
Cheers!

Weis Pip Wave jayyWhat you see here is the Weis pip wave. The Weis pip wave shows how far in price a Weis wave has traveled through the duration of a Weis wave. The Weis pip wave is used in combination with the Weis cumulative volume wave. The two waves must be set to the same "wave size" and using the same method as described by Weis.
Using the traditional Weis method simply enter the desired wave size in the box "Select Weis Wave Size". In the example shown, it is set to 5 points. Each wave for each security and each timeframe requires its own wave size. Although not the traditional method a more automatic way to set wave size would be to use ATR. This is not the true Weis method but it does give you similar waves and, importantly, without the hassle of selecting a wave size for every chart. Once the Weis wave size is set then the pip wave will be shown.
I have put a zigzag of a 5 point Weis wave on the above bar chart. I have added it to allow your eye to get a better appreciation for Weis wave pivot points. You will notice that the wave is not in straight lines connecting wave tops to bottoms this is a function of the limitations of Pinescript version 1. This script would need to be in version 4 to allow straight lines. I will elaborate on the Weis pip zigzag script.
What is a Weis wave? David Weis has been recognized as a Wyckoff method analyst he has written two books one of which, Trades About to Happen, describes the evolution of the now popular Weis wave. The method employed by Weis is to identify waves of price action and to compare the strength of the waves on characteristics of wave strength. Chief among the characteristics of strength is the cumulative volume of the wave. There are other markers that Weis uses as well for example how the actual price difference between the start of the Weis wave from start to finish. Weis also uses time, particularly when using a Renko chart. Weis specifically uses candle/bar closes to define all wave action.
David Weis did a futures.io video which is a popular source of information about his method.
Cheers jayy
PS This script was published a day ago, however, I had included some links to the website of a person that uses Weis pip waves and also a dropbox link that contains the Weis wave chart for May 27, 2020, published by David Weis. Providing those links is against TV policy and so the script was hidden by TV. This is the identical script with the identical settings but without the offending links. If you want to see the pip Weis method in practice then search Weis pip wave. I have absolutely no affiliation. If you want to see Weis chart in pdf then message me and I will give a link or the Weis pdf. Why would you want to see the Weis chart for May 27, 2020? Merely to confirm the veracity of my algorithm. You could compare my chart () from the same period to the Weis chart. Both waves are for the ES!1 4 hour chart and both for a wave size of 5.

AperonFx Pivot Points ATRThis indicator builds on classic pivot point methodology and enhances it with volatility-based ATR offsets to define adaptive support and resistance zones.
The pivot level is derived from the prior period’s price data, while the surrounding levels are calculated using the current day’s ATR to reflect prevailing market conditions.
Support and resistance are placed at incremental distances of 0.5, 1, 1.5 and 2 ATR away from the pivot, creating a structured price framework.
Users can adjust the pivot calculation method, reference timeframe, and visual presentation to suit their workflow.

🚀 Ultimate Trading Tool + Strat Method🚀 Ultimate Trading Tool + Strat Method - Complete Breakdown
Let me give you a comprehensive overview of this powerful indicator!
🎯 What This Indicator Does:
This is a professional-grade, all-in-one trading system that combines two proven methodologies:
1️⃣ Technical Analysis System (Original)
Advanced trend detection using multiple EMAs
Momentum analysis with MACD
RSI multi-timeframe analysis
Volume surge detection
Automated trendline drawing
2️⃣ Strat Method (Pattern Recognition)
Inside bars, outside bars, directional bars
Classic patterns: 2-2, 1-2-2
Advanced patterns: 3-1-2, 2-1-2, F2→3
Timeframe continuity filters
📊 How It Generates Signals:
Technical Analysis Signals (Green/Red Triangles):
Buy Signal Triggers When:
✅ Price above EMA 21 & 50 (uptrend)
✅ MACD histogram rising (momentum)
✅ RSI between 30-70 (not overbought/oversold)
✅ Volume surge above 20-period average
✅ Price breaks above resistance trendline
Scoring System:
Trend alignment: +1 point
Momentum: +1 point
RSI favorable: +1 point
Trendline breakout: +2 points
Minimum score required based on sensitivity setting
Strat Method Signals (Blue/Orange Labels):
Pattern Recognition:
2-2 Setup: Down bar → Up bar (or reverse)
1-2-2 Setup: Inside bar → Down bar → Up bar
3-1-2 Setup: Outside bar → Inside bar → Up bar
2-1-2 Setup: Down bar → Inside bar → Up bar
F2→3 Setup: Failed directional bar becomes outside bar
Confirmation Required:
Must break previous bar's high (buy) or low (sell)
Optional timeframe continuity (daily & weekly aligned)
💰 Risk Management Features:
Dynamic Stop Loss & Take Profit:
ATR-Based: Adapts to market volatility
Stop Loss: Entry - (ATR × 1.5) by default
Take Profit: Entry + (ATR × 3.0) by default
Risk:Reward: Customizable 1:2 to 1:5 ratios
Visual Risk Zones:
Colored boxes show risk/reward area
Dark, bold lines for easy identification
Clear entry, stop, and target levels
🎨 What You See On Screen:
Main Signals:
🟢 Green Triangle "BUY" - Technical analysis long signal
🔴 Red Triangle "SELL" - Technical analysis short signal
🎯 Blue Label "STRAT" - Strat method long signal
🎯 Orange Label "STRAT" - Strat method short signal
Trendlines:
Green lines - Support trendlines (bullish)
Red lines - Resistance trendlines (bearish)
Automatically drawn from pivot points
Extended forward to predict future levels
Stop/Target Levels:
Bold crosses at stop loss levels (red color)
Bold crosses at take profit levels (green color)
Line width = 3 for maximum visibility
Trade Zones:
Light green boxes - Long trade risk/reward zone
Light red boxes - Short trade risk/reward zone
Shows potential profit vs risk visually
📊 Information Dashboard (Top Right):
Shows real-time market conditions:
Main Signal: Current technical signal status
Strat Method: Active Strat pattern
Trend: Bullish/Bearish/Neutral
Momentum: Strong/Weak based on MACD
Volume: High/Normal compared to average
TF Continuity: Daily/Weekly alignment
RSI: Current RSI value with color coding
Support/Resistance: Current trendline levels
🔔 Alert System:
Entry Alerts:
Technical Signals:
🚀 BUY SIGNAL TRIGGERED!
Type: Technical Analysis
Entry: 45.23
Stop: 43.87
Target: 48.95
```
**Strat Signals:**
```
🎯 STRAT BUY TRIGGER!
Pattern: 3-1-2
Entry: 45.23
Trigger Level: 44.56
Exit Alerts:
Target hit notifications
Stop loss hit warnings
Helps maintain discipline
⚙️ Customization Options:
Signal Settings:
Sensitivity: High/Medium/Low (controls how many signals)
Volume Filter: Require volume surge or not
Momentum Filter: Require momentum confirmation
Strat Settings:
TF Continuity: Require daily/weekly alignment
Pattern Selection: Enable/disable specific patterns
Confirmation Mode: Show only confirmed triggers
Risk Settings:
ATR Multiplier: Adjust stop/target distance
Risk:Reward: Set preferred ratio
Visual Elements: Show/hide any component
Visual Settings:
Colors: Customize all signal colors
Display Options: Toggle signals, levels, zones
Trendline Length: Adjust pivot detection period
🎯 Best Use Cases:
Day Trading:
Use low sensitivity setting
Enable all Strat patterns
Watch for high volume signals
Quick in/out trades
Swing Trading:
Use medium sensitivity
Require timeframe continuity
Focus on trendline breakouts
Hold for target levels
Position Trading:
Use high sensitivity (fewer signals)
Require strong momentum
Focus on weekly/daily alignment
Larger ATR multipliers
💡 Trading Strategy Tips:
High-Probability Setups:
Double Confirmation: Technical + Strat signal together
Trend Alignment: All timeframes agree
Volume Surge: Institutional participation
Trendline Break: Clear level breakout
Risk Management:
Always use stops - System provides them
Position sizing - Risk 1-2% per trade
Don't chase - Wait for signal confirmation
Take profits - System provides targets
What Makes Signals Strong:
✅ Both technical AND Strat signals fire together
✅ Timeframe continuity (daily & weekly aligned)
✅ Volume surge confirms institutional interest
✅ Multiple indicators align (trend + momentum + RSI)
✅ Clean trendline breakout with no resistance above (or support below)
⚠️ Common Mistakes to Avoid:
Don't ignore stops - System calculates them for a reason
Don't overtrade - Wait for quality setups
Don't disable volume filter - Unless you know what you're doing
Don't use max sensitivity - You'll get too many signals
Don't ignore timeframe continuity - It filters bad trades
🚀 Why This Indicator is Powerful:
Combines Multiple Edge Sources:
Technical analysis (trend, momentum, volume)
Pattern recognition (Strat method)
Risk management (dynamic stops/targets)
Market structure (trendlines, support/resistance)
Professional Features:
No repainting - signals are final when bar closes
Clear risk/reward before entry
Multiple confirmation layers
Adaptable to any market or timeframe
Beginner Friendly:
Clear visual signals
Automatic calculations
Built-in risk management
Comprehensive dashboard
This indicator essentially gives you everything a professional trader uses - trend analysis, momentum, patterns, volume, risk management - all in one clean package!
Any specific aspect you'd like me to explain in more detail? 🎯RetryClaude can make mistakes. Please double-check responses. Sonnet 4.5

ULTIMATE Smart Trading Pro 🔥
## 🇬🇧 ENGLISH
### 📊 The Most Complete All-in-One Trading Indicator
**ULTIMATE Smart Trading Pro** combines the best technical analysis tools and Smart Money Concepts into a single powerful and intelligent indicator. Designed for serious traders who want a real edge in the markets.
---
### ✨ KEY FEATURES
#### 💰 **SMART MONEY CONCEPTS**
- **Order Blocks**: Automatically detects institutional zones where "smart money" enters positions
- **Break of Structure (BOS)**: Identifies structure breaks to confirm trend changes
- **Liquidity Zones**: Spots equal highs/lows areas where institutions hunt stops
- **Market Structure**: Visually displays bullish (green background) or bearish (red background) structure
#### 📈 **ADVANCED TECHNICAL INDICATORS**
- **RSI with Auto Divergences**: Classic RSI + automatic detection of bullish and bearish divergences
- **MACD with Signals**: Identifies bullish and bearish crossovers in real-time
- **Dynamic Support & Resistance**: Adaptive zones with intelligent scoring based on volume, multiple touches, and ATR
- **Fair Value Gaps (FVG)**: Detects unfilled price gaps (imbalance zones)
#### 📐 **AUTOMATIC TOOLS**
- **Auto Fibonacci**: Automatically calculates Fibonacci retracement levels on the last major trend
- **Pivot Points**: Daily, Weekly, or Monthly pivot points (PP, R1, R2, S1, S2)
- **Pattern Finder**: Automatically detects candlestick patterns (Hammer, Shooting Star, Engulfing, Morning/Evening Star) and chart patterns (Double Top/Bottom)
---
### 🎯 HOW TO USE IT
#### Quick Setup:
1. **Add the indicator** to your chart
2. **Open Settings** and enable/disable modules as needed
3. **Adjust parameters** for your trading style (scalping, swing, day trading)
#### Optimal Trading Setup:
🔥 **ULTRA STRONG Signal** when you have:
- An institutional **Order Block**
- Aligned with a **Support/Resistance** tested 3+ times
- An unfilled **FVG** nearby
- An **RSI divergence** confirming the reversal
- On a key **Fibonacci** level (50%, 61.8%, or 78.6%)
- Favorable market structure (green background for buys, red for sells)
---
### 💡 UNIQUE ADVANTAGES
✅ **Adaptive Intelligence**: Automatically adjusts to market volatility (ATR)
✅ **Volume Filters**: Validates important levels with volume confirmation
✅ **Multi-Timeframe Ready**: Works on all timeframes (1m to 1M)
✅ **Complete Alerts**: Notifications for all important signals
✅ **Clear Interface**: Emojis and colored labels for quick identification
✅ **Intelligent Scoring**: Levels ranked by importance (🔴🔴🔴 = very strong)
✅ **100% Customizable**: Enable only what you need
---
### 🎨 SYMBOL LEGEND
**Smart Money:**
- 🟢 OB = Bullish Order Block
- 🔴 OB = Bearish Order Block
- BOS ↑/↓ = Break of Structure
- 💧 LIQ = Liquidity Zone
**Candlestick Patterns:**
- 🔨 = Hammer (bullish signal)
- ⭐ = Shooting Star (bearish signal)
- 📈 = Bullish Engulfing
- 📉 = Bearish Engulfing
- 🌅 = Morning Star (bullish reversal)
- 🌆 = Evening Star (bearish reversal)
**Indicators:**
- 🚀 MACD ↑ = Bullish crossover
- 📉 MACD ↓ = Bearish crossover
- ⚠️ DIV = Bearish RSI divergence
- ✅ DIV = Bullish RSI divergence
**Support & Resistance:**
- 🟢/🔴 S1, R1 = Support/Resistance
- 🟢🟢🟢/🔴🔴🔴 = VERY strong level (3+ touches)
- (×N) = Number of times touched
---
### ⚙️ RECOMMENDED SETTINGS
**For Scalping (1m - 5m):**
- SR Lookback: 15
- Structure Strength: 3
- RSI: 14
- Volume Filter: ON
**For Day Trading (15m - 1H):**
- SR Lookback: 20
- Structure Strength: 5
- RSI: 14
- All filters: ON
**For Swing Trading (4H - Daily):**
- SR Lookback: 30
- Structure Strength: 7
- Pattern Lookback: 100
- Fibonacci: ON
---
### 🚨 DISCLAIMER
This indicator is a decision support tool. It does not guarantee profits and does not constitute financial advice. Always test on a demo account before real use. Trading involves significant risks.
---
## 📞 SUPPORT & UPDATES
For questions, suggestions, or bug reports, please comment below or contact the author.
**Version:** 1.0
**Last Updated:** October 2025
**Compatible:** TradingView Pine Script v6
---
### 🌟 If you find this indicator useful, please give it a 👍 and share it with other traders!
**Happy Trading! 🚀📈**

Support & ResistanceWhat is this script ?
Pivot points are tools used to identify potential support and resistance levels in trading. They are calculated using the previous period’s high, low, and close prices. This script leverages pivot points to plot up to four support levels and four resistance levels, helping traders visualize key price zones.
How to Use the Script?
Support and resistance levels represent price zones where significant liquidity often exists due to past price interactions. These levels are critical for traders to:
Assess Trend Continuation or Reversal: Prices may pause, reverse, or break through at these levels, signaling potential trend changes or continuations.
Manage Risk: Support and resistance levels are ideal for placing stop-loss orders or setting profit targets, as they indicate areas where price reactions are likely.
Plan Entries and Exits: Traders can buy near support levels, sell near resistance levels, or trade breakouts when prices move decisively beyond these zones.
AutoFib Breakout Strategy for Uptrend AssetsThis trading strategy is designed to help you catch powerful upward moves on assets that are in a long-term uptrend, such as Gold (XAUUSD). It uses a popular technical tool called the Fibonacci Extension, combined with a trend filter and a risk-managed exit system.
✅ When to Use This Strategy
• Works best on higher timeframes: Daily (1D), 3-Day (3D), or Weekly (W).
• Best used on uptrending assets like Gold.
• Designed for swing trading – holding trades from a few days to weeks.
📊 How It Works
1. Find the Trend
We only want to trade in the direction of the trend.
• The strategy uses the 200-period EMA (Exponential Moving Average) to identify if the market is in an uptrend.
• If the price is above the 200 EMA, we consider it an uptrend and allow long trades.
2. Identify Breakout Levels
• The strategy detects recent high and low pivot points to draw Fibonacci extension levels.
• It focuses on the 1.618 Fibonacci level, which is often a target in strong trends.
• When the price breaks above this level in an uptrend, it signals a potential momentum breakout – a good time to buy.
3. Enter a Trade
• The strategy enters a long (buy) position when the price closes above the 1.618 Fibonacci level and the market is in an uptrend (above the 200 EMA).
4. Manage Risk Automatically
• The trade includes a stop-loss set to 1x the ATR (Average True Range) below the entry price – this protects against sudden drops.
• It sets a take-profit at 3x the ATR above the entry – aiming for higher rewards than risks.
⚠️ Important Notes
• 📈 Higher Timeframes Preferred: This strategy works best on Daily (D), 3-Day (3D), and Weekly (W) charts, especially on Gold (XAUUSD).
• 🧪 Not for Deep Backtesting: Due to the nature of how pivot points and Fib levels are calculated, this strategy may not perform well in backtesting simulations (because the historical calculations can shift). It is better used for live analysis and forward testing.

Parsifal.Swing.TrendScoreThe Parsifal.Swing.TrendScore indicator is a module within the Parsifal Swing Suite, which includes a set of swing indicators such as:
• Parsifal Swing TrendScore
• Parsifal Swing Composite
• Parsifal Swing RSI
• Parsifal Swing Flow
Each module serves as an indicator facilitating judgment of the current swing state in the underlying market.
________________________________________
Background
Market movements typically follow a time-varying trend channel within which prices oscillate. These oscillations—or swings—within the trend are inherently tradable.
They can be approached:
• One-sidedly, aligning with the trend (generally safer), or
• Two-sidedly, aiming to profit from mean reversions as well.
Note: Mean reversions in strong trends often manifest as sideways consolidations, making one-sided trades more stable.
________________________________________
The Parsifal Swing Suite
The modules aim to provide additional insights into the swing state within a trend and offer various trigger points to assist with entry decisions.
All modules in the suite act as weak oscillators, meaning they fluctuate within a range but are not bounded like true oscillators (e.g., RSI, which is constrained between 0% and 100%).
________________________________________
The Parsifal.Swing.TrendScore – Specifics
The Parsifal.Swing.TrendScore module combines short-term trend data with information about the current swing state, derived from raw price data and classical technical indicators. It provides an indication of how well the short-term trend aligns with the prevailing swing, based on recent market behavior.
________________________________________
How Swing.TrendScore Works
The Swing.TrendScore calculates a swing score by collecting data within a bin (i.e., a single candle or time bucket) that signals an upside or downside swing. These signals are then aggregated together with insights from classical swing indicators.
Additionally, it calculates a short-term trend score using core technical signals, including:
• The Z-score of the price's distance from various EMAs
• The slope of EMAs
• Other trend-strength signals from additional technical indicators
These two components—the swing score and the trend score—are then combined to form the Swing.TrendScore indicator, which evaluates the short-term trend in context with swing behavior.
________________________________________
How to Interpret Swing.TrendScore
The trend component enhances Swing.TrendScore’s ability to provide stronger signals when the short-term trend and swing state align.
It can also override the swing score; for example, even if a mean reversion appears to be forming, a dominant short-term trend may still control the market behavior.
This makes Swing.TrendScore particularly valuable for:
• Short-term trend-following strategies
• Medium-term swing trading
Unlike typical swing indicators, Swing.TrendScore is designed to respond more to medium-term swings rather than short-lived fluctuations.
________________________________________
Behavior and Chart Representation
The Swing.TrendScore indicator fluctuates within a range, as most of its components are range-bound (though Z-score components may technically extend beyond).
• Historically high or low values may suggest overbought or oversold conditions
• The chart displays:
o A fast curve (orange)
o A slow curve (white)
o A shaded background representing the market state
• Extreme values followed by curve reversals may signal a developing mean reversion
________________________________________
TrendScore Background Value
The Background Value reflects the combined state of the short-term trend and swing:
• > 0 (shaded green) → Bullish mode: swing and short-term trend both upward
• < 0 (shaded red) → Bearish mode: swing and short-term trend both downward
• The absolute value represents the confidence level in the market mode
Notably, the Background Value can remain positive during short downswings if the short-term trend remains bullish—and vice versa.
________________________________________
How to Use the Parsifal.Swing.TrendScore
Several change points can act as entry triggers or aids:
• Fast Trigger: change in slope of the fast signal curve
• Trigger: fast line crosses slow line or the slope of the slow signal changes
• Slow Trigger: change in sign of the Background Value
Examples of these trigger points are illustrated in the accompanying chart.
Additionally, market highs and lows aligning with the swing indicator values may serve as pivot points in the evolving price process.
________________________________________
As always, this indicator should be used in conjunction with other tools and market context in live trading.
While it provides valuable insight and potential entry points, it does not predict future price action.
Instead, it reflects recent tendencies and should be used judiciously.
________________________________________
Extensions
The aggregation of information—whether derived from bins or technical indicators—is currently performed via simple averaging. However, this can be modified using alternative weighting schemes, based on:
• Historical performance
• Relevance of the data
• Specific market conditions
Smoothing periods used in calculations are also modifiable. In general, the EMAs applied for smoothing can be extended to reflect expectations based on relevance-weighted probability measures.
Since EMAs inherently give more weight to recent data, this allows for adaptive smoothing.
Additionally, EMAs may be further extended to incorporate negative weights, akin to wavelet transform techniques.

Pivot Breakouts with MA FilterPivot Breakouts with MA Filter
This script identifies pivot breakouts (both bullish and bearish) using support and resistance levels and overlays breakout labels, arrows, and customizable Moving Averages. It allows traders to fine-tune their analysis with multiple options to customize the display and behavior of the breakout signals.
Key Features:
Pivot Support and Resistance:
Support is defined by the lowest low in a given range (using the lookback period).
Resistance is defined by the highest high in a given range (using the lookback period).
The script draws support and resistance boxes on the chart when these levels change, providing clear visual markers for potential breakout areas.
Breakout Detection:
Bullish Breakout: A breakout above resistance and the price is above the selected moving average (MA).
Bearish Breakout: A breakdown below support and the price is below the selected MA.
Breakout events trigger labels indicating "Resistance Breakout" (for bullish) and "Support Breakout" (for bearish).
The option to show Breakout Labels (with customizable colors) is available in the settings.
Moving Average Filter:
You can select the type of moving average (SMA or EMA) to use for filtering breakout signals.
MA Filter Length: This input allows you to set the period of the moving average to act as a filter for breakout conditions. This helps ensure the breakout aligns with the broader trend.
Multiple Moving Averages (Optional):
You can add up to four different moving averages (SMA or EMA), each with its own length and color.
You have the option to toggle each moving average on or off and adjust their appearance settings (color and length).
The script supports dynamic plots for each moving average, helping to visualize multiple trends at once.
Breakout Arrows:
The script can display arrows (or other shapes) below the bar for bullish breakouts and above the bar for bearish breakouts.
Arrows are optional and can be turned on/off in the settings.
You can customize the shape of the arrows (e.g., arrow, circle, square, or even a large or small triangle).
Customizable Colors and Labels:
The color of the breakout labels and arrows can be customized in the settings to make them fit your chart's style and personal preferences.
Alerts:
Alerts can be set for new support and resistance levels, as well as when breakouts occur (either bullish or bearish).
The alert system helps to notify traders when significant price action takes place without needing to constantly monitor the chart.
Settings:
Select Moving Average Type (SMA or EMA)
MA Filter Length: Length of the moving average used for filtering breakout conditions.
Lookback Range: Determines the range over which the pivot points (support and resistance) are calculated.
Breakout Labels: Option to turn on/off breakout labels, and customize label colors.
Show Breakout Arrows: Enable or disable breakout arrows with shape options (arrow, circle, square, large triangle, small triangle).
Multiple Moving Averages: Option to show up to 4 MAs with customizable colors and lengths.

Next level scolilay swing timerThe "Next Level Scolilay Swing Timer" is an advanced TradingView indicator designed to help traders navigate trends, reversals, and swing opportunities with ease. It's built around several key concepts like ATR filtering, ZigZag analysis, and momentum-based trend detection, making it a powerful tool for identifying market direction and key trading opportunities.
One of the standout features is its ability to filter candles using the Average True Range (ATR). This ensures that the indicator focuses on meaningful price movements rather than noise. You can tweak the ATR settings to suit your trading style, deciding how much historical data to consider or even turning the filter off completely if you prefer.
The script also integrates a ZigZag algorithm to detect pivot points, which it uses to evaluate swings in price action. This feature comes with customizable settings for depth and sensitivity, allowing you to adjust how the script reacts to price fluctuations. By analyzing these swings, the indicator identifies key highs and lows, which play a big role in determining whether the market is trending up or down.
When it comes to trends, the script is smart and flexible. It doesn't just look for higher highs or lower lows; it also considers momentum and retracement levels to decide if a trend is gaining strength or reversing. For example, it uses one-third retracement logic to spot sudden shifts in market direction, which can be critical for catching reversals early. You can also enable features like fast trend switching, which reacts to single-candle events that might signal a trend break.
Visualization is another area where this script shines. It marks uptrends and downtrends directly on the chart with clear labels, so you can instantly see when a new trend starts. Pink arrows appear above candles to signal potential downtrends, while yellow arrows below candles indicate possible uptrends. These signals combine multiple layers of analysis, like swing validation, ATR filtering, and trend confirmation, to give you reliable insights.
What makes the Swing Timer especially useful is its flexibility. Whether you’re a trend trader looking to ride major market moves, a swing trader focused on pivot points, or someone hunting for reversals, you can customize the settings to fit your needs. You can adjust everything from ZigZag and ATR parameters to how trends are labeled and filtered. The result is a tool that adapts to your trading style while still providing clear and actionable signals.
In short, this script brings together a range of advanced trading concepts into one user-friendly package. It’s perfect for traders who want to see market trends clearly, identify opportunities with confidence, and stay ahead of sudden reversals—all without getting bogged down in unnecessary complexity.

Potential Upcoming Trend ToolThis Script has the specific use of identifying when and how a new trend may start to take form, rather than focusing on how a trend has already formed on a longer term basis.
This Script is useful on it's own and not in conjunction with another. It works by taking on the most recent price data rather than a long term historical string.
It differs from standard trend following indicators because it's use is far less historical, and more present. It requires less pivot points than normal to be validated as a strong trend.
It works by taking local pivot points and fractals to form its parallel basis. The Trend lines will continually move as more recent price action data appears and the the channel will get thinner, until it is clear a trend has arrived and consolidated.
The idea really is to see a constantly evolving picture of a sudden change in movement, allowing you to have an earlier eye on what is potentially to come.
The faint mid-point line gives a reasonable reading of where you would find yourself halfway within a new trend and will also move inline with the shown trendlines.
This allows you to easily track when sentiment and therefore trends are about to change. It's much more useful on lower timeframes because they will often give the first indication something is changing.
Colours are fully customisable.

AB_Bnf_Selling_5minThe Mathematical Level Reversal Strategy is designed to identify potential reversal points in the market using mathematical levels combined with price action on a 5-minute chart. This strategy is particularly effective for intraday traders who seek to capitalize on precise entry and exit points based on calculated levels rather than traditional indicators like moving averages or Bollinger Bands.
Creators' Mathematical Levels Explanation
Mathematical levels are predetermined price points calculated based on various factors such as previous high/low points, Fibonacci retracements, or other arithmetic calculations. These levels are used to anticipate areas where the price might reverse or experience significant support or resistance.
higher threshold: A predefined level where the price is expected to experience resistance, leading to a potential reversal downward.
Lower Threshold: A predefined level where the price might find support, leading to a potential upward reversal.
In this strategy, we focus on price movements around the upper mathematical level, where prices are likely to reverse downwards.
Strategy Logic
Setup:
The strategy is applied on a 5-minute chart.
Mathematical levels are calculated based on your preferred method, such as Fibonacci levels, pivot points, or custom calculations. For this strategy, let's assume we are using a specific predefined upper level.
Sell Signal Criteria:
A 5-minute candle must cross above the predefined upper mathematical level or close entirely above it (open and close both above the level).
The following candle must break below the low of the candle that crossed the upper level and close below that low. This confirms a bearish reversal.
Once these conditions are met, a sell signal is triggered.
Stop Loss:
The stop loss is placed at the high of the candle that crossed above the upper mathematical level.
This level represents the point where the trade setup would be invalidated.
Take Profit:
Target 1: The first take profit is set at a level that offers a 1:5 risk-to-reward ratio.
Target 2: An alternative take profit level is set at a 1:3 risk-to-reward ratio, providing flexibility based on market conditions.
Trade Management:
Once a trade is initiated, no new trades will be taken until the current trade hits either the stop loss or the first take profit level. This prevents overlapping signals and helps in managing risk effectively.
Originality and Usefulness
This strategy offers a unique approach by using mathematical levels instead of traditional indicators. It provides traders with a clear framework for identifying and executing high-probability reversal trades, particularly in intraday markets.
Originality:
The strategy's originality lies in its reliance on mathematical levels combined with a multi-candle confirmation pattern. This approach reduces the chances of false signals and offers a robust method for identifying potential reversals.
Usefulness:
The strategy is particularly useful for traders who prefer a more quantitative approach, relying on calculated price levels rather than indicators. The clear rules for entry, stop loss, and take profit make it easier to execute consistently.
The inclusion of both 1:5 and 1:3 risk-to-reward targets allows for flexibility depending on market conditions, ensuring that traders can adapt to varying levels of volatility.
Chart Signals and Examples
To demonstrate the effectiveness of this strategy, let's look at a few hypothetical examples on a 5-minute chart:
Example 1: Clear Reversal Signal
The price steadily rises and crosses above the predefined upper mathematical level. The next candle breaks below the low of this candle and closes lower, triggering a sell signal.
A red dotted line is drawn at the stop loss level (the high of the candle that crossed the upper level).
Two green dashed lines are drawn to indicate the first and second take profit levels.
Example 2: No Signal Due to Ongoing Trade
After an initial sell signal is triggered, the price fluctuates but does not hit either the stop loss or the first take profit target. During this period, the strategy refrains from issuing any new signals, adhering to the trade management rule.
Example 3: Trade Reaches Target 1
In another scenario, the price moves sharply in favor of the trade after the signal is triggered. The first take profit level is hit, securing a profit. The trade is then considered closed, and the strategy is ready to issue a new signal when conditions are met.

Candlestick Reversal and Trend Signals [AlgoAlpha]🚀 Unleash your charting capabilities with the Candlestick Reversal and Trend Signals indicator by AlgoAlpha, your go-to tool for spotting pivotal market movements! This script enhances your trading experience by identifying key candlestick patterns and trend changes, perfect for traders aiming for precision in their technical analysis.
🛠 Key Features:
- 🔄 Multi-Timeframe Analysis : Leverages a timeframe multiplier to analyze levels on higher timeframes, enhancing the depth and applicability of insights.
- 🧩 Diverse Pattern Detection : Capable of detecting a wide array of patterns including Bull/Bear Engulfings, Dojis, Haramis, Piercing Lines, Dark Cloud Covers, and Morning/Evening Stars, each contributing to a robust trading strategy.
- 🔍 Dynamic Trend Filters : Utilizes three exponential moving averages (EMAs) and volume filters to decisively confirm trend directions and strength, providing a clearer picture of market dynamics.
- ⚙️ Customizable Settings : Features adjustable settings for filter period, signal thresholds, and appearance, allowing for a tailored analysis experience to fit individual trading styles.
- 📉 Swing Levels Identification : Marks significant high and low swing points on the chart, highlighting potential pivot points and trend reversals for strategic trading decisions.
📈 Quick Guide to Using the Candlestick Reversal and Trend Signals Indicator
1. 🛠 Add the Indicator : Add the indicator to your favorites. Adjust the settings to match your analysis needs.
2. 📊 Analysis : Keep an eye out for the specific symbols plotted on your chart that indicate various candlestick patterns. Use these signals to enhance your market analysis.
3. 🔔 Set Alerts : Enable alerts for the patterns you are most interested in to get notified of potential trading opportunities without needing to monitor the charts constantly.
Embark on your enhanced trading journey with this powerful tool! 🚀✨ Happy trading!
🧐 How It Works:
The Candlestick Reversal and Trend Signals indicator operates by integrating several candlestick patterns and trend analysis features to assist in making informed trading decisions. Initially, it gathers user-defined settings like the period for filtering, signal thresholds, and the desired patterns to detect. It analyzes candlestick formations such as Bull/Bear Engulfings, Dojis, Haramis, and more, by comparing the current candlestick's attributes (such as body length and direction) with previous data to identify potential market reversals or confirmations. The indicator enhances its accuracy through additional filters like volume ratios and exponential moving averages (EMAs) that help validate the strength and direction of trends. By marking these patterns and trends visually on the chart, it provides clear signals that aid traders in identifying significant market movements efficiently. The script is then complemented with the 3 EMA indicator for trend detection and swing levels for added confluence.

Bull Bear Trend IndicatorIntroduction: Origin of the Swing Point Indicator
In the quest for a reliable indicator that accurately predicts trend directions and identifies valid highs and lows, the genesis of the Swing Point Indicator emerged. Faced with the challenge of finding a tool that provided comprehensive market analysis and actionable insights, the need for a novel solution became evident. Combining insights gleaned from market analysis and innovative algorithmic approaches, the Swing Point Indicator was born.
Enhanced Feature: Highs and Lows Labeling in Trend Direction
In addition to its core functionalities, the Swing Point Indicator incorporates an advanced feature that enhances the visualization of trend direction. This feature provides further clarity by selectively labeling highs and lows based on the prevailing trend, reinforcing the identification of higher highs and lower lows in uptrends and downtrends, respectively. Overlapping labels on highs and lows signify a potential trend change, providing traders with valuable insight into market reversals.
Detailed Description:
1. Uptrend Labeling:
- Higher Highs (Green Label with Price): In an uptrend, where higher highs are observed, the indicator labels these points with vibrant green color and includes the corresponding price value. This visually highlights the significance of higher highs as pivotal points in the upward trajectory of prices.
- Higher Lows (Red Marker without Text or Diamond): To complement the identification of higher highs, higher lows are marked with a distinct red marker or diamond, devoid of any accompanying text. While these points are crucial in delineating the ascending trend, their emphasis lies in their role as support levels, providing a foundation for upward price movements.
2. Downtrend Labeling:
- Lower Lows (Red Label with Price): Conversely, in a downtrend characterized by lower lows, the indicator labels these points with conspicuous red color, accompanied by the corresponding price value. Lower lows signify critical levels of downward price momentum, acting as indicators of potential bearish continuation.
- Lower Highs (Green Marker without Text or Diamond): Lower highs, indicative of downward retracements in a downtrend, are marked by distinctive green markers or diamonds without accompanying text. While these points denote temporary pauses or pullbacks in the bearish trend, their emphasis lies in their role as resistance levels, impeding upward price movements.
Functionality and Utility:
- Customizable Lookback Candle Count: Traders have the option to adjust the lookback candle count, which is set by default at 108 candles in the settings. This flexibility allows traders to tailor the indicator to their specific trading preferences and timeframes.
- Equal Highs or Lows Option: When enabled, the Swing Point Indicator can identify equal highs or equal lows, providing traders with additional insight into market dynamics.
- Formation Confirmation: A new higher high along with its higher low or a new lower low along with its lower high is confirmed after two candles have closed following the swing point candle. This ensures the reliability of the identified trend direction.
Conclusion:
The incorporation of selective labeling for highs and lows based on trend direction, alongside the introduction of customizable settings and formation confirmation criteria, enhances the effectiveness of the Swing Point Indicator. This feature-rich tool empowers traders with a nuanced understanding of market dynamics, highlighting critical price levels and trend reversals. By offering enhanced visualization, customizable options, and confirmation criteria, the Swing Point Indicator equips traders with the confidence and precision needed to navigate the markets successfully, contributing to more informed and profitable trading strategies.

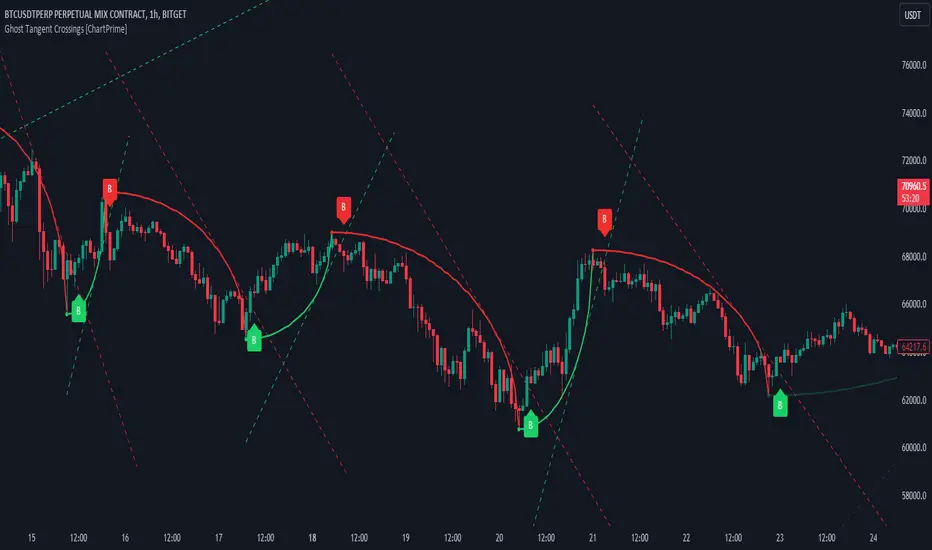
Ghost Tangent Crossings [ChartPrime]Ghost Tangent Crossings (ChartPrime) is a revolutionary way to visualize pivot points and zig-zag patterns that utilizes ellipses. This indicator makes sure that each pivot is plotted from high to low, ensuring a correct zig-zag wave pattern. Before a zig-zag is confirmed Ghost Tangent Crossings (ChartPrime) plots an estimate of the next valid move allowing you to plan well ahead of time. Once it is confirmed, the indicator will fill in the plot with a solid color and print a break label.
Unlike other zig-zag or pivot point indicators, Ghost Tangent Crossings (ChartPrime) only has a pivot lookforward input. This is because the lookback is automatically adjusted based on the last known zig-zag. This allows the indicator to dynamically look for the most recent valid market movement. The equipoint is calculated as the point along the ellipse with an equal change in price on either side. From this point we plot a line with the slope at that location and when the price breaks this level a break label is plotted. Alternatively you can plot this point as a horizontal line. This area works as support and resistance for the market as its the point where the balance in movement is found. We feel that this is a simple and elegant solution to connected zig-zag patterns that utilizes a novel method of visualization that many traders will find useful. With its simple controls and intuitive style, we believe that Ghost Tangent Crossings (ChartPrime) will find a home on most traders charts.
To use Ghost Tangent Crossings (ChartPrime) simply add it to your chart and adjust the lookforward to your taste. From there you can adjust the color of the zig-zags and enable or disable any of the visual features. We have included both wick and body pivot types to accommodate most trading style. From there, you are all done and ready to trade!
Enjoy
Intraday Fibonacci Levels [Gorb]Welcome to the Intraday Fibonacci Levels indicator, a dynamic and customizable tool designed for traders who incorporate Fibonacci retracements and extensions into their technical analysis. This indicator focuses on intraday price action, allowing you to select a specific candle from any trading session and visualize crucial Fibonacci levels derived from its high and low prices.
Features:
Candle Selection for Fibonacci Analysis: Select any candle based on its time to plot Fibonacci levels, giving you control over the period of analysis.
Customizable .236 and .618 Fibonacci Levels: Plot and customize the .236 and .618 Fibonacci retracement and extension levels. Adjust color and line style for each level to fit your chart preferences.
User-Friendly Interface: Easy-to-use input fields for selecting the candle time and configuring Fibonacci settings. Intuitive toggle options to display or hide specific Fibonacci levels.
Dynamic Updating: The indicator updates in real-time as new price data is received, ensuring you have the latest Fibonacci levels on your chart.
Usage Case:
This indicator is ideal for day traders and technical analysts who utilize Fibonacci tools to identify potential support and resistance levels, trend reversals, or continuation patterns. Whether you are analyzing a high-impact news event candle or a significant pivot point in the trading day, this indicator helps bring clarity to your Fibonacci-based trading strategy.
Guidelines for Usage:
Use the indicator settings to select the candle time and configure your desired Fibonacci levels. You can choose any time you want, in order to use premarket candles you need to enable electronic hours on your chart to have levels plot from pre/post.
These auto plotted levels can act as pivot points or points of support and resistance for traders to make informed trading decisions near these levels. Analyze the plotted Fibonacci levels in conjunction with other technical indicators or price action patterns for informed trading decisions.
Conclusion:
This indicator is a versatile and essential tool for traders who rely on Fibonacci analysis as part of their trading arsenal. By offering the flexibility to analyze specific candles and customize Fibonacci levels, this indicator empowers you to make more informed trading decisions. Its user-friendly design and real-time updating capabilities ensure that you have access to accurate and relevant Fibonacci data at any moment of the trading day.
RISK DISCLAIMER
All content, tools, scripts & education provided by Monstanzer or Gorb Algo are for informational & educational purposes only. Trading is risk and most lose their money, past performance does not guarantee future results.

ICT HTF MSS & Liquidity (fadi)ICT HTF MSS & Liquidity provides higher timeframe view of where the liquidity may reside and when higher timeframe market structure shift has occurred.
In his 2022 mentorship, ICT has advocated used the 15m chart to watch for liquidity and looking for lower timeframes for entry (5m,4m,3m,2m,1m).
Liquidity will reside above pivot points and ICT pivot points are based on 3 candle formation for the short term, three short term formation for intermediate, and three intermediate formation for the long terms.
Options
Timeframe Timeframe to monitor
Use the Short, Intermediate, or Long Term highs and lows
Liquidity Styles
Open liquidity line style, size, and color
Claimed liquidity line style, size, and color
Extend the open liquidity line beyond the current candle
Number of lines to display, this includes claimed and open

V Bottom & V Top Pattern [Misu]█ This indicator shows V bottom & V top patterns as well as potential V bottom & V top.
These V bottom & V top are chart powerful reversal patterns.
They appear in all markets and time-frames, but due to the nature of the aggressive moves that take place when a market reverses direction, it can be difficult to identify this pattern in real-time.
To address this problem, I added potential V pattern as well as the confirmed one.
█ Usages:
You can use V top & V bottoms for reversal zones.
You can use it for scalping strategies, as a main buy & sell signal.
Potential V patterns can be used to anticipate the market, in addition to volatility or momentum indicators, for example.
█ How it works?
This indicator uses pivot points to determine potential V patterns and confirm them.
Paramaters are available to filter breakouts of varying strengths.
Patterns also have a "max number bars" to be validated.
█ Why a Strategy type indicator?
Due to the many different parameters, this indicator is a strategy type.
This way you can overview the best settings depending on your pair & timeframe.
Parameters are available to filter.
█ Parameters:
Deviation: Parameter used to calculate parameters.
Depth: Parameter used to calculate parameters.
Confirmation Type: Type of signal used to confirme the pattern.
> Mid Pivot: pattern will confirm on mid pivot breakout.
> Opposit Pivot: pattern will confirm on opposit pivot breakout.
> No confirmation: no confirmation.
Lenght Avg Body: Lenght used to calculate the average body size.
First Breakout Factor: This factor multiplied by the "body avg" filters out the non-significant breakout of potential V pattern.
Confirmation Breakout Factor: This factor multiplied by the "body avg" filters out the non-significant breakout for the confirmation.
Max Bars Confirmation: The maximum number of bars needed to validate the pattern.

Customizable Pivot Support/Resistance Zones [MyTradingCoder]This script uses the standard pivot-high/pivot-low built-in methods to identify pivot points on the chart as a base calculation for the zones. Rather than displaying basic lines, it displays a zone from the original pivot point to the closest part of the available body on the same candle. The script comes in handy by utilizing Pinescripts available input.source() function to allow for an external indicators output value to be used within the indicator. Make sure to read all of the TOOLTIPS in the indicator settings menu to get a full understanding of what each setting does, and how it can affect the results that end up on the chart.
By enabling the custom filter in the indicator settings, you will notice you have the ability to filter out zones using an external indicator such as an RSI. Maybe you only want zones to be calculated/drawn when the RSI is overbought or oversold, or maybe you only want the zones to calculate/draw if the Supertrend is green or red. The list of possible filters that you can implement is too many to count. Feel free to play around with the indicator however you like, and configure something that you find to be the most useful for your trading.
On top of everything listed above, the indicator has pre-programmed built-in alertconditions so that you can potentially automate trading, or get a notification to your cell phone when a zone is being touched/broken.

Volume Profile, Pivot Anchored by DGTVolume Profile (also known as Price by Volume ) is an charting study that displays trading activity over a specified time period at specific price levels. It is plotted as a horizontal histogram on the finacial isntrumnet's chart that highlights the trader's interest at specific price levels. Specified time period with Pivots Anchored Volume Profile is determined by the Pivot Levels, where the Pivot Points High Low indicator is used and presented with this Custom indicator
Finally, Volume Weighted Colored Bars indicator is presneted with the study
Different perspective of Volume Profile applications;
Anchored to Session, Week, Month etc : Anchored-Volume-Profile
Custom Range, Interactive : Volume-Profile-Custom-Range
Fixed Range with Volume Indicator : Volume-Profile-Fixed-Range
Combined with Support and Resistance Indicator : Price-Action-Support-Resistance and Volume-Profile
Combined with Supply and Demand Zones, Interactive : Supply-Demand-and-Equilibrium-Zones
Disclaimer : Trading success is all about following your trading strategy and the indicators should fit within your trading strategy, and not to be traded upon solely
The script is for informational and educational purposes only. Use of the script does not constitutes professional and/or financial advice. You alone the sole responsibility of evaluating the script output and risks associated with the use of the script. In exchange for using the script, you agree not to hold dgtrd TradingView user liable for any possible claim for damages arising from any decision you make based on use of the script

Distance Oscillator - Support and Resistance by DGT
Prices high above the Moving Average (MA) or low below it are likely to be remedied in the future by a reverse price movement as stated in the article by Denis Alajbeg, Zoran Bubas and Dina Vasic published in International Journal of Economics, Commerce and Management
This study is the third variant that aims to present this idea, and the output of the study is presented as lines that serve as possible support and resistance levels in the future.
1st variant of the idea is presented as an centered oscillator, link to Price Distance to its MA Study , within its description you may find more about the idea and some statistical observations. Also some derivatives with MACD-X, More Than MACD and P-MACD
2nd variant of the idea are presented as colored triangle line (Volatility Colored Price/MA Line), using the same calculation methods and presented in the bottom of price chart.
Link to studies where it is included : Colored Directional Movement and Bollinger Band's Cloud , SuperTrendRange and Pivot Points vX
3rd variant (this study) as stated earlier aims to present the same idea as support and resistance levels.
Options
The users can adjust source and length of the moving average that is used as base for the distance oscillator
Signal triggering options includes length for the deviation bands, multiplier as well as smoothing of the oscillator
Line customization settings
Additionally an alert can be configured to be warned earlier to watch out for probable pullbacks or reversals
Technical details for whom interested
Calculating the price distance to the MA results in a centered oscillator lets call it Distance Oscillator (quite similar to the RSI), as shown in the blow chart
Unlike RSI, oscillations with the distance oscillator are not limited within a specific range, hence identifying overbought and oversold is not as straight forward as it is with RSI. To determine overbought and oversold levels, standard deviation of distance oscillator is calculated and bands generated with the same approach applied with Bollinger Bands.
Once we have the threshold bands then crossing those bands we may assume as important levels and draw a line, if oscillator values keeps above the threshold bands (deviation bands) the logic behind the code will update the line drawing accordingly.
To reduce noise a smoothing can be applied
Alerts :
Please note that the implementation applied here can be applied to any oscillator such as RSI, Stochastic, MFI etc even Volume (if bear candle volumes are multiplied by -1)
Disclaimer :
Trading success is all about following your trading strategy and the indicators should fit within your trading strategy, and not to be traded upon solely
The script is for informational and educational purposes only. Use of the script does not constitute professional and/or financial advice. You alone have the sole responsibility of evaluating the script output and risks associated with the use of the script. In exchange for using the script, you agree not to hold dgtrd TradingView user liable for any possible claim for damages arising from any decision you make based on use of the script