ProfitTrailer Example TradingView Signals [v2019-01-31]ProfitTrailer Example TradingView Signal
This script provides an example of a TradingView Signal for use with ProfitTrailer's
new SIGNALS functionality and it's new TradingView integration capability.
This signals script implements a simple Moving Average Cross strategy
that works on any chart timeframe.
It allows you to pick the Price source i.e. Open, Close (default), etc.
You are able to choose between EMA (default) or SMA moving average
calculations.
You can define the fast and slow period lengths for use within the
moving average calculations.
If you get some value out of this indicator please consider making
a small donation to my favourite charity the Save the Childrens Fund.
Every donation will make a difference to the lives of children.
All donations over $2 are tax deductable. You can donate here:
savethechildrenfundraising.org.au
Copyright (c) 2019, Grant Cause aka CryptoCoyns
Cerca negli script per "profit"


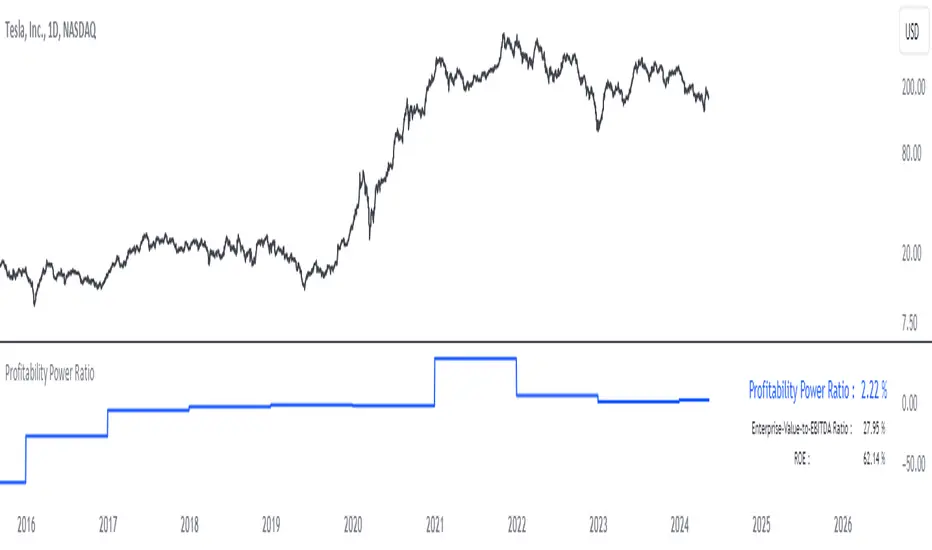
Profitability Power RatioProfitability Power Ratio
The Profitability Power Ratio is a financial metric designed to assess the efficiency of a company's operations by evaluating the relationship between its Enterprise Value (EV) and Return on Equity (ROE). This ratio provides insights into how effectively a company generates profits relative to its equity and overall valuation.
Qualities and Interpretations:
1. Efficiency Benchmark: The Profitability Power Ratio serves as a benchmark for evaluating how efficiently a company utilizes its equity capital to generate profits. A higher ratio indicates that the company is generating significant profits relative to its valuation, reflecting efficient use of invested capital.
2. Financial Health Indicator: This ratio can be used as an indicator of financial health. A consistently high or improving ratio over time suggests strong operational efficiency and sustainable profitability.
3. Investment Considerations: Investors can use this ratio to assess the attractiveness of an investment opportunity. A high ratio may signal potential for good returns, but it's important to consider the underlying reasons for the ratio's level to avoid misinterpretation.
4. Risk Evaluation: An excessively high Profitability Power Ratio could also signal elevated risk. It may indicate aggressive financial leveraging or unsustainable growth expectations, which could pose risks during economic downturns or market fluctuations.
Interpreting the Ratio:
1. Higher Ratio: A higher Profitability Power Ratio typically signifies efficient capital utilization and strong profitability relative to the company's valuation.
2. Lower Ratio: A lower ratio may suggest inefficiencies in capital allocation or lower profitability relative to enterprise value.
3. Benchmarking: Compare the company's ratio with industry peers and historical performance to gain deeper insights into its financial standing and operational efficiency.
Using the Indicator:
The Profitability Power Ratio is plotted on a chart to visualize trends and fluctuations over time. Users can customize the color of the plot to emphasize this metric and integrate it into their financial analysis toolkit for comprehensive decision-making.
Disclaimer: The Profitability Power Ratio is a financial metric designed for informational purposes only and should not be considered as financial or investment advice. Users should conduct thorough research and analysis before making any investment decisions based on this indicator. Past performance is not indicative of future results. All investments involve risks, and users are encouraged to consult with a qualified financial advisor or professional before making investment decisions.
Profitability Visualization with Bid-Ask Spread ApproximationOverview
The " Profitability Visualization with Bid-Ask Spread Approximation " indicator is designed to assist traders in assessing potential profit and loss targets in relation to the current market price or a simulated entry price. It provides flexibility by allowing users to choose between two methods for calculating the offset from the current price:
Bid-Ask Spread Approximation: The indicator attempts to estimate the bid-ask spread by using the highest (high) and lowest (low) prices within a given period (typically the current bar or a user-defined timeframe) as proxies for the ask and bid prices, respectively. This method provides a dynamic offset that adapts to market volatility.
Percentage Offset: Alternatively, users can specify a fixed percentage offset from the current price. This method offers a consistent offset regardless of market conditions.
Key Features
Dual Offset Calculation Methods: Choose between a dynamic bid-ask spread approximation or a fixed percentage offset to tailor the indicator to your trading style and market analysis.
Entry Price Consideration: The indicator can simulate an entry price at the beginning of each trading session (or the first bar on the chart if no sessions are defined). This feature enables a more realistic visualization of potential profit and loss levels based on a hypothetical entry point.
Profit and Loss Targets: When the entry price consideration is enabled, the indicator plots profit target (green) and loss target (red) lines. These lines represent the price levels at which a trade entered at the simulated entry price would achieve a profit or incur a loss equivalent to the calculated offset amount.
Offset Visualization: Regardless of whether the entry price is considered, the indicator always displays upper (aqua) and lower (fuchsia) offset lines. These lines represent the calculated offset levels based on the chosen method (bid-ask approximation or percentage offset).
Customization: Users can adjust the percentage offset, toggle the bid-ask approximation and entry price consideration, and customize the appearance of the lines through the indicator's settings.
Inputs
useBidAskApproximation A boolean (checkbox) input that determines whether to use the bid-ask spread approximation (true) or the percentage offset (false). Default is false.
percentageOffset A float input that allows users to specify the percentage offset to be used when useBidAskApproximation is false. The default value is 0.63.
considerEntryPrice A boolean input that enables the consideration of a simulated entry price for calculating and displaying profit and loss targets. Default is true.
Calculations
Bid-Ask Approximation (if enabled): bidApprox = request.security(syminfo.tickerid, timeframe.period, low) Approximates the bid price using the lowest price (low) of the current period. askApprox = request.security(syminfo.tickerid, timeframe.period, high) Approximates the ask price using the highest price (high) of the current period. spreadApprox = askApprox - bidApprox Calculates the approximate spread.
Offset Amount: offsetAmount = useBidAskApproximation ? spreadApprox / 2 : close * (percentageOffset / 100) Determines the offset amount based on the selected method. If useBidAskApproximation is true, the offset is half of the approximated spread; otherwise, it's the current closing price (close) multiplied by the percentageOffset.
Entry Price (if enabled): var entryPrice = 0.0 Initializes a variable to store the entry price. if considerEntryPrice Checks if entry price consideration is enabled. if barstate.isnew Checks if the current bar is the first bar of a new session. entryPrice := close Sets the entryPrice to the closing price of the first bar of the session.
Profit and Loss Targets (if entry price is considered): profitTarget = entryPrice + offsetAmount Calculates the profit target price level. lossTarget = entryPrice - offsetAmount Calculates the loss target price level.
Plotting
Profit Target Line: Plotted in green (color.green) with a dashed line style (plot.style_linebr) and increased linewidth (linewidth=2) when considerEntryPrice is true.
Loss Target Line: Plotted in red (color.red) with a dashed line style (plot.style_linebr) and increased linewidth (linewidth=2) when considerEntryPrice is true.
Upper Offset Line: Always plotted in aqua (color.aqua) to show the offset level above the current price.
Lower Offset Line: Always plotted in fuchsia (color.fuchsia) to show the offset level below the current price.
Limitations
Approximation: The bid-ask spread approximation is based on high and low prices and may not perfectly reflect the actual bid-ask spread of a specific broker, especially during periods of high volatility or low liquidity.
Simplified Entry: The entry price simulation is basic and assumes entry at the beginning of each session. It does not account for specific entry signals or order types.
No Order Execution: This indicator is purely for visualization and does not execute any trades.
Data Discrepancies: The high and low values used for approximation might not always align with real-time bid and ask prices due to differences in data aggregation and timing between TradingView and various brokers.
Disclaimer
This indicator is for educational and informational purposes only and should not be considered financial advice. Trading involves substantial risk, and past performance is not indicative of future results. Always conduct thorough research and consider your own risk tolerance before making any trading decisions. It is recommended to combine this indicator with other technical analysis tools and a well-defined trading strategy.

Profit/Loss LabelOnce I entered a trade, I always wanted to know quickly if I am in a profitable position or losing NOW?
Here's the label to do the work for me, and if you like it, please give it a thumb up.
*** There's a setting to change your trade type to LONG or SHORT with a commission rate.
*** Color setups:
- If it's green: profitable position, including the pay for comission
- If it's orange: moving in favorite direction, but still a losing position due to the comission
- If it's red: losing position moving in the opposite direction

Profit EstimateLibrary "profitestimate"
Simple profit Estimatr. Engages when Position != 0
and holds until posittion is na/0...
if position changes sizes, it will update automatically and adjust.
it has an input for comission to estmate exit fees
update_avgprice(_sizewas, _delta, _pricewas, _newprice)
Get a new Average position Price
Parameters:
_sizewas : (float) the position prior
_delta : (float) the order amount
_pricewas : (float) the prior price
_newprice : (float) the price of order
Returns: New Avg Price
amount(_position, _close, _commission, _leverage, _fullqty)
Position Net Profit Net Commission, automatic on/off if position != 0
Parameters:
_position : (float) position size (total or margin size)
_close
_commission : (float) % where (0.1 = 0.1%)
_leverage : (float) optional if leveraged, default 1x
_fullqty : (bool) if position entered is tottal trade size default is margin qty (1/lev)
Returns: quote value of profit
percent(_position, _close, _commission, _leverage, _fullqty)
Position Net Profit, automatic on/off if position != 0
Parameters:
_position : (float) position size (total or margin size)
_close
_commission : (float) % where (0.1 = 0.1%)
_leverage : (float) optional if leveraged, default 1x
_fullqty : (bool) if position entered is tottal trade size, default is margin qty (1/lev)
Returns: percentage profit (1% = 1)

Profit Percentage TrackerThis script provides a quick and easy way to visualize profits in a chart, based on the given entry date and price.
Optionally, alerts can be sent when profits cross up the given " profit unit ".
In short:
Tracks how much profit one could take based on the input " entry date " and the input " entry price "
These inputs are interactive (www.tradingview.com)
Displays the result in a label on top of the last candle
(Optional) Sends alerts based on the given " profit unit ", that is: if ' 0.5 ' is given, then an alert is triggered every time the profit is raised by that number
(Be careful with low values, as TradingView could stop an alert if it triggers too much.)
For alerts to be displayed, a " script alert " must be created right after the script was added to the chart:
- www.tradingview.com
(Choose ' Profits ' as condition and ' Any alert() function call ')
Good to know: if you check " Notify on app ", alerts can be delivered directly to your phone:
i.imgur.com
Prerequirements :
The chart's timezone has to be set to " Exchange " (this is required in order to support the alert's logic):
- kodify.net

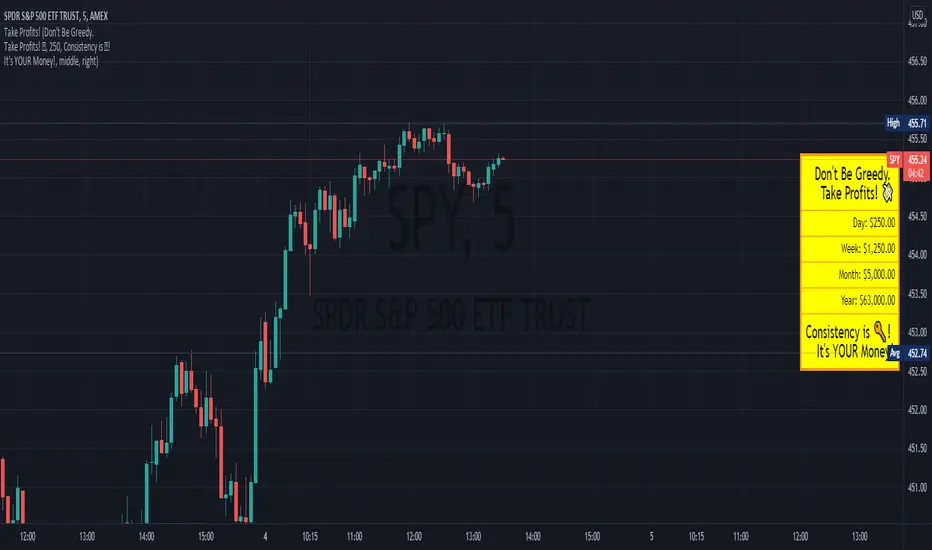
Profit ReminderThis is a Visual Indicator intended to be a reminder to those who need it!
This indicator allows you to set a profit level and displays the calculated values if you were to profit that amount each day.
The vision of this indicator is to get the user more green trades by reminding them to get out while they're ahead, because there are more days ahead!
It also allows for the user to set phrases that might help them with this.
Look forward to what's ahead and don't get caught up in over trading!
Gold Profit Target SystemGOLD PROFIT TARGET SYSTEM
Track Real Profits, Exit With Confidence
Best on Daily or Weekly - copy and mod as you see fit. Have fun!
WHAT THIS INDICATOR DOES:
This indicator tracks your gold position from entry and shows color-coded profit targets as the price rises. Instead of guessing when to exit, you see exact profit levels in real-time: 1%, 2%, 3%, 4%, 5%, 10%, 15%, 20%, 25%, and 25%+.
Simple concept: BUY on the signal, SELL at YOUR chosen profit level.
HOW IT WORKS - 3 SIMPLE STEPS:
STEP 1: Wait for BUY Signal
• Green triangle (▲) appears below the composite line
• Triggered when inverse assets (DXY, rates, etc.) show strong correlation and are falling
• Entry price is automatically recorded
• Position tracking begins
STEP 2: Watch Profit Targets Appear
• As gold rises, color-coded symbols appear above the composite line
• Each symbol represents a profit milestone
• The info table shows your current profit
• You decide when to exit based on YOUR target
STEP 3: Exit at Your Chosen Level
• Conservative? Exit at 5-10%
• Moderate? Exit at 10-15%
• Aggressive? Hold for 20%+
• The indicator just shows the levels - YOU make the call
THE COMPOSITE LINE - WHAT IT MEANS:
The main line is a weighted composite of inverse-correlated assets:
• DXY (US Dollar Index)
• Real Interest Rates (10Y TIPS)
• US 10-Year Treasury Yield
• US 2-Year Treasury Yield
• Bitcoin (optional)
• Copper (optional)
Line Position:
• Below -30 (Bright Green): Very strong inverse correlation - excellent BUY conditions
• Below 0 (Green): Inverse correlation present - moderate BUY conditions
• Above 0 (Red): Inverse assets rising - neutral to bearish
• Above 30 (Bright Red): Strong inverse rally - bearish for gold
What Causes BUY Signals:
When the composite line is negative (inverse assets falling) AND shows strong correlation (>0.3), this suggests gold is likely to rise. The indicator records your entry and begins tracking profits.
COLOR-CODED PROFIT TARGETS:
EARLY PROFITS (Green Circles):
• 1% - Very Light Green (#c8e6c9) - First confirmation
• 2% - Light Green (#a5d6a7) - Building profit
• 3% - Green (#81c784) - Good profit
• 4% - Medium Green (#66bb6a) - Strong profit
• 5% - Dark Green (#4caf50) - Solid profit!
EXCELLENT PROFIT (Yellow Diamond):
• 10% - Yellow (#ffd54f) - Double digits, excellent trade!
OUTSTANDING PROFIT (Orange Diamonds):
• 15% - Orange (#ffb74d) - Exceptional profit, consider partial exit
EXCEPTIONAL PROFIT (Red Diamonds):
• 20% - Light Red (#ff8a65) - Rare territory, strong exit consideration
• 25% - Red (#f44336) - Extraordinary profit, very rare!
PEAK PROFIT (Purple Star):
• 25%+ - Purple (#9c27b0) - Once in a blue moon! The home run trade!
STOP LOSS (Red X):
• Default -5% - Protection against losses
• Position auto-resets if stop is hit
THE PROFIT BAR (Histogram):
Below the composite line, you'll see a colored histogram when in position:
Bar Color = Your Current Profit Tier
• Light green bar = 1-2% profit
• Green bar = 3-5% profit
• Yellow bar = 10% profit
• Orange bar = 15% profit
• Red bar = 20-25% profit
• Purple bar = 25%+ profit
• Red negative bar = Currently at a loss
Bar Height = Current Profit %
The taller the bar, the larger your profit. Negative bars extend downward when you're at a loss.
THE INFORMATION TABLE:
The table (top-right by default) shows everything at a glance:
Position: ✓ IN (green) or ✗ OUT (gray)
Shows whether you're currently holding a position
Entry Price: Your recorded buy price
Example: 2,100.50
Current Price: Gold's current price
Example: 2,142.75
Current P/L: YOUR PROFIT %
This is the most important metric - shows exactly how much you're up (or down)
Color matches your current profit tier
Example: +2.01% in light green
Profit Tier: Current milestone reached
Shows which profit level you've hit: "1%", "2%", "5%", "10%", etc.
Next Target: The next profit level to watch
Tells you what milestone is coming up next
Bars Held: How long you've been in the trade
Helps track holding time
Composite: Current correlation strength
Shows the underlying composite correlation value
REFERENCE LINES:
Zero Line (Gray):
The center line. Above = bearish for gold, Below = bullish for gold
Strong Bull Line (Green dashed at -30):
When composite crosses below -30, very strong BUY conditions
Strong Bear Line (Red dashed at +30):
When composite crosses above +30, strong bearish conditions
BACKGROUND SHADING:
Very Light Green Background:
You're in profit (position open and above entry price)
Very Light Red Background:
You're at a loss (position open and below entry price)
No Background:
No position currently open
SYMBOLS ON CHART:
▲ Green Triangle Below Line: BUY SIGNAL
Enter long position here. Entry price recorded.
● Small Green Circles Above Line: 1-5% Profits
Early profit targets. Light green to dark green progression.
◆ Diamonds Above Line: 10-25% Profits
Major profit milestones. Yellow → Orange → Red progression.
★ Purple Star Above Line: 25%+ Profit
The holy grail! Peak profit achieved.
✖ Red X Below Line: STOP LOSS HIT
Trade went against you. Position resets (if auto-reset enabled).
PROFIT-TAKING STRATEGIES:
Strategy 1: Fixed Target (Simple)
Pick one target (e.g., 10%) and always exit there.
Best for: Beginners, disciplined traders
Strategy 2: Scaled Exit (Advanced)
Exit in portions:
• 5% profit → Sell 25%
• 10% profit → Sell 25% (50% total out)
• 15% profit → Sell 25% (75% total out)
• 20%+ profit → Let final 25% ride
Best for: Risk management, maximizing upside
Strategy 3: Trailing Stop
• Hit 10%? Set stop at 5%
• Hit 15%? Set stop at 10%
• Lock in profits while letting winners run
Best for: Trend followers, bull markets
Strategy 4: Adaptive
• Strong uptrend → wait for 15-20%
• Choppy market → exit at 5-10%
• Weakening trend → exit at any profit
Best for: Experienced traders
SETTINGS YOU CAN CUSTOMIZE:
Profit Target Levels:
Change any profit % to match your strategy
• Conservative: Lower targets (0.5%, 1%, 2%, 3%, 5%)
• Aggressive: Higher targets (2%, 5%, 10%, 20%, 30%)
Assets to Include:
• Enable/disable Bitcoin
• Enable/disable Copper
• Toggle which inverse assets to track
Display Options:
• Show all targets or just current tier
• Show/hide profit bar
• Show/hide composite line
• Move table position
Stop Loss:
• Set your risk tolerance (default 5%)
• Enable/disable auto-reset on stop loss
Correlation Periods:
• Adjust for your timeframe
• Hourly: 14/30/60
• Daily: 20/50/100
• Weekly: 10/20/50
ALERTS AVAILABLE:
Set alerts for any profit milestone:
Critical Alerts:
• "BUY Signal" - Entry notification
• "5% Profit Target" - First major milestone
• "10% Profit Target" - Decision point
• "Stop Loss Hit" - Risk protection
Optional Alerts:
• 1%, 2%, 3%, 4% - Early confirmations
• 15%, 20%, 25% - Major milestones
• Individual levels for your strategy
BEST TIMEFRAMES:
Daily Chart (Recommended):
Best for swing traders holding 3-10 days
Use default settings (20/50/100 periods)
Target 5-15% profits
4-Hour Chart:
Good for active swing traders
Adjust periods to 14/30/60
Target 3-10% profits
Hourly Chart:
For day traders and scalpers
Use shorter periods (14/30/60)
Target 1-5% profits
Adjust profit levels lower (0.5%, 1%, 2%, 3%)
WHY THIS INDICATOR IS DIFFERENT:
Most indicators tell you WHEN to enter.
This one tells you WHEN TO EXIT with profit.
Most indicators use vague signals.
This one shows EXACT profit percentages.
Most indicators leave exit decisions to you.
This one gives CLEAR, COLOR-CODED milestones.
Most indicators don't track your P/L.
This one shows your profit in text you can't miss.
QUICK START GUIDE:
1. Add indicator to gold chart (XAUUSD, GLD, GC1!)
2. Wait for green triangle (▲) BUY signal
3. Watch your profit grow in the table
4. Exit when you hit YOUR target (5%, 10%, 15%, etc.)
5. Repeat
That's it. Simple. Effective. Profitable.
IMPORTANT NOTES:
• This is for LONG positions only - not for shorting gold
• Position tracking begins only after a BUY signal
• The indicator shows levels - YOU decide when to exit
• Always use stop losses (default 5% is reasonable)
• Past performance doesn't guarantee future results
• Not financial advice - use for educational purposes
PRO TIPS:
Tip 1: Don't get greedy - 10-15% is an excellent profit for most trades
Tip 2: Purple stars (25%+) are RARE - don't wait for them on every trade
Tip 3: The profit bar color change is your visual cue - green→yellow→orange→red
Tip 4: Combine with resistance levels - "10% profit + resistance = exit"
Tip 5: Set alerts for YOUR target level so you never miss it
Tip 6: The giant P/L number in the table removes emotion from decisions
EXAMPLE TRADE:
Day 1: ▲ BUY signal at $2,100
Table shows: Position ✓ IN | Entry: 2,100
Day 2: Current P/L: +1.8%
First green circle appears (1% target hit)
Table tier: "1%"
Day 4: Current P/L: +5.2%
Dark green circle appears (5% target hit)
Profit bar is dark green
Decision point: Exit 50% here?
Day 7: Current P/L: +10.5%
Yellow diamond appears (10% target hit!)
Table shows: +10.5% in yellow text
Decision point: Exit remaining 50%?
Result: Average exit ~7.5% over 7 days. Excellent swing trade!
WORKS ON:
• Gold Spot (XAUUSD)
• Gold Futures (GC1!)
• Gold ETFs (GLD, IAU)
• Any gold instrument
Inverse Assets Tracked:
• DXY (US Dollar Index)
• Real Interest Rates (TIPS)
• US Treasury Yields (2Y, 10Y)
• Bitcoin (optional)
• Copper (optional)
THE BOTTOM LINE:
Stop guessing when to take profits.
Start SEEING your profit levels in real-time.
The indicator shows you the targets.
YOU choose when to cash out.
That's YOUR edge.
Developed for traders who want clear, actionable profit targets instead of vague signals.

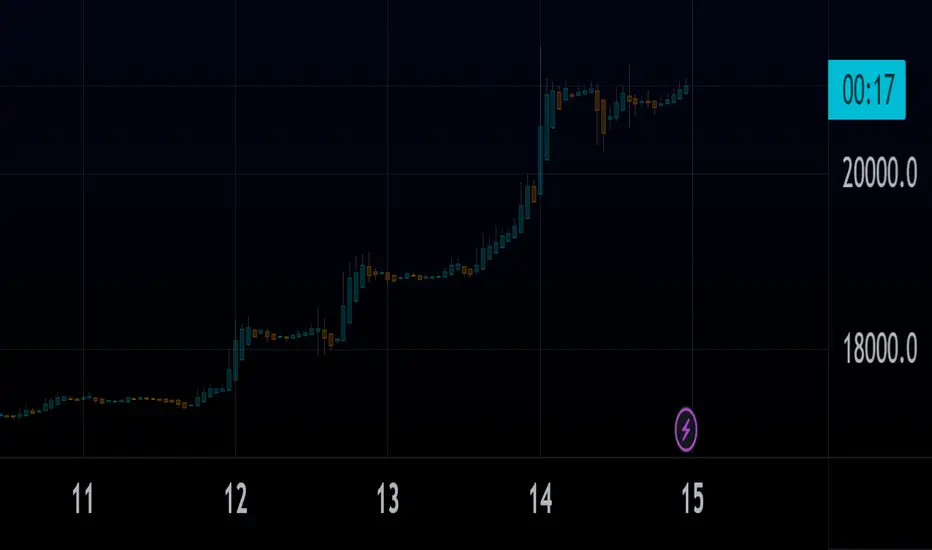
Realized Profit & Loss [BigBeluga]The Realized Loss & Profit indicator aims to find potential dips and tops in price by utilizing the security function syminfo.basecurrency + "_LOSSESADDRESSES".
The primary objective of this indicator is to present an average, favorable buying/selling opportunity based on the number of people currently in profit or loss.
The script takes into consideration the syminfo.basecurrency, so it should automatically adapt to the current coin.
🔶 USAGE
Users have the option to enable the display of either Loss or Profit, depending on their preferred visualization.
Examples of displaying Losses:
Example of displaying Profits:
🔶 CONCEPTS
The concept aims to assign a score to the data in the ticker representing the realized losses. This score will provide users with an average of buying/selling points that are better to the typical investor.
🔶 SETTINGS
Users have complete control over the script settings.
🔹 Calculation
• Profit: Display people in profit on an average of the selected length.
• Loss: Display people in loss on an average of the selected length.
🔹 Candle coloring
• True: Color the candle when data is above the threshold.
• False: Do not color the candle.
🔹 Levels
- Set the level of a specific threshold.
• Low: Low losses (green).
• Normal: Low normal (yellow).
• Medium: Low medium (orange).
• High: Low high (red).
🔹 Z-score Length: Length of the z-score moving window.
🔹 Threshold: Filter out non-significant values.
🔹 Histogram width: Width of the histogram.
🔹 Colors: Modify the colors of the displayed data.
🔶 LIMITATIONS
• Since the ticker from which we obtain data works only on the daily timeframe, we are
restricted to displaying data solely from the 1D timeframe.
• If the coin does not have any realized loss data, we can't use this script.

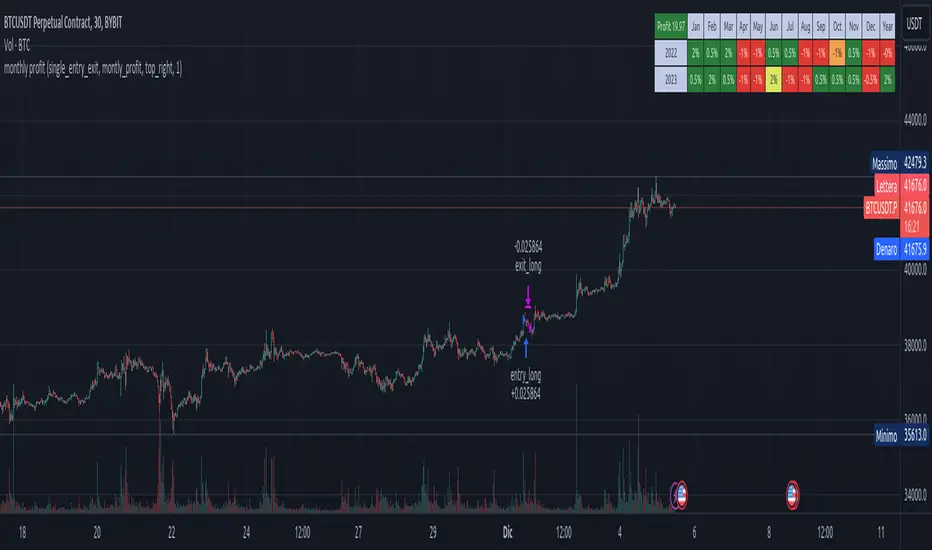
Stx Monthly Trades ProfitMonthly profit displays profits in a grid and allows you to know the gain related to the investment during each month.
The profit could be computed in terms of gain/trade_cost or as percentage of equity update.
Settings:
- Profit: Monthly profit percentage or percentage of equity
- Table position
This strategy is intended only as a container for the code and for testing the script of the profit table.
Setting of strategy allows to select the test case for this snippet (percentage grid).
Money management: not relevant as strategy is a test case.
This script stand out as take in account the gain of each trade in relation to the capital invested in each trade. For example consider the following scenario:
Capital of 1000$ and we invest a fixed amount of 1000$ (I know is too risky but is a good example), we gain 10% every month.
After 10 months our capital is of 2000$ and our strategy is perfect as we have the same performance every month.
Instead, evaluating the percentage of equity we have 10% the first month, 9.9% the second (1200$/1100$ - 1) and 5.26% the tenth month. So seems that strategy degrade with times but this is not true.
For this reason, to evaluate my strategy I prefer to see the montly return of investment.
WARNING: The strategy provided with this script is only a test case and allows to see the behavior with different "trades" management, for these reason commision are set to zero.
At the moment only the provided test cases are handled:
test 1 - single entry and single exit;
test 2 - single entry and multiple exits;
test 3 - single entry and switch position;
BEST Trailing Take Profit StrategyHello traders
Hope you enjoyed your weekend on my behalf. Was staying home working ... ^^
This is my first strategy educational post I'm doing ever
While I'm generally against posting strategies because it's very easy to fake performance numbers... I cannot prevent myself from sharing a few cool strategy snippets anyway.
So from now on, I'll be sharing a few strategies also - generally not to showcase performance but only to show what pinescript can do.
As once again strategy performance can be faked is so many ways... :)
What's on the menu?
We all know what a trailing-stop is. right? right? Ok... sharing the definition here :)
A trailing stop is designed to protect gains by enabling a trade to remain open and continue to profit as long as the price is moving in the investor's favor. The order closes the trade if the price changes direction by a specified percentage or dollar amount.
But...do you know what a trailing profit is?
Short definition : Well the same but with your profit limit order.
Long definition : A trailing profit is designed to increase your gains by enabling a trade to remain open and continue to profit as long as the price is moving in the investor's favor. The order closes the trade if the price hits the trailing profit level specified percentage or dollar amount.
Some trading strategies used both a trailing stop AND trailing profit. Not making any recommendation here - only sharing what's possible in the realm of trading and pinescripting
Trigger me I'm famous
I developed many trading strategies in my career and often I've been asked to trigger a trailing-stop or trailing-profit once a certain % move has been made.
I integrated here a Take Profit trigger - once hit, it will activate the trailing profit
On the screenshot below, the TP trigger is plotted in orange. Once the price goes past that level for the first time, I'll start trailing the profit level.
In other words, when we see a price makes an interesting move in percentage value - we decide to offset the profit as we concluded that once it reached such distance - then it leads often to more profit
Of course, using only a trailing profit without stop/trailing-stop/invalidation isn't smart and the surest way to kiss goodbye a trading capital and trading and your good mood
See you tomorrow for another strategy snippet
All the BEST
Dave

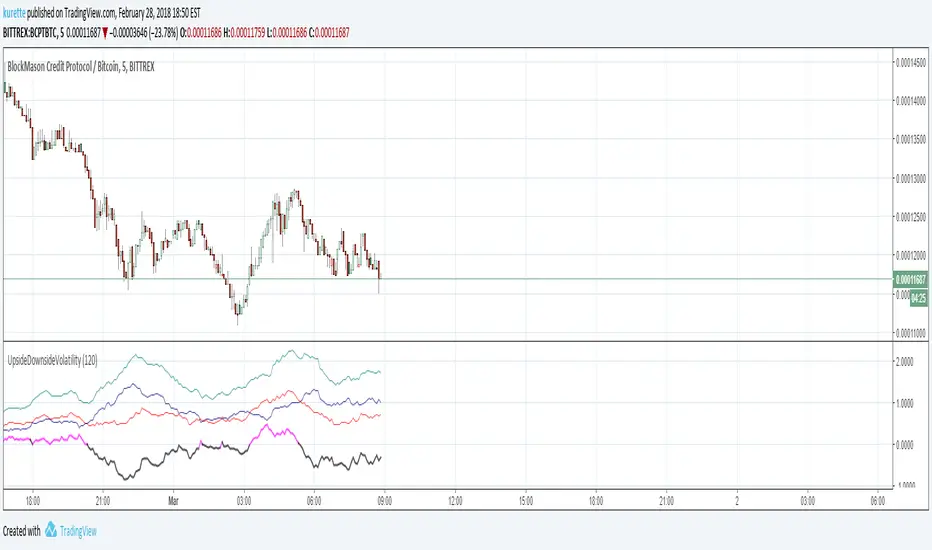
Upside Downside Volatility of ProfitTrailer FeederThis is to calculate UpsideVolatility, DownsideVolatility, UpsideDownsideVolatilityDifference, and AverageCandlesize in offset group of ProfitTrailer Feeder.
Volatilities are average changes between open and high or between open and low of 5 miniue candles in designated time frame by MinutesToMeasureTrend which can be inputable in format of this script.
In other words, volatilites are SMAspread between open and high or between open and low prices.
As described in wiki, use this script in 5 minute candle chart.
This script is to help myself understand the criteria of Feeder.
Any comments and suggestions are welcome.
Low SMA of SMAgain over the chart for ProfitTrailerLow SMA of SMAgain over the chart for ProfitTrailer
This script prints low SMA line over the chart.
Buy value and time frame numbers can be modified in format.
Basically this is same with previous scripts of mine.
Though this does not show the spread between the price and low SMA line (SMAgain) and buy value, you can see the buy trailing signal.
If you set buy value positive for gain starategy, the buy trailing will start from the time point indicated by "▲".
If you set buy value negative for gain starategy, the buy trailing will start from the time point indicated by "▼".
This script is to help myself understand the buy strategies of ProfitTrailer.
Any comments and suggestions are welcome.

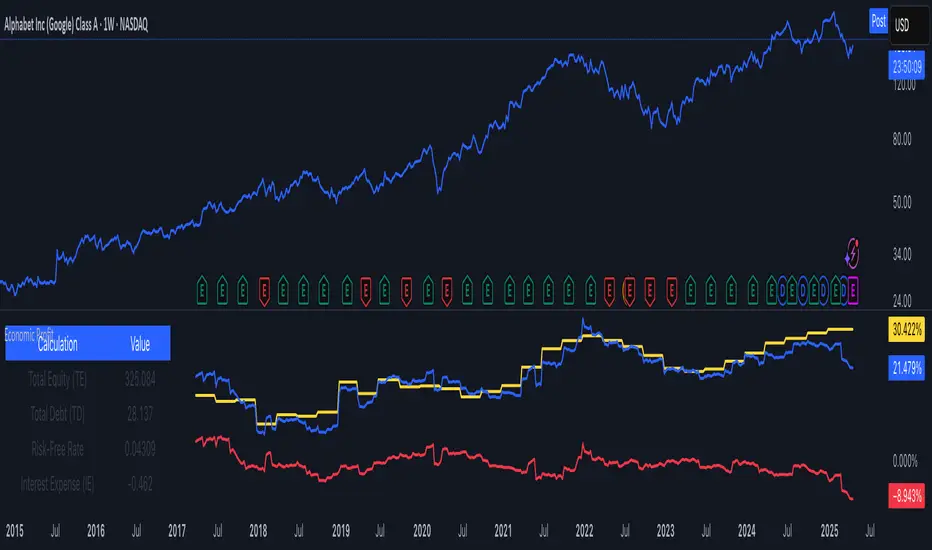
Economic Profit (YavuzAkbay)The Economic Profit Indicator is a Pine Script™ tool for assessing a company’s economic profit based on key financial metrics like Return on Invested Capital (ROIC) and Weighted Average Cost of Capital (WACC). This indicator is designed to give traders a more accurate understanding of risk-adjusted returns.
Features
Customizable inputs for Risk-Free Rate and Corporate Tax Rate assets for people who are trading in other countries.
Calculates Economic Profit based on ROIC and WACC, with values shown as both plots and in an on-screen table.
Provides detailed breakdowns of all key calculations, enabling deeper insights into financial performance.
How to Use
Open the stock to be analyzed. In the settings, enter the risk-free asset (usually a 10-year bond) of the country where the company to be analyzed is located. Then enter the corporate tax of the country (USCTR for the USA, DECTR for Germany). Then enter the average return of the index the stock is in. I prefer 10% (0.10) for the SP500, different rates can be entered for different indices. Finally, the beta of the stock is entered. In future versions I will automatically pull beta and index returns, but in order to publish the indicator a bit earlier, I have left it entirely up to the investor.
How to Interpret
We see 3 pieces of data on the indicator. The dark blue one is ROIC, the dark orange one is WACC and the light blue line represents the difference between WACC and ROIC.
In a scenario where both ROIC and WACC are negative, if ROIC is lower than WACC, the share is at a complete economic loss.
In a scenario where both ROIC and WACC are negative, if ROIC has started to rise above WACC and is moving towards positive, the share is still in an economic loss but tending towards profit.
A scenario where ROIC is positive and WACC is negative is the most natural scenario for a company. In this scenario, we know that the company is doing well by a gradually increasing ROIC and a stable WACC.
In addition, if the ROIC and WACC difference line goes above 0, the company is now economically in net profit. This is the best scenario for a company.
My own investment strategy as a developer of the code is to look for the moment when ROIC is greater than WACC when ROIC and WACC are negative. At that point the stock is the best time to invest.
Trading is risky, and most traders lose money. The indicators Yavuz Akbay offers are for informational and educational purposes only. All content should be considered hypothetical, selected after the facts to demonstrate my product, and not constructed as financial advice. Decisions to buy, sell, hold, or trade in securities, commodities, and other investments involve risk and are best made based on the advice of qualified financial professionals. Past performance does not guarantee future results.
This indicator is experimental and will always remain experimental. The indicator will be updated by Yavuz Akbay according to market conditions.
Position and Profit/LossHelps users track their position and profit/loss in real-time.
Instructions :
Open the indicator settings
Input your Quantity, Buy Price, Fee, and Target Price
This indicator is designed to provide users with simple real-time tracking of their positions and profit/loss within a trading session. It offers clear and concise information that enables users to understand their current position's profitability, making it easier for them to manage their trades effectively.
Input parameters
qty : Quantity of the position (default value: 100.0). The target label is represented by a green cross
buy_price : Buy price of the position (default value: 1.0).
fee : Fee percentage for the transaction (default value: 0.0016). note that this is not a percentage, but rather a decimal. So 0.0016 is 0.16%
target : Target price for the position (default value: 1.0). This is an extra label to show you where your target is on the chart. The target label is represented by a green cross
In addition to the main profit/loss label, the script also displays two auxiliary labels. The "BuyPrice" label presents the buy price of the position as a red cross symbol on the chart, allowing users to easily identify their entry point. The "targetSell" label displays the target sell price as green cross symbol, indicating the desired exit point for the position. These visual markers help users visualize their trading strategy.
The script takes into account that users may only need this information displayed on the last bar, as continuous updates might not be necessary. By checking if the current bar is the last one, the script ensures that the labels are only displayed when relevant.
Limitations
The script assumes that trading is done using the same quantity; which is not always the case. This will change with subsequent updates.

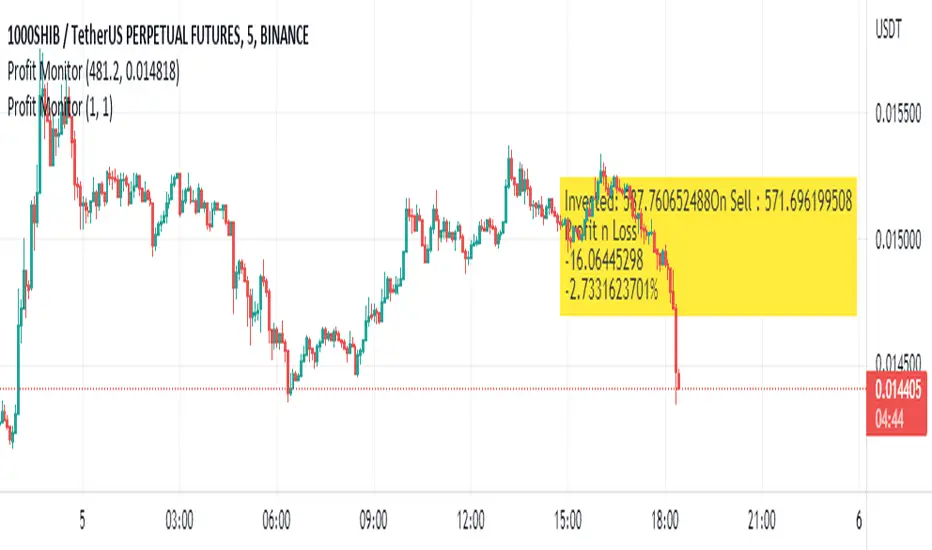
Profit MonitorProfit monitor refers to a tool or system used to track and analyze a company's financial performance, specifically its profitability. This can be in the form of software, spreadsheet, or dashboard that displays key metrics such as revenue, expenses, and net profit over time. The goal of a profit monitor is to give stakeholders, such as business owners, investors, or managers, a clear and up-to-date view of the company's financial health, enabling them to make informed decisions and identify areas for improvement.
BTC Profitable Wallets StrategyBTC Profitable Wallets Strategy - plots the percentage of profitable BTC wallets and places long orders when the profitable wallet share crosses above 50%, historically a very accurate point to catch the next Bull Run early.
The only setting is a smoothing option using the Moving Average method and length of your choice.
On Chain Data is queried from IntoTheBlock.
This is a 'HODL' strategy, with no exit given. If you'd like to see the historical performance check the Open Profit or place a sell order at the current date.

Fixed Percent Stop Loss & Take Profit % - For Study Scripts===========
Fixed Percent Stop Loss & Take Profit % - { FOR STUDY SCRIPTS! }
===========
A neat example of how to set up Fixed Stops and Take Profit as a percent of the entry price - This is for setting Alerts within your own Study Script for when either your SL or TP get hit.
Yup, that's about it!
You can ignore the actual entry/exit orders - they're based on a simple MA cross and are therefore NOT relevant, NOT profitable and NOT recommended!
You should be using this code as a way of adding Stops and Takes to your own scripts - hope it helps!
Set your "Open Long/Short" Alerts to be triggered "Once per Bar Close" - Set your "SL/TP" Alerts to trigger "Once per Bar".
--
We wrote this with a bit of a rush on! ~ If you spot any mistakes/bugs just let us know and we'll get round to them asap!
-----------
Good Luck and Happy Trading!

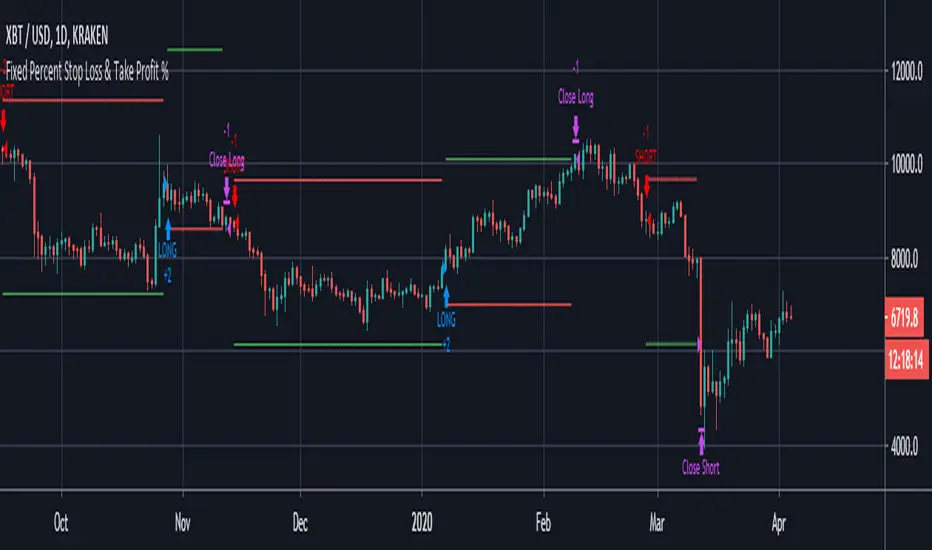
Fixed Percent Stop Loss & Take Profit %===========
Fixed Percent Stop Loss & Take Profit %
===========
A neat example of how to set up Fixed Stops and Take Profit as a percent of the entry price.
Yup, that's about it!
You can ignore the actual entry/exit orders - they're based on a simple MA cross and are therefore NOT relevant, NOT really profitable and NOT recommended!
You should be using this code as a way of adding Stops and Takes to your own scripts - hope it helps!
-----------
Good Luck and Happy Trading!
Altcoin Profitability Tracker 2Ever wonder which altcoins are performing better than Bitcoin? This script plots the profitability of 15 altcoins and BTCUSD so you can quickly determine where to invest your money.
