Profitolio Swing Strategy V1.2Profitolio Swing Strategy V1.2 - User Guide
Overview
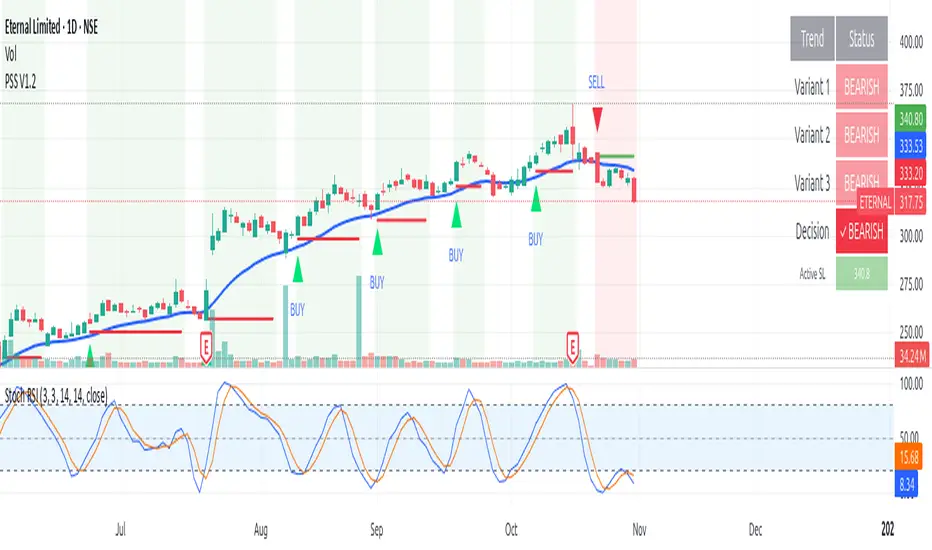
The Profitolio Swing Strategy (PSS V1.2) is a comprehensive swing trading indicator designed to identify high-probability trade setups by combining multiple technical analysis methods. This indicator helps traders capture medium-term price movements while managing risk effectively.
What This Indicator Does
This indicator analyzes market momentum and volatility to generate clear BUY and SELL signals. It uses a confluence approach, meaning signals only appear when multiple conditions align, reducing false signals and improving trade quality.
Key Features
Visual Components
1. Signal Markers
Green Triangle (BUY): Appears below candles when bullish conditions align
Red Triangle (SELL): Appears above candles when bearish conditions align
2. Reference Lines
Blue Line: 21-period Exponential Moving Average (EMA) - shows medium-term trend direction
Orange Circles: Volume Weighted Average Price (VWAP) - represents fair value based on price and volume
3. Stoploss Management
Red Horizontal Line: Active stoploss for long positions (appears after BUY signal)
Green Horizontal Line: Active stoploss for short positions (appears after SELL signal)
"SL HIT!" Label: Appears when price touches the stoploss level
4. Background Color
Light Green: Indicates overall bullish market condition
Light Red: Indicates overall bearish market condition
No Color: Neutral/mixed conditions
5. Dashboard (Top Right)
Shows the status of multiple trend variants and the final decision:
Individual variant status (Variant 1, 2, 3)
Overall decision (BULLISH/BEARISH/NEUTRAL)
Active stoploss value
Parameters Used
ATR-Based Calculations
The indicator uses different Average True Range (ATR) and multipliers which measures market volatility
Lower multipliers: More sensitive, faster signals
Higher multipliers: Less sensitive, more stable signals
Moving Averages
21 EMA: Helps identify the prevailing trend direction. Price above EMA suggests uptrend, below suggests downtrend
VWAP: Acts as dynamic support/resistance. Institutional traders often use this as a reference point
How to Use This Indicator
Step 1: Wait for Signal Confirmation
Do not trade when background is absent (neutral condition)
Look for BUY signal when background turns light green
Look for SELL signal when background turns light red
Step 2: Entry Rules
For Long Positions (BUY):
Wait for green triangle below candle
Confirm price is above the 21 EMA (blue line) for stronger probability
Enter at current market price or next candle open
For Short Positions (SELL):
Wait for red triangle above candle
Confirm price is below the 21 EMA (blue line) for stronger probability
Enter at current market price or next candle open
Step 3: Risk Management
Stoploss Placement:
For BUY trades: The indicator automatically marks a stoploss level (red line) based on recent price action
For SELL trades: The indicator automatically marks a stoploss level (green line) based on recent price action
These levels persist until hit or trend reverses
Exit Strategies:
Stoploss Exit: Exit when price hits the marked stoploss line (you'll see "SL HIT!" label)
Signal Reversal: Exit when opposite signal appears
Background Change: Consider exiting when background color disappears (trend weakening)
Step 4: Additional Confirmation
Use EMA & VWAP for Confluence:
Stronger BUY: When price is above both EMA and VWAP
Stronger SELL: When price is below both EMA and VWAP
Caution: When price is between EMA and VWAP (mixed signals)
Best Practices
✅ DO:
Use on higher timeframes (4H, Daily) for swing trading
Wait for clear signal confirmation
Respect the stoploss levels
Check dashboard for overall market condition
Use on trending markets for best results
❌ DON'T:
Trade during neutral/gray periods
Ignore stoploss levels
Trade against the background color
Use on very short timeframes (1min, 5min) - designed for swing trading
Enter trades when all three variants show mixed signals
Alert Setup
The indicator includes built-in alerts:
"All Bullish": Triggered on BUY signal
"All Bearish": Triggered on SELL signal
"Buy SL Hit": When long stoploss is touched
"Sell SL Hit": When short stoploss is touched
Timeframe Recommendations
Best: Daily, 4-Hour charts
Good: 1-Hour charts
Not Recommended: Below 1-Hour (too many false signals)
Understanding the Dashboard
The dashboard shows a breakdown of the decision-making process:
Variant 1, 2, 3: Individual component analysis
Decision: Final verdict (requires all variants to agree)
Active SL: Current stoploss level for open position
Risk Disclaimer
This indicator is a tool to assist in trading decisions. Always:
Use proper position sizing
Never risk more than 1-2% per trade
Combine with your own analysis
Practice on paper/demo accounts first
Past performance doesn't guarantee future results
Note: This indicator works best in trending markets and may generate fewer signals in ranging/choppy conditions. Patience is key to successful swing trading.
Cerca negli script per "profit"
Profit Hunter - RS Supernova中文說明
狩利 (Profit Hunter) - RS 超新星 是一款專為加密貨幣市場設計的相對強度篩選指標,靈感來自 Mark Minervini 和 William O'Neil 的投資理念。此指標透過「RS 超新星」篩選概念,幫助交易者聚焦在市場中的極端強勢標的,從而更精準地捕捉高潛力的進場機會。
指標用途
RS 評級 (RS Rating):基於相對強度 (Relative Strength) 概念,將標的與整體市場 (TOTAL 指數) 進行比較,得出 RS 評級。當 RS 評級超過 85 時,該標的被視為具有極強的上漲動能,是潛在的進場目標。
高潛力篩選:此指標利用動態加權計算方式,篩選出相對強勢的標的,讓交易者可以聚焦於具有突破潛力的資產。
即時數據顯示:在圖表上即時顯示 RS 評級,提供清晰的數據支持,使交易者快速判斷標的的強度並做出即時決策。
狩利-RS 超新星 專為追求市場主流趨勢的交易者設計,特別適合應用 Minervini 和 O'Neil 理論的投資者。該指標幫助您在市場波動中篩選出最具相對強度的標的,確保每次進場都是基於高潛力的技術分析。
English Description
Profit Hunter - RS Supernova is a relative strength (RS) filtering indicator specifically designed for the cryptocurrency market, inspired by the investment philosophies of Mark Minervini and William O'Neil. Through the concept of the "RS Supernova," this indicator helps traders focus on exceptionally strong assets within the market, enabling precise entry into high-potential opportunities.
Indicator Purpose
RS Rating: Based on Relative Strength (RS) analysis, the indicator compares the asset to the overall market (TOTAL index) to generate an RS Rating. When the RS rating exceeds 85, the asset is considered to have substantial upward momentum, marking it as a potential entry target.
High-Potential Screening: Utilizing a dynamic weighted calculation, this indicator filters out assets with relative strength, allowing traders to concentrate on those with breakout potential.
Real-Time Data Display: The RS Rating is displayed on the chart, providing clear data for quick assessment of asset strength and enabling real-time decision-making.
Profit Hunter - RS Supernova is designed for traders seeking to capture mainstream market trends, especially those following Minervini and O'Neil's theories. This indicator aids in identifying the strongest assets amidst market fluctuations, ensuring each entry is backed by high-potential technical analysis.

ProfitTrailer Example TradingView Signals [v2019-01-31]ProfitTrailer Example TradingView Signal
This script provides an example of a TradingView Signal for use with ProfitTrailer's
new SIGNALS functionality and it's new TradingView integration capability.
This signals script implements a simple Moving Average Cross strategy
that works on any chart timeframe.
It allows you to pick the Price source i.e. Open, Close (default), etc.
You are able to choose between EMA (default) or SMA moving average
calculations.
You can define the fast and slow period lengths for use within the
moving average calculations.
If you get some value out of this indicator please consider making
a small donation to my favourite charity the Save the Childrens Fund.
Every donation will make a difference to the lives of children.
All donations over $2 are tax deductable. You can donate here:
savethechildrenfundraising.org.au
Copyright (c) 2019, Grant Cause aka CryptoCoyns

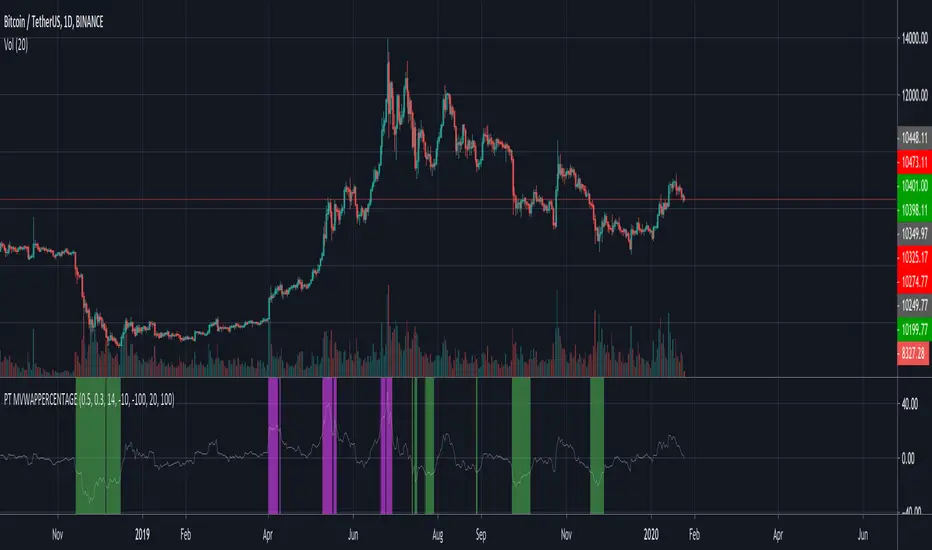
[ProfitTrailer] MVWAPPERCENTAGE Buy/Sell StudyProfitTrailer buy/sell study for MVWAPPERCENTAGE strategy.
The script highlights the region where trailing is most likely to succeed.
[ProfitTrailer] VWAPPERCENTAGE Buy/Sell StudyProfitTrailer buy/sell study for VWAPPERCENTAGE strategy.
The script highlights the region where trailing is most likely to succeed.

[ProfitTrailer] DEMA Spread Buy/Sell StudyProfitTrailer buy/sell study for DEMASPREAD strategy.
The script highlights the region where trailing is most likely to succeed.

[ProfitTrailer] DEMAGAIN Buy/Sell Study (standalone)ProfitTrailer buy/sell study for DEMAGAIN strategy.
The script highlights the region where trailing is most likely to succeed.

[ProfitTrailer] DEMAGAIN Buy/Sell StudyProfitTrailer buy/sell study for DEMAGAIN strategy.
The script highlights the region where trailing is most likely to succeed.

[ProfitTrailer] DEMA Cross Buy/Sell StudyProfitTrailer buy/sell study for DEMACROSS strategy.
The script highlights the region where trailing is most likely to succeed.

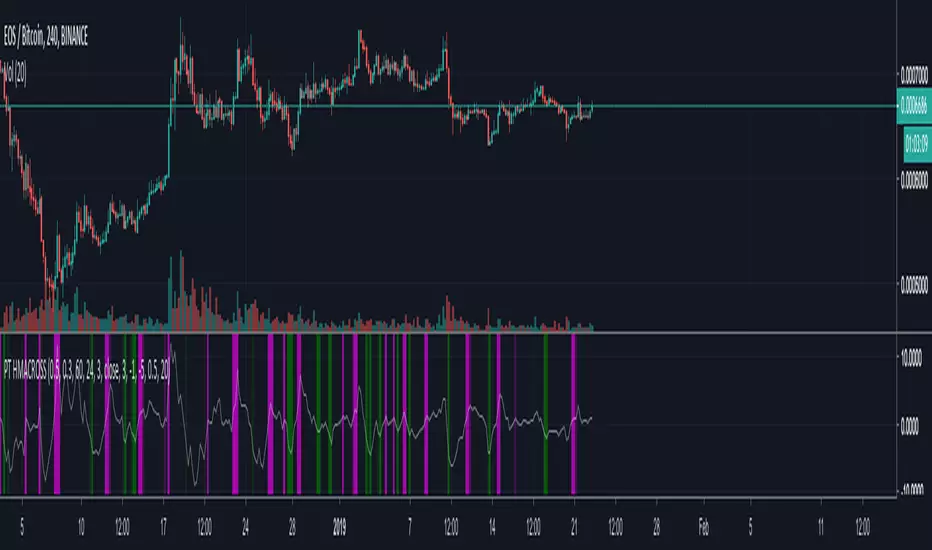
[ProfitTrailer] HMACROSS Buy/Sell StudyProfitTrailer buy/sell study for HMACROSS strategy.
The script highlights the region where trailing is most likely to succeed.
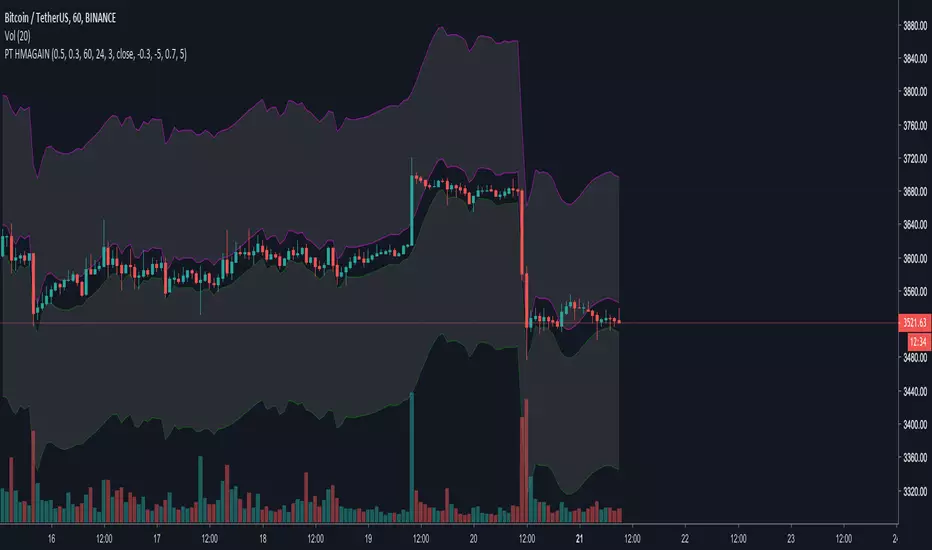
[ProfitTrailer] HMAGAIN Buy/Sell Study (standalone)ProfitTrailer buy/sell study for HMAGAIN strategy (standalone indicator).
The script highlights the region where trailing is most likely to succeed.
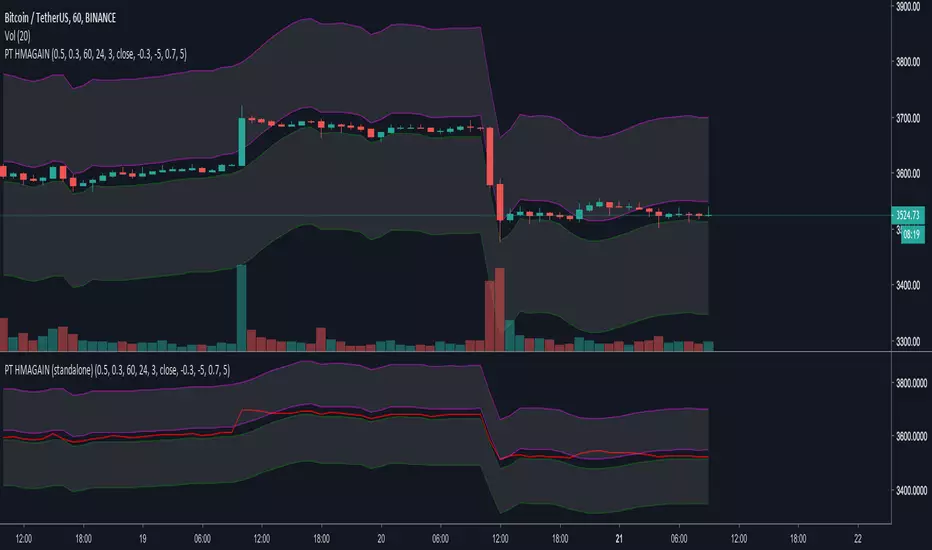
[ProfitTrailer] HMAGAIN Buy/Sell StudyProfitTrailer buy/sell study for HMAGAIN strategy.
The script highlights the region where trailing is most likely to succeed.
[ProfitTrailer] OBV Buy/Sell studyProfitTrailer buy/sell study for OBV strategy.
The script highlights the region where trailing is most likely to succeed.

[ProfitTrailer] SMA Spread Buy/Sell studyProfitTrailer buy/sell study for SMASPREAD strategy.
The script highlights the region where trailing is most likely to succeed.

[ProfitTrailer] EMA Spread Buy/Sell studyProfitTrailer buy/sell study for EMASPREAD strategy.
The script highlights the region where trailing is most likely to succeed.

[ProfitTrailer] EMAGAIN StudyProfitTrailer buy/sell study for EMAGAIN strategy.
The script highlights the region where trailing is most likely to succeed.

[ProfitTrailer] EMAGAIN Study (standalone)ProfitTrailer buy/sell study for EMAGAIN strategy. Plot is shown in a standalone chart.
The script highlights regions where trailing is most likely to succeed.

[ProfitTrailer] SMAGAIN StudyProfitTrailer buy/sell study for SMAGAIN strategy.
The script highlights the regions where trailing is most likely to succeed.

[ProfitTrailer] SMAGAIN Study (standalone)ProfitTrailer buy/sell study for SMAGAIN strategy. Study is plotted in a standalone chart.
The script highlights the regions where trailing is most likely to succeed.

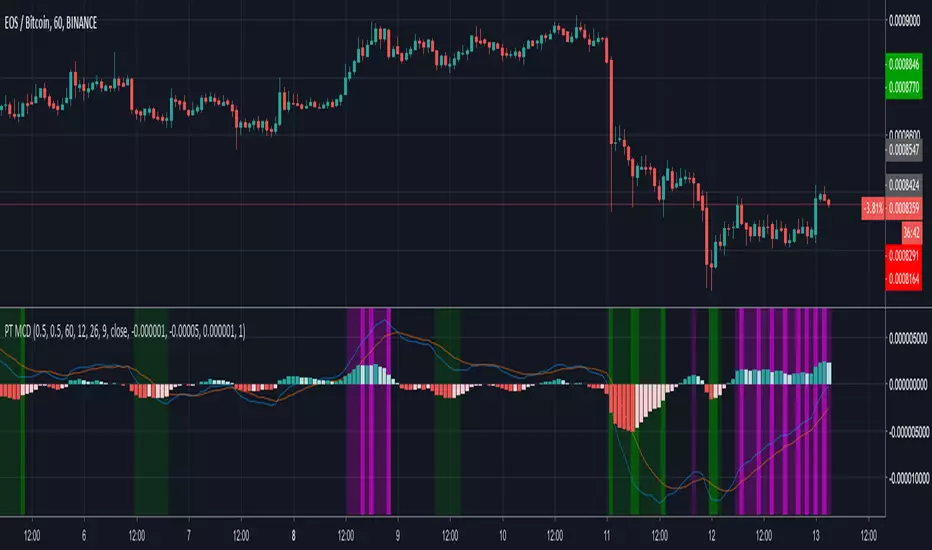
[ProfitTrailer] MACD StudyProfitTrailer buy/sell study for MACD strategy.
The script highlights the region where trailing is most likely to succeed.
[ProfitTrailer] RSI StudyProfitTrailer buy/sell study for RSI strategy.
The script highlights the regions where trailing is most likely to succeed.

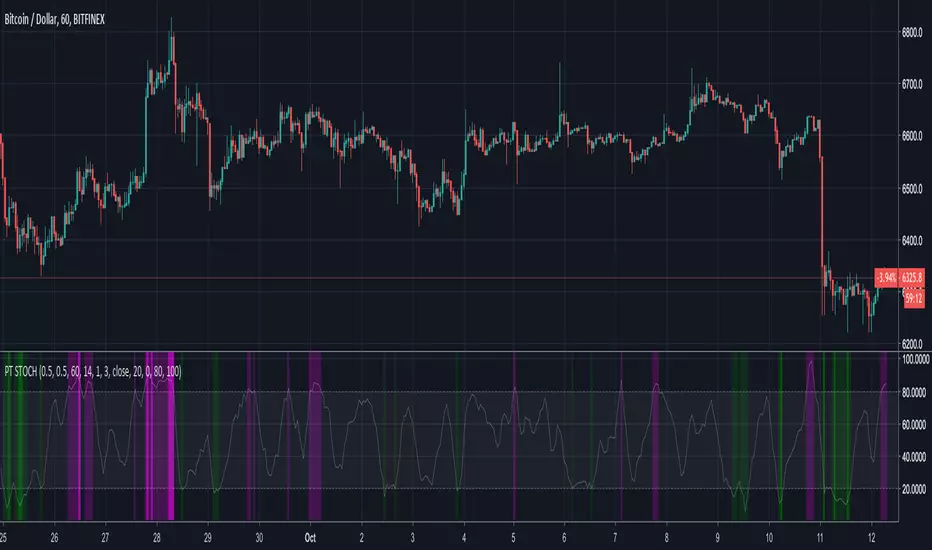
[ProfitTrailer] Stoch StudyProfitTrailer buy/sell study for STOCH strategy.
The script highlights the regions where trailing is most likely to succeed.
[ProfitTrailer] SMA Cross StudyProfitTrailer SMACROSS study for buy/sell strategies.
The script highlights the regions where trailing is most likely to succeed.
