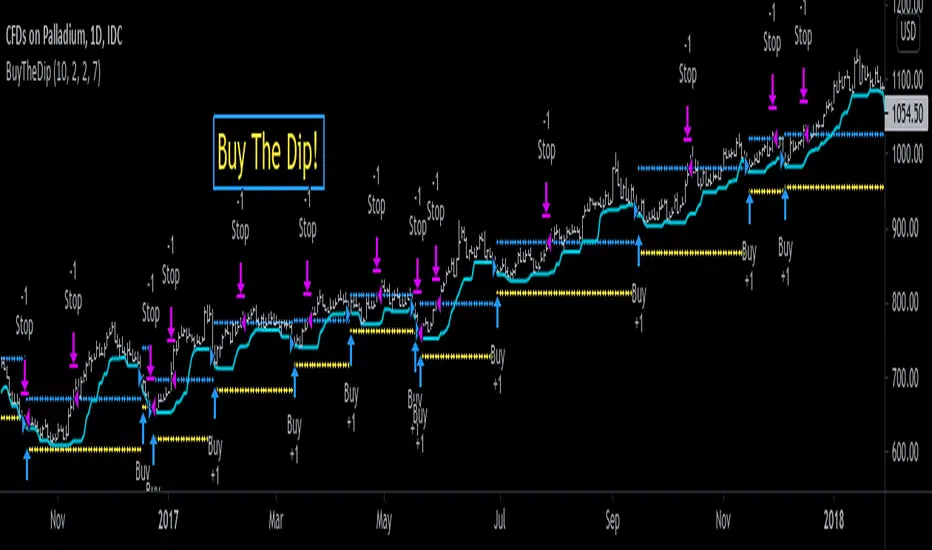
Buying Dip Strategy With Take Profit And Stop Loss [racer8]"Buy low, sell high."
This system buys the dip and takes profit for a high win rate.
It uses an ATR take profit and ATR stop loss.
It buys the dip when the close is below the previous 7 day low.
Daily timeframe is best.
Enjoy ♡
Cerca negli script per "profit"
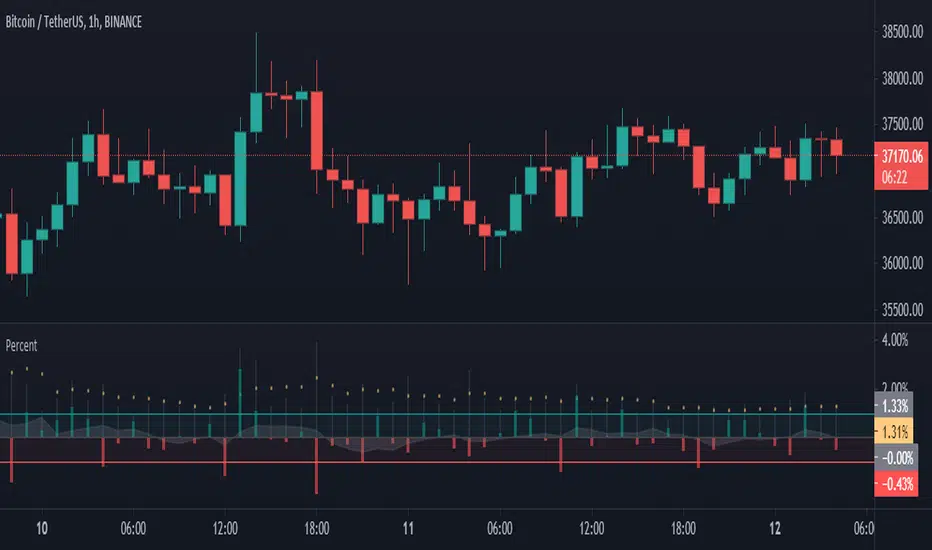
Percentage of Price ProfitThis indicator shows the percentage change in the price per candle, In this way, you will be aware of the amount of profit in the desired time period.
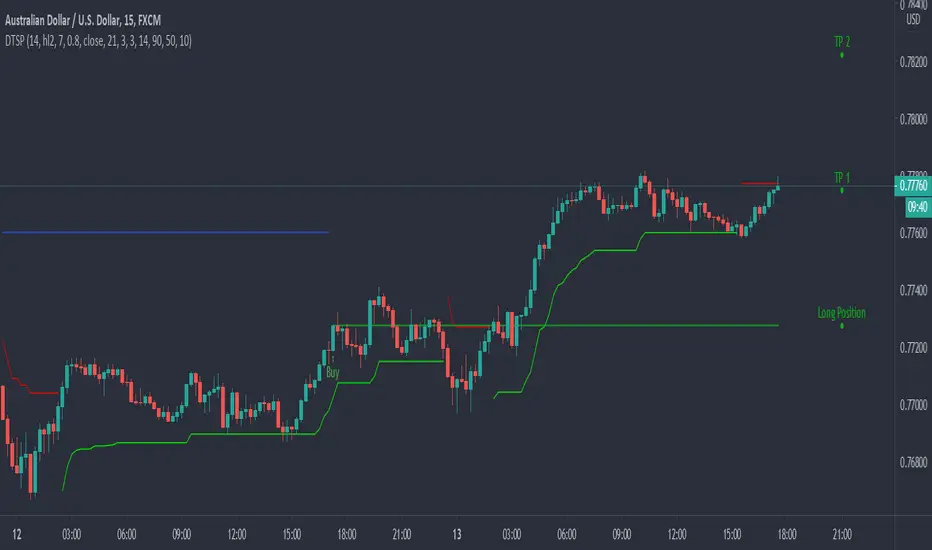
Dynamic Take Profit & Signals (AussieBogan)Dynamic Take Profit & Signals (DTS) help us to dynamically place potential take profit levels. These levels are measured based on standard deviation in conjunction with swing high and low points. Head over to the settings to control your take profit and multiplicative factor setting.
In short, higher values of either setting will return more spread out between tp's. The logic behind using the standard deviation is that a low value of it will return tp closer to where you entered the trade, as such it will have higher chances of the price reaching them.
The Indicator also has alert features for buy and sell so any trader can be aware of every potential signal the indicator produces.
Strategy - Profit Maximizer by PMaxIt is a small modification to the "Profit Maximizer Max" script to make it a strategy by date range.

Buy - Take Profit OR Stop Loss % BasedScript looks back for a certain period of time and than enter when price close above that look back period ema. Once enter it does not care for how many times price cross above or below. Once entered, it will either hit percenatage based take profit of stop loss.

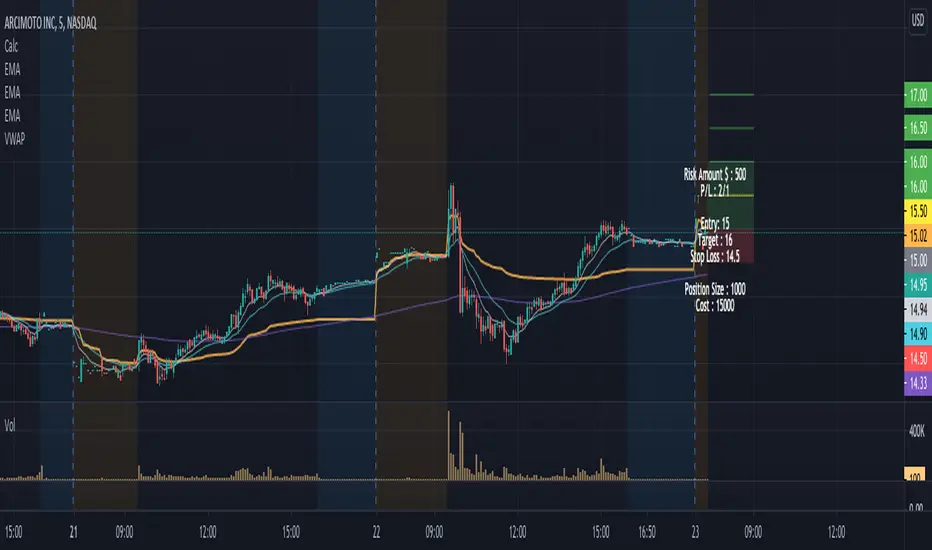
Position Size Calculator w/ profit targetsThis script helps the user visualize profit targets and calculates position size based on the input risk amount.
Input variables:
- Risk amount
- Entry price
- Stop loss amount
- Profit target amount
Calculated variables:
- Profit loss ratio
- Position size
- Postion cost
Plotted variables:
- shaded: entry price --> price target (green filled)
- shaded: entry price --> stop loss target (red filled)
- 1:1 p/l ratio --> yellow line
- 2:1, 3:1, 4:1 p/l ratios --> green lines
Overlay text can be toggled on/off in parameter input section
Bitlinc MARSI Study AST w/ Take Profit & Stop loss - beta 0.1This script is beta 0.1 - will update as soon as the script is tradable
This script is based on AST on a 10 minute timeframe. You can change the asset and the timeframe for any asset you want to trade, but for it to work correct ALL settings have to be testes in the Strategy section of the TradingView. Each assets and timeframe require a different mixture of settings. This is NOT a one settings fits all trading for all assets on any timeframe. Below are the settings and explanation on how it works.
How it fires a buy / sell:
The script will plot an RSI with upper and lower bands in a separate indicator window. The idea behind this script is to fire a LONG when MA crosses OVER lower band and fire a SHORT when the MA crosses under the lower band. Each order that fires is an OCO (Order Cancels Order) for pyramiding.
Settings:
You have full control of these settings as mentioned above, you must configure every part of this script for each asset and timeframe you trade.
- Length of MA
- Length
- Upper bands of RSI
- Lower bands of RSI
- Take profit percentage
- Stop loss percentage
- Month to start and end the strategy (within 2020)
- Day to start and end the strategy (within 2020)
- Quantity type
- Slippage
- Pyramiding
***Remember that after the signal to enter or exit a trade is fired, the alert will trigger AFTER the close of the candle that caused the tigger to fire

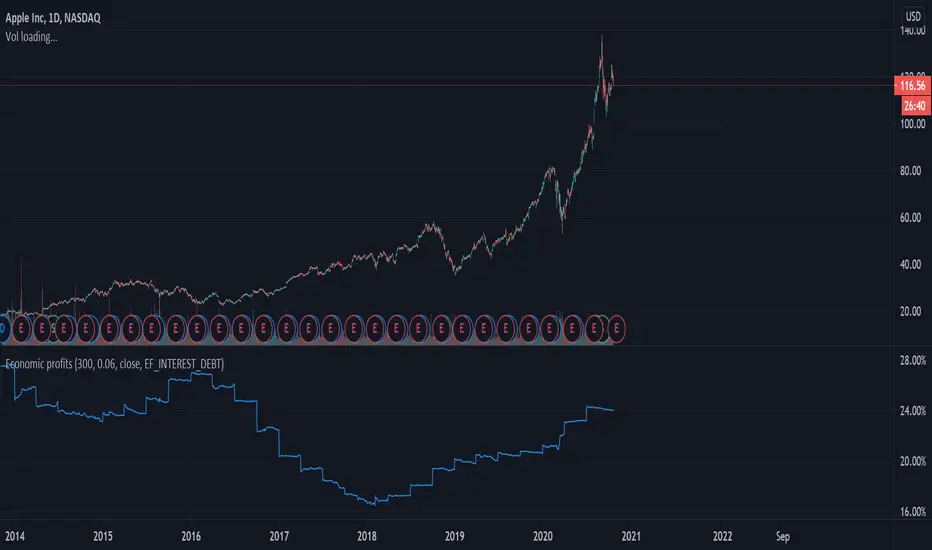
Economic profits (ROIC-WACC)Fundamental Chart
quantifying a competitive advantage
Economic profits (EP) measures the spread between
a firms return on invested capital and weighted average cost of capital.
Companies that have a positive EP means that the firm generates a higher
return then it cost to raise the capital required for investment.
a company that can maintain a an positive excess EP will see its value
increase as growth increases and vice versa.
EP can be used as a quantitative measure, indicating a durable competitive advantage.
best used as a comparable metric within an industry group.
As in most case when analyzing historic fundamentals, consistency is paramount.
as well as future expectations.
notes on code:
- average TTM ROIC TTM
- Coast of equity uses CAPM
- 6% required rate of return (option to change as desired)
- Value of equity, market value
- Value of debt, book value (due to limitations)
- risk free rate, US10Y
1st published scrip, let me know what you think in the comments.
ATR with Take and StopThis simple indicator will plot the take profit and stop loss values based on the ATR indicator.
It's possible to set how many times the ATR value will be applied to the closing price and
what trade type is used, Long or Short.

ATR Take Profit bandsSimple ATR-scaled levels or bands of suggested price to take profit on directional trades.

ATR based Stop and Take-Profit levels in realtime Little tool to quickly identify stops and take-profit levels based on Average True Range. User can change ATR multipiers, as well as the ATR length used. Green and red lines show these levels; plot is visible over last 8 bars only to reduce clutter. Label showing the current ATR, up above the last bar

Expert studio strategy 1 - GBPUSDThis is part of a series of strategies developed automatically by a online software.
I cannot share the site url, which is not related to me in any way, because it is against the TV reules.
This strategy was optimized for GBPUSD, timeframe 1D, fixed lots 0.1, initial balance 1000€.
LOGIC:
- LONG ENTRY when previous candle is bear
- LONG EXIT: RVI > signal line
- SHORT ENTRY when previous candle is bull
- SHORT EXIT: RVI < signal line
NOTE: I considered the open of actual candle instead of close otherwise there will be a back shift of 1 candle in pine script
Take profit = no
Stop loss = no
I have also a study with alarms.
Please use comment section for any feedback.

Scripting Tutorial B - TManyMA - Commission/FeesThis script is for a triple moving average strategy where the user can select from different types of moving averages, price sources, lookback periods and resolutions.
Features:
- 3 Moving Averages with variable MA types, periods, price sources, resolutions and the ability to disable each individually.
- Crossovers are plotted on the chart with detailed information regarding the crossover (Ex: 50 SMA crossed over 200 SMA )
- Forecasting available for all three MAs. MA values are forecasted 5 values out and plotted as if a continuation to the MA.
- Forecast bias also applies to all forecasting. Bias means we can forecast based on an anticipated bullish , bearish or neutral direction in the market.
- To understand bias, please read the source code, or if you can't read the code just send me a message on here or Twitter . Twitter should be linked to my profile.
- Ribbons added and on by default. Optional setting to disable the ribbons. 5 ribbons between MA1 and MA2 and another 5 between MA2 and MA3.
- Ribbons are alpha-color coded based on their relation to their default MAs.
- Ribbons are only visible between MAs if the MAs being compared share the same Type, Resolution, and Source because there is no way to consolidate those three in a simple manner.
- Ribbon values are calculated based on calculated MA Periods between the MAs.
- Converted the existing study into a strategy.
- Strategy only enters long positions with a market order when MA crossovers occur.
- Strategy exits positions when crossunders occur.
- Trades 100% of the equity with one order/position by default.
- Ability to disable trading certain crosses with input checks.
- Ability to exit trades with a take profit or stop loss.
- User input to allow quick changes to the take profit or stop loss percentages.
- Strategy now calculates on every tick
- Strategy also includes fixed commission values based on Coinbase standard order fees
This script is meant as an educational script with well-formatted styling, and references for specific functions.
*** PLEASE NOTE - THIS STRATEGY IS MEANT FOR LEARNING PURPOSES. DEPENDING ON IT'S CONFIGURATION IT MAY OR MAY NOT BE USEFUL FOR ACTUAL TRADING. THE STRATEGY IS NOT FINANCIAL ADVICE ***

Scripting Tutorial A - TManyMA - StopsThis script is for a triple moving average strategy where the user can select from different types of moving averages, price sources, lookback periods and resolutions.
Features:
- 3 Moving Averages with variable MA types, periods, price sources, resolutions and the ability to disable each individually.
- Crossovers are plotted on the chart with detailed information regarding the crossover (Ex: 50 SMA crossed over 200 SMA )
- Forecasting available for all three MAs. MA values are forecasted 5 values out and plotted as if a continuation to the MA.
- Forecast bias also applies to all forecasting. Bias means we can forecast based on an anticipated bullish, bearish or neutral direction in the market.
- To understand bias, please read the source code, or if you can't read the code just send me a message on here or Twitter. Twitter should be linked to my profile.
- Ribbons added and on by default. Optional setting to disable the ribbons. 5 ribbons between MA1 and MA2 and another 5 between MA2 and MA3.
- Ribbons are alpha-color coded based on their relation to their default MAs.
- Ribbons are only visible between MAs if the MAs being compared share the same Type, Resolution, and Source because there is no way to consolidate those three in a simple manner.
- Ribbon values are calculated based on calculated MA Periods between the MAs.
- Converted the existing study into a strategy.
- Strategy only enters long positions with a market order when MA crossovers occur.
- Strategy exits positions when crossunders occur.
- Trades 100% of the equity with one order/position by default.
- Ability to disable trading certain crosses with input checks.
- Ability to exit trades with a take profit or stop loss.
- User input to allow quick changes to the take profit or stop loss percentages.
This script is meant as an educational script with well-formatted styling, and references for specific functions.
*** PLEASE NOTE - THIS STRATEGY IS MEANT FOR LEARNING PURPOSES. DEPENDING ON IT'S CONFIGURATION IT MAY OR MAY NOT BE USEFUL FOR ACTUAL TRADING. THE STRATEGY IS NOT FINANCIAL ADVICE ***

Extreme ScalpingThis is a test of an easy scalping method: buy if actual close is below forecast close and sell if actual close is above forecast close. Take profit and stop loss shall be very small (few pips) as in most of scalping strategies.
No filter is used for only long or only short positions, but you can select buy only or sell only based on other indicators or whatever you feel is the direction of trading.
NOTE: you can add this strategy to your chart but you should modify the backtest day otherwise you will get an error due to calculation limits of pine script. For example, on one minute chart, you should set the backtest day from today only. For past days, set both start day and and day.
I have also a study with alarms.
Please use comment section for any feedback.


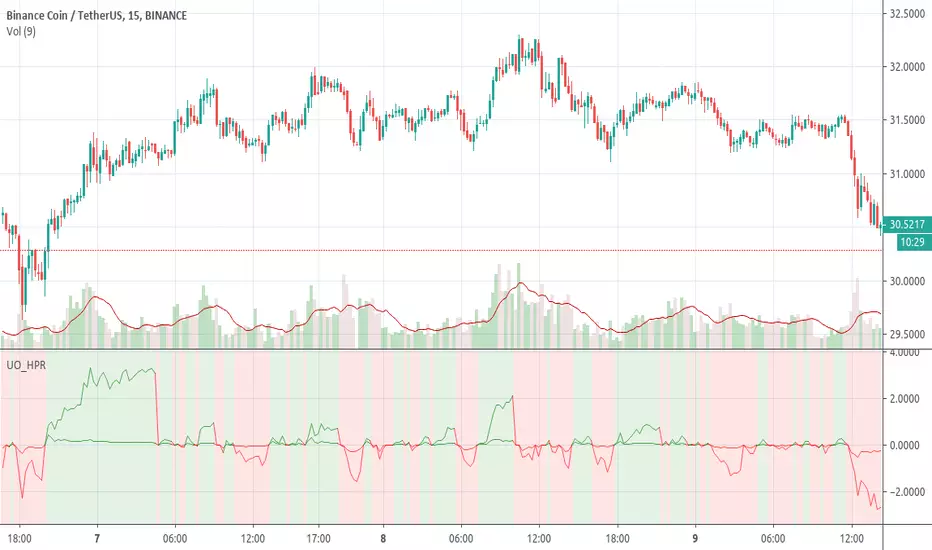
High Profit RunIdentify regions of high profit runs. Long or short. The line shows the profit percent in the current run.
Those might be the places that it is wise to take a profit instead of waiting longer.
Or a reverse counter reaction could be expected.
ATR based Pivots mcbwHey everyone this is an exciting new script I have prepared for you.
I was reading an old forex bulletin article some time ago when I came across this: solar.murty.net (or you can download the full bulletin with lots of other good articles here: www.forexfactory.com).
You can already buy this for metatrader (www.mql5.com) so I figured to make it for free for tradingview.
This bulletin suggested that you can reasonably predict daily volatility by adding or subtracting multiples of the daily ATR to the daily opening. Using this you can choose multiples to use as price targets and alternatively as stop losses. For example, if you already have a sense of market direction you can buy at market open place a stop loss at - 1 daily ATR and a profit target at + 3 ATRs for a risk to reward ratio of 3. If you are looking for smaller/quicker moves with a ratio of 3 you can have a stop loss at -0.25 ATR and a take profit at +0.75 ATR.
Alternatively this article also suggests to use this method to catch volatility breakouts. If price is higher than the + 1 ATR area then you can safely assume it will be going to the +2 ATR area so you can put a buy stop at + 1 ATR with a profit target at + 2 ATR with a stop loss at +0.5 ATR to catch a volatility breakout with a risk to reward ratio of 2!
Even further there are methods that you can use with ATRs of multiple window sizes, for example by opening two copies of this indicator and measuring recent volatility with a 1 week window and long term volatility within a 1 month window. If the short term volatility is crossing the long term volatility then there is a high probability chance that even more price movement will occur.
However I have found that this method is good for more than daily volatility , it can also be used to measure weekly volatility , and monthly volatility and use these multiples as good long term price targets.
To select if you want daily, weekly, or monthly values of the ATR of volatility you're using go to the settings and click on the options in the "Opening period". The default window of the ATR here is 14 periods, but you can change this if you want to in "ATR period". Most importantly you are able to select which multiples of the ATR you would like to use in the settings in "ATR multiple 1" which is the green line, "ATR multiple 2" which is the blue line, and "ATR multiple 3" which is the purple line. You can select any values you want to put in these, the choice of 0.25, 0.5, and 1 is not special, some people use fibonacci numbers here or simply 0.33, 0.66, and 0.99.
Repainting issue: This script uses the daily value of the Average True Range (ATR), which measures the volatility that is happening today. If price becomes more volatile then the value of the ATR can increase throughout the day, but it can never decrease. What this means is that the ATR based pivots are able to expand away from the opening price, which should not affect the trades that you take based on these areas. If you base your take profit on one of these ATR multiples and the daily volatility increase this means that your take profit area will be closer to your entry than the ATR multiple. Meaning that your trades will be more conservative.
While this all may sound very technical it is super intuitive, throw this on your chart and play around with it :)
Happy trading!

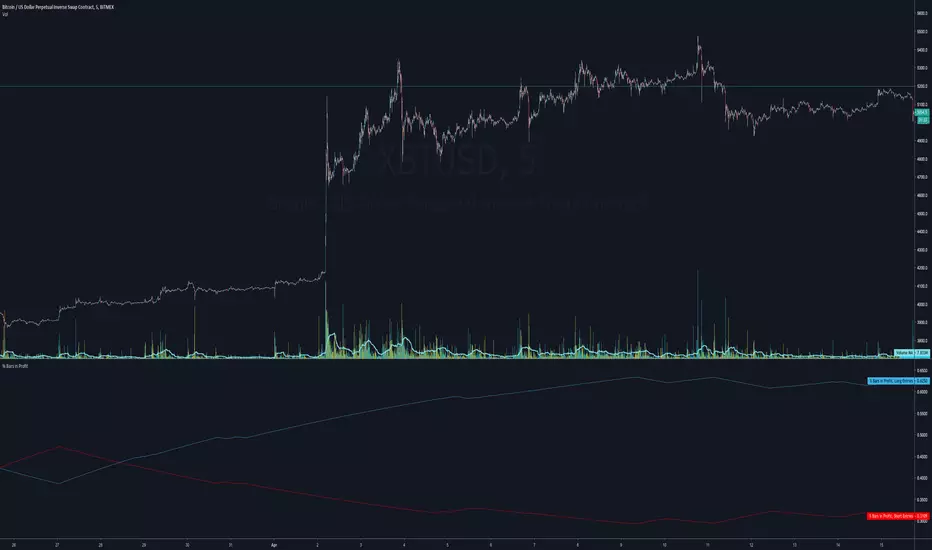
% Bars in ProfitUse this to determine how often your average entry price for shorts and longs over the last 11 trades are in profit or not.
Simple Stock StrategyThis is a simple and easy to use strategy for low-volatility stocks. It prints a BUY or SELL signal to alert you that certain conditions have been met. I use it as a time saver to help identify which charts I need to look at. You can adjust the inputs and properties to suit your needs. I would suggest allowing two or three orders.
BUY Signals
MACD Above 0
SMA Cross
Big Green Candles
SELL Signals
Profit Target %
Stop Loss %

Volatile Stocks - Simple Strategy w/Profit and StopThis strategy is based off of a script I wrote for another highly volatile asset, cryptocurrencies. It prints BUY and SELL signals based off of inputs that you can specify. I used this script as a time saver. If there is no signal on the chart, I'm less interested in analyzing it.
BUY SIGNALS
Bullish EMA Cross
Positive MACD Cross
Single-candle gains
SELL SIGNALS
Profit %
Stop Loss %
Naturally, I don't trade based off of the BUY and SELL signals alone, but it does help me identify the most important charts to look at.

Simple Alt Coin Strategy - EMA and MACD w/Profit and StopThis script prints BUY and SELL signals based on settings you input. I use it to save time while scrolling through charts deciding what alts I want to look at.
BUY SIGNALS
Positive EMA Crossover
Positive MACD Crossover
Single Candle Gains
SELL SIGNALS
Profit Capture
Stop Loss
I don't trade based just on the BUY or SELL from this strategy, but I have found that these indicators do very well well looking at the large cap alt coins. It backtests well.
Default Settings EMA 5/12/50, MACD 9/12/26, Single Candle Gain 10%, Stop 10%, Profit Capture 45%

DEMARSIV1 alerts and take profitThis version is the same as DEMARSI with following differences
I add take profit to short and long when DEMA MTF 1 is crossing DEMA MTF 2 (they are calculated different that why when you increase int2 in min to longer time the difference between them increse)
if you want the TP to be on signal of fast and slow DEMA RSI 2 (just change the code inside) by putting the long cond to be as the buy cond
for any questions please ask
