Eze Profit - VWAP + MACD Combined SignalThe Eze Profit - VWAP + MACD Combined Signal is an advanced trading tool designed to help traders align price trends with momentum confirmation for better decision-making. By combining Volume-Weighted Average Price (VWAP) and Moving Average Convergence Divergence (MACD), this indicator provides clear entry and exit signals, allowing traders to follow trends and take advantage of momentum shifts.
How It Works:
VWAP:
VWAP represents the average price of an asset, weighted by volume, over a specific period.
It acts as a dynamic support/resistance level and trend filter. Price above VWAP indicates bullish conditions, while price below VWAP suggests bearish conditions.
MACD:
MACD measures momentum through the difference between fast and slow exponential moving averages (EMAs).
Signals are generated when the MACD line crosses its signal line:
Bullish Crossover: Indicates increasing upward momentum.
Bearish Crossunder: Indicates increasing downward momentum.
Combined Logic:
Long Signal: Triggered when price is above VWAP, and MACD exhibits a bullish crossover.
Short Signal: Triggered when price is below VWAP, and MACD exhibits a bearish crossunder.
The script tracks the trader's "in-position" state to prevent redundant signals and ensure clarity.
How to Use:
Use this script to identify potential long and short trading opportunities:
Buy Signal: Enter a long position when the price moves above VWAP and MACD confirms bullish momentum.
Sell Signal: Exit or short when the price drops below VWAP and MACD confirms bearish momentum.
Combine with additional tools like support/resistance, volume analysis, or candlestick patterns for confirmation.
Features:
VWAP Trend Filter: Dynamically adjusts to the trading session to identify overall trend direction.
MACD Momentum Confirmation: Detects key momentum shifts with configurable settings for fast, slow, and signal lengths.
Position State Tracking: Avoids signal redundancy by monitoring open positions.
Buy/Sell Visualizations: Plots Buy/Sell signals directly on the chart for ease of use.
Alerts: Notifies traders in real-time when a long or short signal is triggered.
Customizable Settings:
MACD Fast Length, Slow Length, and Signal Smoothing parameters.
VWAP timeframe resolution to adapt to different trading styles (e.g., intraday or daily).
Credits:
This script is based on standard VWAP and MACD calculations provided by TradingView’s library and has been enhanced with unique logic for combined signal generation.
Notes:
This indicator is intended for educational purposes and should not be considered financial advice. Use it as part of a broader trading strategy alongside other tools for optimal results.
Cerca negli script per "profit"

Partial Profit Calculator [TFO]This indicator was built to help calculate the outcome of trades that utilize multiple profit targets and/or multiple entries.
In its simplest form, we can have a single entry and a single profit target. As shown below in this long trade example, the indicator will draw risk and reward boxes (red and green, respectively) with several annotations. On the left-hand side, all entries will be displayed (in this case there is only one entry, "E1"). On the bottom, the "SL" label indicates the trade's stop loss placement. On the top, all target prices are displayed (in this case there is only one target, "TP1"). Lastly, on the right-hand side a label will display the total R that is to be expected from a winning trade, where R is one's unit of risk.
In the following example, we have two target prices - one at 18600 and one at 18700. You can input as many target prices as you'd like, separated by commas, i.e. "18600,18700" in this example. Make sure the values are separated by commas only, and not spaces, new lines, etc. As a result, we can see that the indicator draws where our profit targets would be with respect to our entry, E1. The indicator assumes that equal parts of the trade position are taken off at each target price. In this example on Nasdaq futures (NQ1!), since we have 2 target prices, this would be equivalent to assuming that we take exactly half the trade position off at TP1, and the remaining half of the position at TP2.
If we wanted to take more of the position off at a certain target, we could simply duplicate the target price. Here I set the target prices to "18600,18600,18700" to enforce that two thirds of the position be taken off at TP1 and TP2, while the remaining third gets taken off at TP3.
We can also show outcome annotations to describe how much R is generated from each possible trade outcome. Using the below chart as an example, the stop loss indicates a -1R loss. The total R from this trade criteria is 1.33 R, and each target price shows how much R is being generated if one were to take off an equal part of the position at said target prices. In this case, we would generate 0.17 R from taking one third of the position off at TP1, another 0.5 R from taking one third of the position off at TP2, and another 0.67 R from taking the remaining one third of the position off at TP3, all adding up to the total R indicated on the right-hand side label.
Using multiple entries works the same way as using multiple target prices, where the input should indicate each entry price separated by commas. In this example I've used "18550,18450" to achieve an average price of 18500, as indicated by the "E_avg" label that appears when more than one entry price is utilized. We can also opt to display risk as dollars instead of R values, where you can input your desired risk per trade, and all values are shown as dollar amounts instead of R multiples, as shown below with a risk per trade of $100.
This is meant to be an educational tool for trades that utilize multiple profit targets and/or entries. Hope you like it!

Volatility Adjusted Profit Target
In my 'Volatility Adjusted Profit Target' indicator, I've crafted a dynamic tool for calculating target profit percentages suitable for both long and short trading strategies. It evaluates the highest and lowest prices over the anticipated duration of your trade, establishing a profit target that shifts with market volatility. As volatility increases, the potential for profit follows, with the target percentage rising accordingly; conversely, it declines with decreasing volatility. As a trader, setting an optimal Take Profit level has always been a challenge. This indicator not only helps in determining that level but also dynamically adjusts it throughout the trade's duration, providing a strategic edge in volatile markets.

ATR profit and loss linesWhat is ATR?
Taking a candlestick, the following 3 transactions are calculated:
1-The difference between the high of the day and the low of the day
2-The difference between today's high and yesterday's close
3-The difference between today's low and yesterday's close
Atr takes the average of these 14-day candlesticks after making their calculations and it predicts how high or low a candle can go and these give us support and resistance helps with points
If you have noticed a rise in your chart and have no idea how high it will go, you can use Atr profit and loss lines.
The red zone is the stop point, the blue zones are the snow zones.
Must be used with macd. macd is validator.
There is an increase in your chart, you opened the atr profit and loss lines upwards and if macd gives you an increase, it is recommended that you enter the trade at that time. It is recommended to increase your loss line 1 step in the direction of profit every 2 profit breaks on atr profit and loss lines.
ATR Nedir?
Bir mum barı ele alınarak şu 3 işlem hesaplanır:
1-Günün yükseği ile günün düşüğü farkı
2-Günün yükseği ile dünün kapanışının farkı
3-Günün düşüğü ile dünkü kapanışın farkı
ATR ise 14 günlük bu mum barlarının hesaplarını yaptıktan sonra ortalamasını alır ve bir mumum ne kadar yükselip düşebileceği konusunda tahmin verir ve bunlar bize destek ve direnç noktaları konusunda yardımcı olur
Eğer grafiğinizde bir yükseliş farketmişseniz ne kadar yükseleceği konusunda fikriniz yoksa Atr kar zarar çizgilerini kullanabilirsiniz.
Kırmızı bölge durdurma noktası,mavi bölgeler kar bölgeleridir.
Macd ile birlikte kullanılmalıdır.macd doğrulayıcıdır.
Grafiğinizde yükseliş var,atr kar zarar çizgilerini yukarı yönlü açtınız ve macd size yükseliş veriyorsa işte o sırada işleme girmeniz tavsiye edilir.atr kar zarar çizgilerinde her 2 kar kırılımında bir zarar çizginizi kar yönünde 1 kademe arttırmanız önerilir

Manual PnL (Profit and Loss) % Tracker - spot long only
This is a manual profit and loss tracker. It takes the user's manual input of total cost and quantity, and then outputs a table on the bottom right of the chart showing the profit or loss %, average purchase price, gross profit or loss, and market value.
Instructions:
1. Double click the indicator title at the top left of the chart
2. Select the "Inputs" tab and click the empty field next to "Symbol" to enter the traded symbol+exchange. This entry MUST be the same as the chart you are on, for example BTCUSDT/BINANCE (indicator will not display otherwise)
3. Enter the Total Cost and Qty of shares/coins owned
4. Optional - change positive or negative colors
5. Optional - under the "Style" tab, change the color of the average price (AVG) line
Note that for the average price (AVG) line to be shown/hidden you must enable/disable "Indicator and financials labels" in the scales settings.
For crypto or other tickers that have prices in many decimal places I would suggest, for the sake of accuracy, adjusting the decimal places in the code so that for prices under $1 you will display more info.
For example let's say you purchase x number of crypto at a price of 0.031558 you should change the code displaying "0.00" on line 44 to "0.000000"
This will ensure that the output table and plotted line will calculate an average price with the same number of decimals.

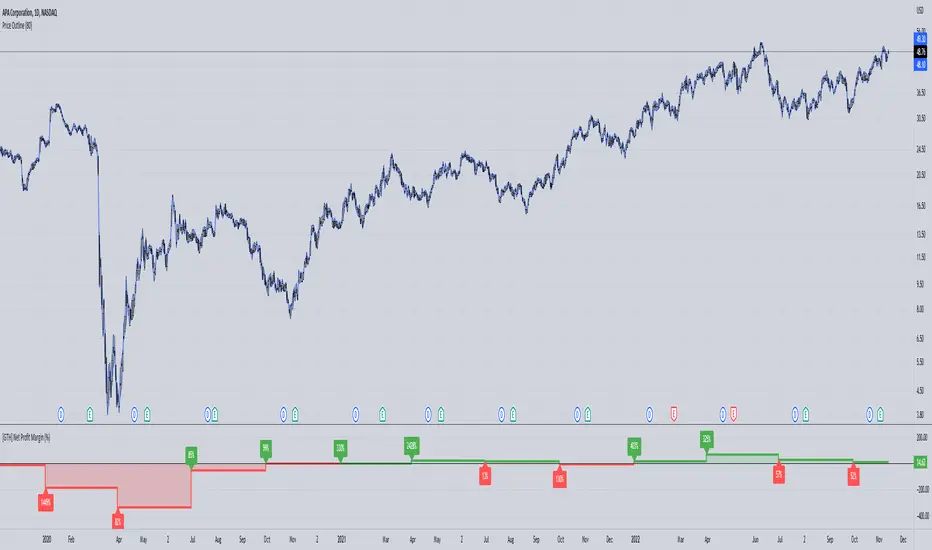
[GTH] Net Profit Margin (%)Displays the Net Profit Margin in a more "readable" fashion than the built-in TV Indicator.
This indicator concludes the series of 'Minervini-indicators', consisting of "GTH Earnings", "GTH Revenues" and "GTH Net Profit Margin (%)".
Famous trader Mark Minervini repeately describes rising earnings, revenues and net profit margin as the most important financials for finding superperformers.
In case of reporting a malfunction: Please be specific. Statements like "does not work" are useless. Thanks.
Artharjan Profit & Loss CalculatorHi,
Artharjan Profit and Loss Calculator allows users to calculate Profit and Loss of their trades and see it on the chart itself
Users are supposed to select either Long or Short, Enter quantity and enter traded price. The live P&L will be plotted on the chart.
Happy trading :-)
Rahul

Indicator - ATR Profit Loss - DGHi Traders,
This is an on chart indicator that can be used for setting take profit and stop losses very easily using the Average True Range Indicator (ATR). Using a volatility adjusted TP and SL will allow you to set your targets and losses based on market conditions. In the settings, you are able to adjust how much of a multiplier you require depending on your risk tolerance and strategy. For those that follow the NNFX method, the defult settings are preset to 1xATR TP and 1.5xATR SL.
How to use:
- For longs, 'isLong' box must be ticked, for shorts, this box is unticked
- For longs, green line is TP, red line is SL
- For shorts, red line is TP, green line is SL
Regards,
Dillon Grech

Enhanced RSI KDE | Advanced FiltersThis is an enhanced version of the excellent RSI (Kernel Optimized) indicator originally created by @fluxchart. Full credit goes to fluxchart for the innovative KDE (Kernel Density Estimation) concept and the solid foundation that made this enhancement possible.
🙏 CREDITS & ACKNOWLEDGMENTS
Original Creator: @fluxchart - RSI (Kernel Optimized)
Original Concept: Kernel Density Estimation applied to RSI pivot analysis
Enhancement: Advanced filtering system and signal optimization- profitgang
License: Mozilla Public License 2.0
🚀 WHAT'S NEW IN THIS ENHANCED VERSION
Building upon fluxchart's brilliant KDE RSI foundation, this version adds:
🔥 Advanced Filtering System:
Multi-Timeframe Confluence - Confirms signals across higher timeframes
Volume Confirmation - Only signals on above-average volume
Volatility Range Filter - Avoids signals in choppy or extreme conditions
Trend Context Analysis - Considers overall market direction
Adaptive Pivot Detection - Adjusts sensitivity based on market volatility
🎯 Signal Quality Improvements:
Confluence Scoring - Each signal gets a quality score (1-6)
Label Cooldown System - Prevents chart clutter with smart spacing
Higher Activation Thresholds - More selective signal generation
Risk Management Integration - Auto stop-loss and take-profit levels
📊 Enhanced Dashboard:
Real-time filter status monitoring
KDE probability percentages
Confluence scores for both directions
Volume and volatility readings
⚙️ HOW IT WORKS
The indicator maintains fluxchart's core KDE methodology:
Collects RSI values at historical pivot points
Creates probability density functions using Gaussian/Uniform/Sigmoid kernels
Identifies high-probability zones for potential reversals
NEW: Multiple filters must align before generating signals, dramatically reducing false positives while maintaining the accuracy of high-probability setups.
🎛️ RECOMMENDED SETTINGS
Confluence Score: 5/6 (very selective)
Activation Threshold: Medium or High
Multi-Timeframe: Enabled with 2/2 alignment
Volume Filter: Enabled (1.5x threshold)
All other filters: Enabled for maximum quality
📈 BEST USE CASES
Swing Trading - Higher timeframe confirmation reduces whipsaws
Quality over Quantity - Fewer but much higher probability signals
Risk Management - Built-in stop/target levels for each signal
Multi-Asset Analysis - Works on stocks, crypto, forex, commodities
⚠️ IMPORTANT NOTES
This is a quality-focused indicator - expect fewer but better signals
Backtest thoroughly on your specific assets and timeframes
The original fluxchart indicator remains excellent for different trading styles
Consider this an alternative approach, not a replacement
🤝 COLLABORATION & FEEDBACK
Special thanks to @fluxchart for creating the original innovative KDE RSI concept. This enhancement wouldn't exist without that solid foundation.
Feel free to suggest improvements or share your results! The goal is to build upon great work in the community.

Floor and Roof Indicator with SignalsFloor and Roof Indicator with Trading Signals
A comprehensive support and resistance indicator that identifies premium and discount zones with automated signal generation.
Key Features:
Dynamic Support/Resistance Zones: Calculates floor (support) and roof (resistance) levels using price action and volatility
Premium/Discount Zone Identification: Highlights areas where price may find resistance or support
Customizable Signal Frequency: Control how often signals are displayed (every Nth occurrence)
Visual Signal Table: Optional table showing the last 5 long and short signal prices
Multiple Timeframe Compatibility: Works across all timeframes
Technical Details:
Uses ATR-based calculations for dynamic zone width adjustment
Combines Bollinger Bands with highest/lowest price analysis
Smoothing options for cleaner signal generation
Fully customizable colors and display options
How to Use:
Floor Zones (Blue): Potential support areas where long positions may be considered
Roof Zones (Pink): Potential resistance areas where short positions may be considered
Signal Crosses: Visual markers when price interacts with key levels
Signal Table: Track recent signal prices for analysis
Settings:
Length: Period for calculations (default: 200)
Smooth: Smoothing factor for cleaner signals
Zone Width: Adjust the thickness of support/resistance zones
Signal Frequency: Control signal display frequency
Visual Options: Customize colors and table position
Alerts Available:
Long signal alerts when price touches discount zones
Short signal alerts when price reaches premium zones
Educational Purpose: This indicator is designed to help traders identify potential support and resistance areas. Always combine with proper risk management and additional analysis.
This description focuses on the technical aspects and educational value while avoiding any language that could be interpreted as financial advice or guaranteed profits.

Dynamic TestingInput Parameters
`lookbackPeriod` : Number of candles to check for determining the highest high (resistance) and lowest low (support) levels.
`atrPeriod` : The period for calculating the Average True Range (ATR), a measure of market volatility.
`atrMultiplierSL` : Multiplier to calculate the stop-loss distance relative to the ATR.
`atrMultiplierTP1` and `atrMultiplierTP2` : Multipliers to calculate two take-profit levels relative to ATR.
`rewardToRisk` : The ratio between reward (profit) and risk (stop loss) for trade management.
---
Core Calculations
ATR (Average True Range)
atr = ta.atr(atrPeriod)
ATR is computed using the specified period to gauge price volatility.
Volume SMA
volumeSMA = ta.sma(volume, atrPeriod)
The script calculates the simple moving average of volume over the same period as ATR. This is used as a threshold for validating high-volume scenarios.
---
Support and Resistance Levels
`support` : Lowest price over the last `lookbackPeriod` candles.
`resistance` : Highest price over the same period.
`supportBuffer` and `resistanceBuffer` : These are "buffered" zones around support and resistance, calculated using half of the ATR to prevent false breakouts.
---
Entry Scenarios
Bullish Entry (`isBullishEntry`)
The close is above the buffered support level.
The low of the current candle touches or breaks below the support level.
The trading volume is greater than the `volumeSMA`.
Bearish Entry (`isBearishEntry`)
The close is below the buffered resistance level.
The high of the current candle touches or exceeds the resistance level.
The trading volume is greater than the `volumeSMA`.
---
Box Visualization
Bullish and Bearish Boxes
Bullish Box (`bullishBox`):
- A green, semi-transparent rectangle around the support level to highlight the bullish entry zone.
- Dynamically updates based on recent price action.
Bearish Box (`bearishBox`):
- A red, semi-transparent rectangle around the resistance level to highlight the bearish entry zone.
- Adjusts similarly as price evolves.
---
Stop Loss and Take Profit Calculations
Bullish Trades
Stop Loss (`bullishSL`): Calculated as support - atrMultiplierSL * ATR .
Take Profit 1 (`bullishTP1`): support + rewardToRisk * atrMultiplierTP1 * ATR .
Take Profit 2 (`bullishTP2`): support + rewardToRisk * atrMultiplierTP2 * ATR .
Bearish Trades
Stop Loss (`bearishSL`): resistance + atrMultiplierSL * ATR .
Take Profit 1 (`bearishTP1`): resistance - rewardToRisk * atrMultiplierTP1 * ATR .
Take Profit 2 (`bearishTP2`): resistance - rewardToRisk * atrMultiplierTP2 * ATR .
---
Visualization for Key Levels
Bullish Scenario
Green lines represent `bullishTP1` and `bullishTP2` for profit targets.
A red line indicates the `bullishSL` .
Labels like "TP1," "TP2," and "SL" dynamically appear at respective levels to make the targets and risk visually clear.
Bearish Scenario
Red lines represent `bearishTP1` and `bearishTP2` .
A green line marks the `bearishSL` .
Similar dynamic labeling for `TP1` , `TP2` , and `SL` at corresponding bearish levels.
---
Dynamic Updates
Both the entry boxes and key level visualizations (lines and labels) adjust dynamically based on real-time price and volume data.
---
Purpose
Identify high-probability bullish and bearish trade setups.
Define clear entry zones (using boxes) and exit levels (TP1, TP2, SL).
Incorporate volatility (via ATR) and volume into decision-making.
---
Technical Summary
Dynamically visualize support/resistance levels.
Set risk-managed trades using ATR-based stop-loss and profit levels.
Automate visual trade zones for enhanced chart clarity.
---

DMI MTF Color Table v5DMI Multi-Timeframe Color Table v5
A comprehensive DMI (Directional Movement Index) table that displays trend direction and strength across multiple timeframes simultaneously. This indicator helps traders quickly assess market conditions and identify confluence across different time horizons.
Features:
Multi-timeframe analysis (7 configurable timeframes)
Color-coded cells based on trend strength and direction
Real-time current market condition display
Customizable strength thresholds and color schemes
Multiple display modes (All, DI+ Only, DI- Only, ADX Only)
Text-based strength classifications (STRONG/MEDIUM/WEAK)
Directional bias indicators (BULL/BEAR)
How It Works:
The table shows DI+, DI-, and ADX values across your chosen timeframes with intelligent color coding:
Green shades indicate bullish momentum (DI+ > DI-)
Red shades indicate bearish momentum (DI- > DI+)
Color intensity reflects trend strength based on ADX values
Current market condition appears in top-right corner
Display Options:
Toggle numerical values, strength text, and timeframe labels
Adjustable table size and transparency
Customizable color schemes for all conditions
Optional current timeframe DMI plot overlay
Educational Use:
This tool is designed for educational purposes to help understand multi-timeframe analysis and DMI interpretation. All trading decisions should be based on your own analysis and risk management.
Credits:
Original concept and development by Profitgang. If you use or modify this script, please provide appropriate credit to the original author.
Note: This indicator is for analysis purposes only. Past performance does not guarantee future results. Always conduct your own research and consider your risk tolerance before making trading decisions.

Enhanced 4H Candle Countdown & High/Low IndicatorBy profitgang
This Pine Script indicator provides real-time tracking of 4-hour timeframe levels with an integrated countdown timer, designed to help traders monitor key support and resistance zones.
Key Features
📊 Visual Elements
4H High/Low Lines: Clear visualization of previous 4-hour candle high and low levels
Range Fill: Subtle background fill between high and low for better context
Mid-Level Line: Shows the middle point of the 4H range
Position Indicator: Visual cue showing current price position within the range
⏰ Countdown Timer
Real-time countdown to next 4H candle close
Customizable table position (9 different locations)
Adjustable text size (6 size options from Tiny to Huge)
Distance calculations showing percentage distance from key levels
🎯 Signal Generation
Long signals when price crosses above 4H low
Short signals when price crosses below 4H high
RSI confluence filter to reduce false signals
Background highlighting for active signals
TradingView alerts compatible
⚙️ Customization Options
Toggle all features on/off independently
Custom colors for all elements
Table positioning (top/middle/bottom + left/center/right)
Text size selection for optimal readability
Alert notifications for level breaks and updates
How It Works
The indicator fetches the previous 4-hour candle's high and low values and displays them as horizontal lines on your current timeframe chart. It continuously calculates the time remaining until the current 4H candle closes and presents this information in a clean, customizable table.
Use Cases
Swing Trading: Identify key 4H support and resistance levels
Intraday Trading: Monitor when new 4H levels will be established
Risk Management: Calculate distance from key levels for position sizing
Multi-timeframe Analysis: Combine with lower timeframe setups
Educational Purpose
This indicator is designed for educational and analytical purposes to help traders understand price action relative to higher timeframe levels. It provides clear visual feedback about market structure and timing.
Settings Groups
Display Settings: Toggle features, positioning, and sizing
Colors: Customize all visual elements
Signal Settings: Configure alert conditions and confluence filters
Compatibility
Works on all timeframes (recommended for 1m to 1H charts)
Compatible with all instruments
Includes proper alert functionality for automated notifications
Optimized for both light and dark themes
This indicator does not provide financial advice. Always conduct your own research and risk management before making trading decisions.

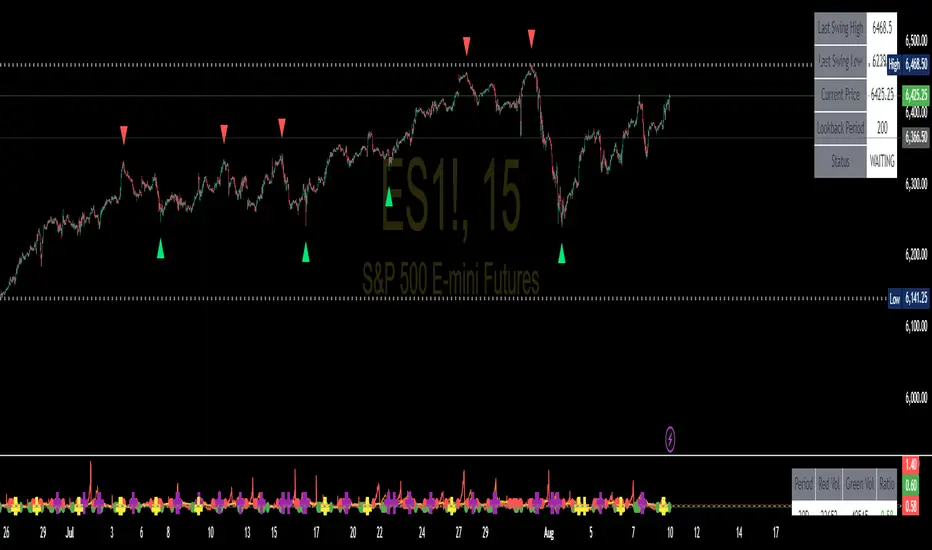
Swing High/Low SignalsSwing High/Low Signals – profit gang
Quickly spot recent market turning points with this clean swing high/low indicator.
Marks swing highs & lows with labels or triangles
Optional connecting lines & background highlights
Alerts when new swings form
Info table showing last swing levels & current price
Fully adjustable lookback period for any timeframe.
Disclaimer: For educational use only. Not financial advice.
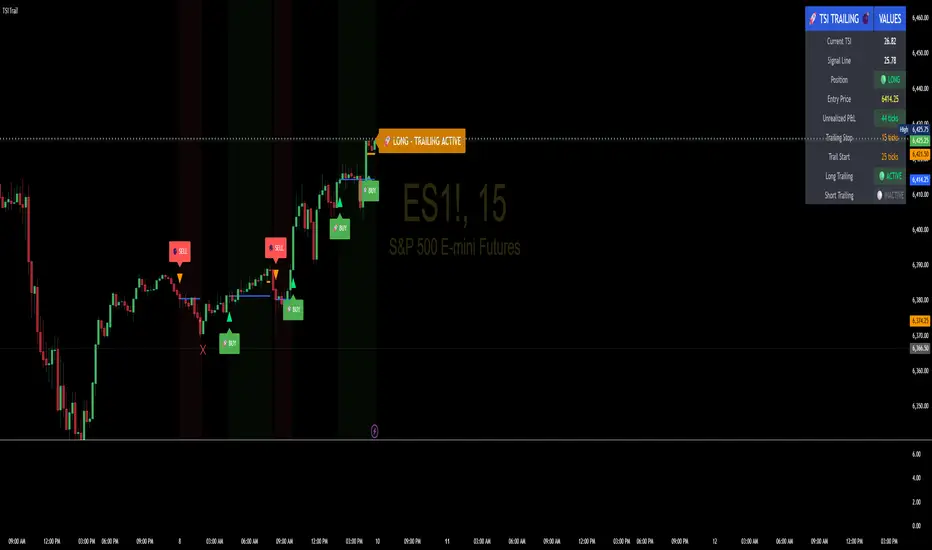
TSI Indicator with Trailing StopAuthor: ProfitGang
Type: Indicator (visual + alerts). No orders are executed.
What it does
This tool combines the True Strength Index (TSI) with a simple tick-based trailing stop visualizer.
It plots buy/sell markers from a TSI cross with momentum confirmation and, if enabled, draws a trailing stop line that “ratchets” in your favor. It also shows a compact info table (position state, entry price, trailing status, and unrealized ticks).
Signal logic (summary)
TSI is computed with double EMA smoothing (user lengths).
Signals:
Buy when TSI crosses above its signal line and momentum (TSI–Signal histogram) improves, with TSI above your Buy Threshold.
Sell when TSI crosses below its signal line and momentum weakens, with TSI below your Sell Threshold.
Confirmation: Optional “Confirm on bar close” setting evaluates signals on closed bars to reduce repaint risk.
Trailing stop (visual only)
Units are ticks (uses the symbol’s min tick).
Start Trailing After (ticks): activates the trail only once price has moved in your favor by the set amount.
Trailing Stop (ticks): distance from price once active.
For longs: stop = close - trail; it never moves down.
For shorts: stop = close + trail; it never moves up.
Exits shown on chart when the trailing line is touched or an opposite signal occurs.
Note: This is a simulation for visualization and does not place, manage, or guarantee broker orders.
Inputs you can tune
TSI Settings: Long Length, Short Length, Signal Length, Buy/Sell thresholds, Confirm on Close.
Trailing Stop: Start Trailing After (ticks), Trailing Stop (ticks), Show/Hide trailing lines.
Display: Toggle chart signals, info table, and (optionally) TSI plots on the price chart.
Alerts included
TSI Buy / TSI Sell
Long/Short Trailing Activated
Long/Short Trail Exit
Tips for use
Timeframes/markets: Works on any symbol/timeframe that reports a valid min tick. If your market has large ticks, adjust the tick inputs accordingly.
TSI view: By default, TSI lines are hidden to avoid rescaling the price chart. Enable “Show TSI plots on price chart” if you want to see the oscillator inline.
Non-repainting note: With Confirm on bar close enabled, signals are evaluated on closed bars. Intrabar previews can change until the bar closes—this is expected behavior in TradingView.
Limitations
This is an indicator for education/research. It does not execute trades, and visuals may differ from actual broker fills.
Performance varies by market conditions; thresholds and trail settings should be tested by the user.
Disclaimer
Nothing here is financial advice. Markets involve risk, including possible loss of capital. Always do your own research and test on a demo before using any tool in live trading.
— ProfitGang
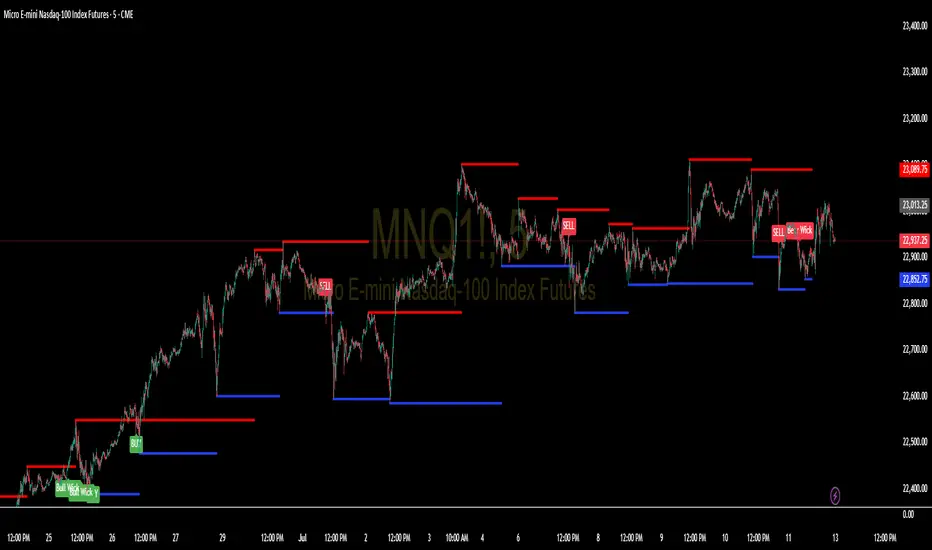
Support and Resistance Levels with BreaksThis indicator identifies dynamic support and resistance levels using pivot point analysis and provides clear trading signals when these levels are broken with volume confirmation. Enhanced version with improved signal clarity for better trading decisions.
## 🔧 Key Features
### Support & Resistance Detection
- Automatically identifies key pivot high and low levels
- Draws clear visual lines (red for resistance, blue for support)
- Configurable sensitivity with left/right bar settings
### Enhanced Trading Signals
- **BUY** signals when resistance is broken with volume confirmation
- **SELL** signals when support is broken with volume confirmation
- **Bull Wick** alerts for potential reversals at resistance
- **Bear Wick** alerts for potential reversals at support
### Volume Confirmation
- Built-in volume oscillator using 5 and 10-period EMAs
- Filters out low-volume false breakouts
- Adjustable volume threshold (default: 20%)
### Complete Alert System
- Support Broken alerts
- Resistance Broken alerts
- Bull Wick reversal alerts
- Bear Wick reversal alerts
## ⚙️ Settings
- **Show Breaks**: Toggle signal display
- **Left Bars**: Pivot detection lookback (default: 15)
- **Right Bars**: Pivot detection lookforward (default: 15)
- **Volume Threshold**: Minimum volume increase for valid signals (default: 20%)
## 📈 Best For
- Swing trading strategies
- Breakout confirmation
- Support/resistance trading
- Volume-based entry signals
## 🔍 How It Works
1. Identifies pivot highs/lows using configurable periods
2. Calculates volume oscillator for confirmation
3. Generates BUY signals on resistance breaks with volume
4. Generates SELL signals on support breaks with volume
5. Detects wick patterns for potential reversals
## 📋 Updates in This Version
- Enhanced BUY/SELL signal clarity (replaced generic "B" labels)
- Added Bull Wick and Bear Wick alert conditions
- Updated to Pine Script v6 compatibility
- Improved signal filtering and accuracy
## ⚠️ Disclaimer
This indicator is for educational and informational purposes only. Always conduct your own analysis and risk management before making trading decisions. Past performance does not guarantee future results.
---
**Original Script**: "Support and Resistance Levels with Breaks" by LuxAlgo
**License**: CC BY-NC-SA 4.0
**Enhanced by**: profitgang
**Version**: Pine Script v6
Futures Support & Resistance LevelsMulti-Timeframe Support & Resistance Levels for Futures Trading
Description:
This indicator automatically identifies and displays key support and resistance levels using multiple technical analysis methods. Designed specifically for futures traders (ES, NQ, etc.), it provides a clean, organized view of important price levels.
Key Features:
Multiple Detection Methods: Combines pivot points, daily ranges, and psychological levels
Smart Ranking System: Levels are numbered by strength (1 = strongest)
Clean Visualization: Extended lines across the chart with clear price labels
Confluence Detection: Highlights areas where multiple levels converge
Customizable Display: Adjust colors, line styles, and label sizes
Level Types Identified:
Daily High/Low (current session)
Previous Daily High/Low
Pivot-based Support/Resistance
Psychological Round Numbers
Confluence Zones (multiple levels clustering)
Technical Approach:
The indicator uses a strength-scoring algorithm to rank levels by importance. Daily levels receive the highest weighting (2.0), followed by previous daily levels (1.5), pivot points (1.0), and psychological levels (0.5). This helps traders focus on the most significant levels.
Visual Elements:
Solid lines = Strong levels
Dashed lines = Medium levels
Dotted lines = Weak levels
Optional technical condition markers for educational analysis
Best Used For:
Identifying key intraday levels for futures trading
Finding high-probability reversal zones
Setting logical stop-loss and take-profit levels
Recognizing confluence areas for stronger setups
Note:
This is a technical analysis tool for educational purposes. No indicator can predict future price movements. Always use proper risk management and combine with other forms of analysis.

Pivot ATR Zones [v6]🟩 Pivot ATR Zones
Overview:
The Pivot ATR Zones indicator plots dynamic support and resistance zones based on pivot highs and lows, combined with ATR (Average True Range) volatility levels. It helps traders visually identify potential long and short trade areas, along with realistic target and stop loss zones based on market conditions.
Features:
Automatically detects pivot highs and lows
Draws ATR-based entry zones on the chart
Plots dynamic take-profit and stop-loss levels using ATR multipliers
Color-coded long (green) and short (red) zones
Entry arrow markers for clearer trade visualization
Real-time alerts when new zones form
Best For:
Scalpers, intraday traders, and swing traders who want a visual, volatility-aware way to mark potential trade areas based on key pivot structures.
How to Use:
Look for newly formed green zones for long opportunities and red zones for short setups.
Use the dashed lines as dynamic take-profit and stop levels, tuned to the current ATR value.
Combine with other confirmation tools or indicators for optimal results.
Profit Guard ProProfitGuard Pro
ProfitGuard Pro is a risk management and profit calculation tool that helps traders optimize their trades by handling position sizing, risk management, leverage, and take profit calculations. With support for both cumulative and non-cumulative take profit strategies, this versatile indicator provides the insights you need to maximize your trading strategy.
How to Use ProfitGuard Pro:
Load the Indicator: Add ProfitGuard Pro to your chart in TradingView.
Set Your Entry Position: Input your desired entry price.
Define Your Stop Loss: Enter the price at which your trade will exit to minimize losses.
Add Take Profit Levels: Input your TP1, TP2, TP3, and TP4 levels, as needed.
If you want fewer take profit levels, adjust the number of TPs in the settings menu. You can choose between 1 to 4 take profit levels based on your strategy.
Adjust Risk Settings: Specify your account size and risk percentage to calculate position size and leverage.
Choose Cumulative or Non-Cumulative Mode: Toggle cumulative profit mode to either recalculate position sizes as each take profit is hit or keep position sizes static for each TP.
Once set up, ProfitGuard Pro will automatically calculate your position size, leverage, and potential profits for each take profit level, providing a clear visual on your chart to guide your trading decisions.
Key Features:
Risk Management:
Calculate your risk percentage based on account size and stop loss.
Visualize risk in dollar terms and percentage of your account.
Position Size & Leverage:
Automatically calculate the ideal position size and leverage for your trade based on your entry, stop loss, and risk settings.
Ensure you are trading with the appropriate leverage for your account size.
Cumulative vs Non-Cumulative Profit Mode:
Cumulative Mode: Adjusts position size after each take profit is reached, recalculating for remaining contracts.
Non-Cumulative Mode: Treats each take profit as a separate calculation using the full position size.
Take Profit Levels:
Set up to 4 customizable take profit levels.
Adjust percentage values for each TP target, and visualize them on your chart with easy-to-read lines.
Profit Calculation:
Displays potential profits for each take profit level based on whether cumulative or non-cumulative mode is selected.
Calculate your risk-reward ratio dynamically at each TP.
Customizable Visuals:
Easily customize the table's size, position, and color scheme to fit your chart.
Visualize key trade details like leverage, contracts, margin, and profits directly on your chart.
Short and Long Position Support:
Automatically adjusts calculations based on whether you're trading long or short.


[ProfitTrailer:Feeder] Up Down VolatilityUpside & DownSide Volatility is commonly used in the ProfitTrailer:Feeder community scene, so I decided to create a script for it.
Please 'follow & like' if you like this script! Thanks

[ProfitTrailer:Feeder] Stochastics Just like RSI the Stochastics Indicator is very often used in ProfitTrailer:Feeder and therefore I decides to create this script so people can easily test/tryout there specific inputs.
Note: Because there's a difference (in outcome) between the calculation function from TV and the traditional calculation (used by ProfitTrailer) I created an option to select the kind of calculation you prefer.
Enjoy!

[ProfitTrailer:Feeder] RSIBecause RSI is so commonly used in creating strategies for ProfitTrailer:Feeder is decided to translate this indicator to PineCode so you can test your settings based on the variables PTF offers.
Please let me know what you think and if you consider this kind of content valuable please 'like & follow' me.
Enjoy and thanks in advance!
