Andromeda [Loxx]Andromeda is a lower timeframe, high-leverage scalping indicator tuned to Cryptocurrency futures trading. It works by scanning for volatility spikes and then calculation the likelihood that those spikes will break market structure to the upside or downside.
Settings
Volatility Type: ATR or TRD, these types will be expanded in future releases.
Signal Speed: How quickly you'd like signals to flow in
Equity Calculation Method: Fixed or compounded. This determines trade size. If fixed, then the strategy uses the same quantity per trade, if compounded the strategy uses a percentage of cash on hand as that cash grows or shrinks
% Risk Per Trade: How much you'd like to risk per trade.
Leverage Multiple: How much leverage you'd like to use
% Maintenance Margin: You can find this value posted on the exchange you use
Enabled Forced Liquidation Stop-loss?: If enabled, the strategy will liquidate at measures of leverage automatically. 10x leverage liquidates at 10% opposite move for the trade, for example. This number will be adjusted by the % Maintenance Margin determined by the exchange.
% Minimum Take Profit Cutoff: This controls whether you wish to take trades only over XX% volatility. Since this indicator is to be used for small tight scalps, this keeps you out of trades that are too small to be useful for your desired trading style
Activate Long Pullback Rule?: This controls how the trade is entered. If activated, then the entry won't occur until a pullback happens after market structure break
Activate Short Pullback Rule?: This controls how the trade is entered. If activated, then the entry won't occur until a pullback happens after market structure break
Activate Trend Flip Exits?: Force strategy to exit when trend flips from short to long and long to short
Number of Take Profits: How many take profits levels. 1-5
Activate Trailing Take Profit?: Allows you to set a trailing stop loss after TP2 his hit
Trailing Take Profit Offset Multipler: This determines when the trailing stoploss hits. It's a multiple of volatility
Activate Moving Stop-loss?: Forces the stop loss to move up as targets are reached
Where to Move Stop-loss: At which Take Profit level do we begin to move stoplosses upward with targets
Show dip buying levels: If you have a high risk appetite, these are levels where you could increase your investment size, this has no effect on the strategy but is included for if you wish to manually add to your position size
Activate Longs?: Toggles on/off Longs
Activate Longs?: Toggles on/off Shorts
The remaining settings are multiples of volatility for Take Profits and dip buying levels
UI components
Big green and red plus signs means an entry point. PTF with green and red arrows means "prepare for trend flip". Not every PTF will actually flip the trend. These are just warning shots to make you aware that a possible trend flip is coming. Labels nest to market structure breaks with numbers are the ideal entry level. You can set limit orders at these levels so as to incur less exchange fees on Binance or Bybit for example. The data window provides useful information about the current trade and targets and stoploss of the next upcoming trade giving the current price action of the asset.
Other things to note
this is an extremely high risk strategy depending on how you tune the settings. You can tune down the settings to make it less risky at the cost of profit and hit rate, but that's up to you and your trading style. This can be used all all timeframes, but is meant for timeframes below 4 hours.
Cerca negli script per "profit"

[Sniper] SuperTrend + SSL Hybrid + QQE MODHi. I’m DuDu95.
**********************************************************************************
This is the script for the series called "Sniper".
*** What is "Sniper" Series? ***
"Sniper" series is the project that I’m going to start.
In "Sniper" Series, I’m going to "snipe and shoot" the youtuber’s strategy: to find out whether the youtuber’s video about strategy is "true or false".
Specifically, I’m going to do the things below.
1. Implement "Youtuber’s strategy" into pinescript code.
2. Then I will "backtest" and prove whether "the strategy really works" in the specific ticker (e.g. BTCUSDT) for the specific timeframe (e.g. 5m).
3. Based on the backtest result, I will rate and judge whether the youtube video is "true" or "false", and then rate the validity, reliability, robustness, of the strategy. (like a lie detector)
*** What is the purpose of this series? ***
1. To notify whether the strategy really works for the people who watched the youtube video.
2. To find and build my own scalping / day trading strategy that really works.
**********************************************************************************
*** Strategy Description ***
This strategy is from " QQE MOD + supertrend + ssl hybrid" by korean youtuber "코인투데이".
"코인투데이" claimed that this strategy will make you a lot of money in any crypto ticker in 15 minute timeframe.
### Entry Logic
1. Long Entry Logic
- Super Trend Short -> Long
- close > SSL Hybrid baseline upper k
- QQE MOD should be blue
2. Short Entry Logic
- Super Trend Long -> Short
- close < SSL Hybrid baseline lower k
- QQE MOD should be red
### Exit Logic
1. Long Exit Logic
- Super Trend Long -> Short
2. Short Entry Logic
- Super Trend Short -> Long
### StopLoss
1. Can Choose Stop Loss Type: Percent, ATR, Previous Low / High.
2. Can Chosse inputs of each Stop Loss Type.
### Take Profit
1. Can set Risk Reward Ratio for Take Profit.
- To simplify backtest, I erased all other options except RR Ratio.
- You can add Take Profit Logic by adding options in the code.
2. Can set Take Profit Quantity.
### Risk Manangement
1. Can choose whether to use Risk Manangement Logic.
- This controls the Quantity of the Entry.
- e.g. If you want to take 3% risk per trade and stop loss price is 6% below the long entry price,
then 50% of your equity will be used for trade.
2. Can choose How much risk you would take per trade.
### Plot
1. Added Labels to check the data of entry / exit positions.
2. Changed and Added color different from the original one. (green: #02732A, red: #D92332, yellow: #F2E313)
3. SuperTrend and SSL Hybrid Baseline is by default drawn on the chart.
4. If you check EMA filter, EMA would be drawn on the chart.
5. Should add QQE MOD indicator manually if you want to see QQE MOD.
**********************************************************************************
*** Rating: True or False?
### Rating:
→ 3.5 / 5 (0 = Trash, 1 = Bad, 2 = Not Good, 3 = Good, 4 = Great, 5 = Excellent)
### True or False?
→ True but not a 'perfect true'.
→ It did made a small profit on 15 minute timeframe. But it made a profit so it's true.
→ It worked well in longer timeframe. I think super trend works well so I will work on this further.
### Better Option?
→ Use this for Day trading or Swing Trading, not for Scalping. (Bigger Timeframe)
→ Although the result was not good at 15 minute timeframe, it was quite profitable in 1h, 2h, 4h, 8h, 1d timeframe.
→ Crypto like BTC, ETH was ok.
→ The result was better when I use EMA filter.
### Robust?
→ Yes. Although result was super bad in 5m timeframe, backtest result was "consistently" profitable on longer timeframe (when timeframe was bigger than 15m, it was profitable).
→ Also, MDD was good under risk management option on.
**********************************************************************************
*** Conclusion?
→ I recommend you not to use this on short timeframe as the youtuber first mentioned.
→ In my opinion, I can use on longer timeframe like 2h or bigger with EMA filter, stoploss and risk management.

[Sniper] SSL Hybrid + QQE MOD + Waddah Attar StrategyHi. I’m DuDu95.
**********************************************************************************
This is the script for the series called "Sniper".
*** What is "Sniper" Series? ***
"Sniper" series is the project that I’m going to start.
In "Sniper" Series, I’m going to "snipe and shoot" the youtuber’s strategy: to find out whether the youtuber’s video about strategy is "true or false".
Specifically, I’m going to do the things below.
1. Implement "Youtuber’s strategy" into pinescript code.
2. Then I will "backtest" and prove whether "the strategy really works" in the specific ticker (e.g. BTCUSDT) for the specific timeframe (e.g. 5m).
3. Based on the backtest result, I will rate and judge whether the youtube video is "true" or "false", and then rate the validity, reliability, robustness, of the strategy. (like a lie detector)
*** What is the purpose of this series? ***
1. To notify whether the strategy really works for the people who watched the youtube video.
2. To find and build my own scalping / day trading strategy that really works.
**********************************************************************************
*** Strategy Description ***
This strategy is from "SSL QQE MOD 5MIN SCALPING STRATEGY" by youtuber "Daily Investments".
"Daily Investments" claimed that this strategy will make you some money from 100 trades in any ticker in 5 minute timeframe.
### Entry Logic
1. Long Entry Logic
- close > SSL Hybrid Baseline.
- QQE MOD should turn into blue color.
- Waddah Attar Explosion indicator must be green.
2. Short Entry Logic
- close < SSL Hybrid Baseline
- QQE MOD should turn into red color.
- Waddah Attar Explosion indicator must be red.
### Exit Logic
1. Long Exit Logic
- When QQE MOD turn into red color.
2. Short Entry Logic
- When QQE MOD turn into blue color.
### StopLoss
1. Can Choose Stop Loss Type: Percent, ATR, Previous Low / High.
2. Can Chosse inputs of each Stop Loss Type.
### Take Profit
1. Can set Risk Reward Ratio for Take Profit.
- To simplify backtest, I erased all other options except RR Ratio.
- You can add Take Profit Logic by adding options in the code.
2. Can set Take Profit Quantity.
### Risk Manangement
1. Can choose whether to use Risk Manangement Logic.
- This controls the Quantity of the Entry.
- e.g. If you want to take 3% risk per trade and stop loss price is 6% below the long entry price,
then 50% of your equity will be used for trade.
2. Can choose How much risk you would take per trade.
### Plot
1. Added Labels to check the data of entry / exit positions.
2. Changed and Added color different from the original one. (green: #02732A, red: #D92332, yellow: #F2E313)
3. SSL Hybrid Baseline is by default drawn on the chart.
4. If you check EMA filter, EMA would be drawn on the chart.
5. Should add QQE MOD and Waddah Attar Explosion indicator manually if you want to see QQE MOD.
**********************************************************************************
*** Rating: True or False?
### Rating:
→ 1.5 / 5 (0 = Trash, 1 = Bad, 2 = Not Good, 3 = Good, 4 = Great, 5 = Excellent)
### True or False?
→ False
→ Doesn't Work on 5 minute timeframe. Also, it doesn't work on crypto.
### Better Option?
→ Use this for Day trading or Swing Trading, not for Scalping. (Bigger Timeframe)
→ Although the result was bad at 5 minute timeframe, it was profitable in 1h, 2h, 4h, 8h, 1d timeframe.
→ BTC, ETH was ok.
→ The result was better when I use EMA filter (only on longer timeframe).
### Robust?
→ So So. Although result was bad in short timeframe (e.g. 30m 15m 5m), backtest result was "consistently" profitable on longer timeframe.
→ Also, MDD was not that bad under risk management option on.
**********************************************************************************
*** Conclusion?
→ Don't use this on short timeframe.
→ Better use on longer timeframe with filter, stoploss and risk management.

Consolidation Breakout [Indian Market Timing]OK let's get started ,
A Day Trading (Intraday) Consolidation Breakout Indication Strategy that explains time condition for Indian Markets .
The commission is also included in the strategy .
The basic idea is ,
1) Price crosses above upper band , indicated by a color change (green) is the Long condition .
2) Price crosses below lower band , indicated by a color change (red) is the Short condition .
3) ATR is used for trailing after entry
// ═══════════════════════════════//
// ————————> TIME CONDITION <————————— //
// ═══════════════════════════════//
The Indian Markets open at 9:15am and closes at 3:30pm.
The time_condition specifies the time at which Entries should happen .
"Close All" function closes all the trades at 2:57pm.
All open trades get closed at 2:57pm , because some brokers dont allow you to place fresh intraday orders after 3pm.
NSE:NIFTY1!
// ═══════════════════════════════════════════════ //
// ————————> BACKTEST RESULTS ( 114 CLOSED TRADES )<————————— //
// ═══════════════════════════════════════════════ //
LENGTH , MULT (factor) and ATR can be changed for better backtest results.
The strategy applied to NIFTY (3 min Time-Frame and contract size 5) gives us 60% profitability , as shown below
It was tested for a period a 8 months with a Profit Factor of 2.2 , avg Trade of 6000Rs profit and Sharpe Ratio : 0.67
The graph has a Linear Curve with consistent profits.
NSE:NIFTY1!
Save it favorites.
Apply it to your charts Now !!
Thank me later ;)

Mean reversal QFL v3My aim is to make the bots trade as you would trading QFL manually and “by the book” or at least to my experience and understanding from the material out there of how you should plan a QFL trade.
Im absolutely not a pro trader, I have made my share of costly mistakes trying to be clever or Beeing impatient resulting in painful losses. QFL is we’re I’ve had consistently good results tough.
Is this where I have to say I’m not a financial advisor and all that? Well I’m not. As always Do your own research and backtest, backtest, backtest.
First: I believe no bot strategy are set and forget, while they can run unattended 80-90% of the time you're always going to find yourself in a situation where you will have to manually handle a bad deal. It would also make sense to be somewhat involved in the really good trades making the most out of them. That’s why understanding the strategy the bot Is using is really important, hence why I prefer QFL. It's an easy concept to understand, and proved to be a safe way of making steady profit in pretty much all market conditions if done right.
Some changes in how aggressive you are might be needed if you are the impatient kind of trader who needs to see a lot of deals happening. But it is an added risk. In those cases Luc would advise to start “nibbling” but that would be hard to implement in a bot but I will see if that’s something I can implement.
Same goes for going the more conservative route when market conditions calls for it.
QFL stands for Quickfingersluc, and sometimes it is referred to as the Base Strategy or Mean Reversals. Its main idea is about identifying the moment of panic selling and buying below the base level and utilizing Safety orders.
Base level or Support Level refers to the lowest price level that was reached before the moment the price started increasing again. At that level, you can notice that buyers of some cryptocurrencies make a strong reaction.
As a bit of a learning material i want to make a few points on important factors in trading using the QFL strategy:
• Identify strong bases
• Read the history of the chart
• No emotions
Trading QFL using a bot has it’s limitations:
· Some of the bases are questionable but im constantly trying to improve this
· The strategy don’t take into consideration chart history(success rate)*
· You need to follow a predefined (by you) buying ladder, hence not considering a particular coin's average price movement, which may vary quite a lot. This why I for now has limited the strategy to SIMPLE bots. So that unique alerts can be created for each pair.
· A set Take profit %, possibly making you miss out on higher profits(This is easy to change during a trade though), and no chance of selling in layers(This is coming soon).
1. Some of the bases are questionable
The strategy will start trades of bases that you wouldn’t consider being a strong base(or a base at all) when looking at the chart.
For those not as familiar with QFL. What is a base, and what qualifies as a strong base?
• A base is also called the Support Level, which is the lowest price level that was reached before the price started turning and increasing again.
• A strong base is recognized by a steep fall in price after breaking the base(Panic), followed by a big reaction pump.
• The reaction pump is the most important factor to say that it is a strong base.
• And also the last base, the one you are trading of is the one that counts
Tip: Look for V shapes on the chart, easy to spot when zoomed out.
2. The integrated signals don’t take into consideration chart history(success rate)*
How can you assess the success rate by looking at the chart?
After finding the bases based on the criterias from the 1st point. Looking at the, how many times did it respect the base after breaking it? 7/10, 8/10, 9/10 times? Great! Chances of the next trade also respecting the base is big, and I would consider raising the TP on that deal. Any lower than that I would keep a really close eye on the deal, or even consider closing the deal. And again remember the last base is the one that counts. If all the others are nice strong bases but that last one you are about to take a trade off is no good the base is invalidated so be cautious.
3. You need to follow a predefined (by you) buying ladder
Crypto is volatile, and there is a huge variation in price movements on all the coins.
Trading manually, looking at the chart gives you a good idea on how much a coin on avg. drops below base, and how big the following reaction is. This gives you an indication on how deep you need to set your layers, and where you can take profit.
Using the strategy you have the backtester to see how much max deviation has been in the past so that you can figure out what the optimal max deviation is.
4. A set Take profit %, possibly making you miss out on higher profits(This is easy to change during a trade though), and no chance of selling in layers.
Not going to say to much about this other than what I often do is:
When a bot has started a trade I usually take a look at the chart. If I like what I see, nice chart history, success rate and trading of a strong previous base etc, with the current base break resulting in a panic drop I will consider increasing the TP so that it will make more profit. This can be a bit risky but also very rewarding. Imagine filling all safeties and then selling just below base! Massive profits!! (Gotta be honest though, almost never stretch it that far with a bot though, but it is a possibility) .
If you have studied the chart and concluded that this particular trade has a 90% chance of success, there isn’t really any reason not to place TP just below base. This is where I would like to have the option of layering my sell orders as well so its something im working on implementing.
Trailing is an option in 3commas, but it’s slow to place orders making you miss a selling opportunity when the coin makes a sudden spike up.
ABOUT THIS STRATEGY
In this strategy we can also reverse the strategy and go short. But i must warn you that that is alot riskier.
QFL is meant to be used on higher TF's like 1hr, 2hr and 4hr. But this strategy also work well on lower Timeframes.
The script also simulates DCA strategy with parameters used in 3commas DCA bots for futures trading.
Experiment with parameters to find your trading setup.
Beware how large your total leveraged position is and how far can market go before you get liquidated!
Do that with the help of futures liquidation calculators you can find online!
Included:
An internal average price and profit calculating, instead of TV`s native one, which is subject to severe slippage.
A graphic interface, so levels are clearly visible and back-test analyzing made easier.
Long & Short direction of the strategy.
Table display a summary of past trades
Vertical colored lines appear when the new maximum deviation from the original price has
been reached
All the trading happens with total account capital, and all order sizes inputs are expressed in percent.
How to use:
- Add the script to the current chart
- Open the strategy settings
-Tweak the settings to to your liking.
-Make a SIMPLE bot in 3commas and use the same settings as you did in tradingview if you only want the strategy to send signals to open a deal and let 3commas handle the rest.
If you check safety orders, Take profit deal stop and Stop loss. The strategy will send all the orders to 3 commas. If that’s what you want set TP in 3commas to 50% set number of safety orders to 0 and keep stop loss unchecked.
- Insert bot details using the deal start condition message found in your 3commas bot.
- When happy, right click on the "..." next to the strategy name, then "Add alert'".
- Under "Condition", on the second line, chose "Any alert () function call". Add the webhook from 3commas( 3commas.io ), give it a name, use {{strategy.order.alert_message}} as a placeholder message and "create".
In the future this signal might make it to the 3commas marketplace. You can then subscribe to that signal where I have cherrypicked coins based on thorough backtesting and optimization.
How to obtain access to the script: send me a private message in Tradingview

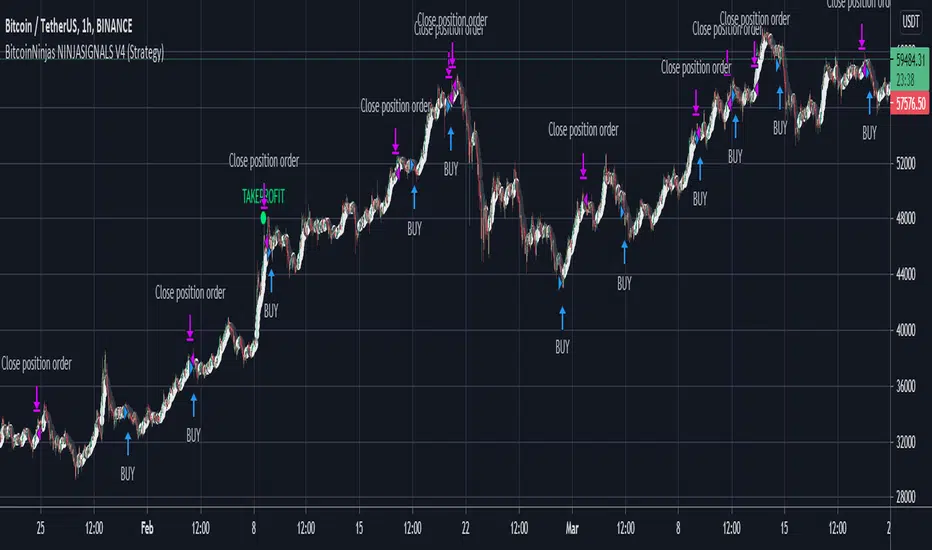
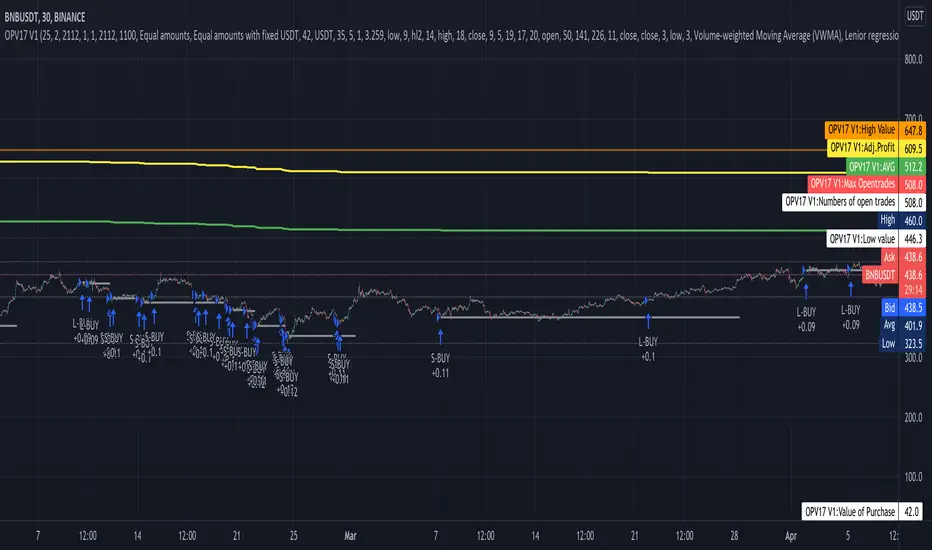
Close v Open Moving Averages Strategy (Variable) [divonn1994]This is a simple moving average based strategy that works well with a few different coin pairings. It takes the moving average 'opening' price and plots it, then takes the moving average 'closing' price and plots it, and then decides to enter a 'long' position or exit it based on whether the two lines have crossed each other. The reasoning is that it 'enters' a position when the average closing price is increasing. This could indicate upwards momentum in prices in the future. It then exits the position when the average closing price is decreasing. This could indicate downwards momentum in prices in the future. This is only speculative, though, but sometimes it can be a very good indicator/strategy to predict future action.
What I've found is that there are a lot of coins that respond very well when the appropriate combination of: 1) type of moving average is chosen (EMA, SMA, RMA, WMA or VWMA) & 2) number of previous bars averaged (typically 10 - 250 bars) are chosen.
Depending on the coin.. each combination of MA and Number of Bars averaged can have completely different levels of success.
Example of Usage:
An example would be that the VWMA works well for BTCUSD (BitStamp), but it has different successfulness based on the time frame. For the 12 hour bar timeframe, with the 66 bar average with the VWMA I found the most success. The next best successful combo I've found is for the 1 Day bar timeframe with the 35 bar average with the VWMA.. They both have a moving average that records about a month, but each have a different successfulness. Below are a few pair combos I think are noticeable because of the net profit, but there are also have a lot of potential coins with different combos:
It's interesting to see the strategy tester change as you change the settings. The below pairs are just some of the most interesting examples I've found, but there might be other combos I haven't even tried on different coin pairs..
Some strategy settings:
BTCUSD (BitStamp) 12 Hr Timeframe : 66 bars, VWMA=> 10,387x net profit
BTCUSD (BitStamp) 1 Day Timeframe : 35 bars, VWMA=> 7,805x net profit
BNBUSD (Binance) 12 Hr Timeframe : 27 bars, VWMA => 15,484x net profit
ETHUSD (BitStamp) 16 Hr Timeframe : 60 bars, SMA => 5,498x net profit
XRPUSD (BitStamp) 16 Hr Timeframe : 33 bars, SMA => 10,178x net profit
I only chose these coin/combos because of their insane net profit factors. There are far more coins with lower net profits but more reliable trade histories.
Also, usually when I want to see which of these strategies might work for a coin pairing I will check between the different Moving Average types, for example the EMA or the SMA, then I also check between the moving average lengths (the number of bars calculated) to see which is most profitable over time.
Features:
-You can choose your preferred moving average: SMA, EMA, WMA, RMA & VWMA.
-You can also adjust the previous number of calculated bars for each moving average.
-I made the background color Green when you're currently in a long position and Red when not. I made it so you can see when you'd be actively in a trade or not. The Red and Green background colors can be toggled on/off in order to see other indicators more clearly overlayed in the chart, or if you prefer a cleaner look on your charts.
-I also have a plot of the Open moving average and Close moving average together. The Opening moving average is Purple, the Closing moving average is White. White on top is a sign of a potential upswing and purple on top is a sign of a potential downswing. I've made this also able to be toggled on/off.
Please, comment interesting pairs below that you've found for everyone :) thank you!
I will post more pairs with my favorite settings as well. I'll also be considering the quality of the trades.. for example: net profit, total trades, percent profitable, profit factor, trade window and max drawdown.
*if anyone can figure out how to change the date range, I woul really appreciate the help. It confuses me -_- *

Gators Oscillator - Bitcoin Scalp Trader(T&M/e V3!!)Gator's Oscillator:
**For reference, all numbers, and settings displayed on the input screen are only what I HAVE FOUND to be profitable for my own strategy, Yours will differ. This is not financial advice and I am not a financial advisor. Please do your due diligence and own research before considering taking entries based on this strategy and indicator. I am not advertising investing, trading, or skills untaught, this is simply to help incorporate into your own strategy and improve your trading journey!**
INPUTS:
EV: This is an integer value set to default at 55. This value is equated to the lead value, volatility measurement, and standard deviation between averages
EV 2: This integer is used as the base value and is meant to always be GREATER THEN EV, the default is set at 163. There should be at least a 90+ integer difference between EVs for data accuracy.
EV TYPE & EV TYPE 2: This option only affects the output for the moving average histograms. (and data inserted for strategy)
Volatility Smoothing: This is the smoothness of the custom-made volatility oscillator. I have this default at 1 to show time-worthy-term (3.9%+) moves or significant trends to correspond with the standard deviation declination between EVMA and EVMA2.
Directional Length: This is the amount of data observed per candle in the bull versus bear indicator.
Take Profit: Pre-set takes profit level that is set to 4 but can be adjusted for user experience.
Style:
Base Length: Columns equated using a custom-made statistical equation derived from EV TYPE 2+EV2 to determine a range of differential in historic averages to a micro-scale.
Lead Length: Columns equated using a custom-made statistical equation derived from EV TYPE+EV to determine a range of differential in historic averages to a micro-scale.
Weighted EMA Differential: Equation expressing the differences between exponential and simple averages derived from EV+EV Type 2. Default is displaying none, but optional for use if found helpful.
Volatility: Represents volatility from multiple data sets spanning from Bollinger bands to HPV and translated through smoothing.
Bull Strength: The strength of Bulls in the current trend is derived from a DMI+RSI+MACD equation to represent where the trend lies.
Bear Strength: The strength of Bears in the current trend is derived from a DMI+RSI+MACD equation to represent where the trend lies.
(NEW) Standard Deviation between Moving Averages: Use this logarithmic indicator depicted as circles to help determine whether a move is a fake out or not. Compare the circles with the volatility line, if you see them deviating away, it is either a bull/bear trap or trend continuation is imminent until they correlate back together.
CHEAT CODE'S NOTES:
Do not use this indicator on high leverage. I have personally used this indicator for a week and faced a max of 8% drawdown, albeit painful I was on low leverage and still closed on my take profit level.
85% is not 100% do not overtrade using this indicator's entry conditions if you have made 4 consecutive profitable trades.
Mess around with the input values and let me know if you find an even BETTER hit rate, 30+ entries, and a good drawdown!!
V2 UPGRADES:
*Increased Opacity on Bull Bear Columns
*Removed the Stop Loss Input option
*Decreased EV2 to a default of 143 for accuracy
*Added additional disclaimers in the description
* Removed Bull/Bear offset values for accuracy
V3 UPGRADES:
*ADDED THE EMA DIFFERENTIAL FROM SMA STANDARD DEVIATION INDICATOR. REPRESENTED BY PURPLE BARS THAT PLOT BRIGHT AT EXTREME LEVELS (Translate this to the EMA's and SMA's are very far apart) This is a fantastic way to resolve volatility and momentum in one indicator!!
*Line Width increased for volatility
*plot's for Oversold Alma reduced to 3, also adjusted the plot shape to arrows corresponding to 'overbought/oversold values. Look for a cross-over from green/red plot to transparent for best signals.
*Histograms for bull/bear strength correspond to an increase or decrease in value
*Input screen converted into groups, with bull/bear color inline
*Converted base/lead length value's into areas with breaks. IF YOU SEE WHITE (Short/Lead Length), IT IS A SHORT TERM MOVE AND SCALPING OPPORTUNITY. IF YOU SEE BLUE(Long/Base Length) IT MEANS IT IS A MACRO MOVE, WHICH MAY LAST LONGER
-Cheat Code
BINANCE:BTCUSDT BYBIT:BTCUSDT COINBASE:BTCUSD

[MT Trader] Backtest template w/ Supertrend Strategy---EN: In this strategy template you will find some functions already pre-programmed to be used in your strategies to speed up the programming process, among them we can highlight the default stop loss and take profit functions, which will help to set easily and quickly, defining the price range in which we want to prevent large losses or protect our profits from unexpected market movements.
🔴 Stop Loss: Among the functions of the stop loss are the 4 most known, first we have the fixed percentage range (%) and price ($), when the price reaches this fixed price will limit the losses of the operation avoiding larger losses, then we have the average true range (ATR), a moving average of true range and X period that can give us good reference points to place our stop loss, finally the last point higher or lower is the most used by traders to place their stop loss.
In addition, the price range between the entry and stop loss can be converted into a trailing stop loss.
🟢 Take Profit: We have 3 options for take profit, just like stop loss, the fixed range of percentage(%) and price($), are available, in addition to this we have the 1:# ratio option, which multiplies by X number the range between the entry and stop loss to use it as take profit, perfect for strategies that use ATR or last high/low point for their strategy.
📈 Heikin Ashi Entrys: The heikin ashi entries are trades that are calculated based on heikin ashi candles but their price is executed in Japanese candles, thus avoiding the false results that occur in heikin candlestick charts, making that in certain cases better results are obtained in the strategies that are executed with this option compared to Japanese candlesticks.
📊 Dashboard: A more visual and organized way to see the results and data needed for our strategy.
Feel free to use this template to program your own strategies, if you find bugs or want to request a new feature let me know in the comments or through my telegram @hvert_mt
__________________________________________________________________________________________________________________________________________________
---ES: En esta plantilla de estrategia podrás encontrar algunas funciones ya pre-programadas para ser usadas en tus estrategias para acelerar procesos de programación, entre ellas podemos destacar las funciones por defecto de stop loss y take profit, que ayudaran a establecer de manera fácil y rápida, definiendo los rango de precio en los que queremos prevenirnos de perdidas grandes o proteger nuestras ganancias de movimientos inesperados del mercado.
🔴 Stop Loss: Entre las funciones del stop loss están las 4 más conocidas, en primer lugar tenemos el rango de porcentaje fijo(%) y el precio($), cuando el precio alcance este precio fijo se limitaran las perdidas de la operación evitando perdidas mas grandes, después tenemos el promedio de rango verdadero(ATR), una media móvil del rango verdadero y X periodo que nos puede dar buenos puntos de referencia para colocar nuestro stop loss, por ultimo el ultimo punto mas alto o mas bajo es de los mas usados por los traders para colocar su stop loss.
Adicional a esto, el rango de precio entre la entrada y el stop loss se puede convertir en un trailing stop loss.
🟢 Take Profit: Tenemos 3 opciones para take profit, al igual que en el stop loss, el rango fijo de porcentaje(%) y precio($) se encuentran disponibles, adicional a esto tenemos la opción de ratio 1:#, que multiplica por X numero el rango entre la entrada y el stop loss para usarlo como take profit, perfecto para estrategias que usen ATR o ultimo punto alto/bajo.
📈 Entradas Heikin Ashi: Las entradas Heikin Ashi son trades que son calculados en base a las velas Aeikin Ashi pero su precio esta ejecutado a velas japonesas, evitando así los falsos resultados que se producen en graficas de velas Heikin, esto haciendo que en ciertos casos se obtengan mejores resultados en las estrategias que son ejecutadas con esta opción en comparación con las velas japonesas.
📊 Panel de Control: Una manera mas visual y organizada de ver los resultados y datos necesarios de nuestra estrategia.
Siéntete libre de usar esta plantilla para programar tus propias estrategias, si encuentras errores o quieres solicitar una nueva función házmelo saber en los comentarios o a través de mi Telegram: @hvert_mt

STD-Filterd, R-squared Adaptive T3 w/ Dynamic Zones BT [Loxx]STD-Filterd, R-squared Adaptive T3 w/ Dynamic Zones BT is the backtest strategy for "STD-Filterd, R-squared Adaptive T3 w/ Dynamic Zones " seen below:
Included:
This backtest uses a special implementation of ATR and ATR smoothing called "True Range Double" which is a range calculation that accounts for volatility skew.
You can set the backtest to 1-2 take profits with stop-loss
Signals can't exit on the same candle as the entry, this is coded in a way for 1-candle delay post entry
This should be coupled with the INDICATOR version linked above for the alerts and signals. Strategies won't paint the signal "L" or "S" until the entry actually happens, but indicators allow this, which is repainting on current candle, but this is an FYI if you want to get serious with Pinescript algorithmic botting
You can restrict the backtest by dates
It is advised that you understand what Heikin-Ashi candles do to strategies, the default settings for this backtest is NON Heikin-Ashi candles but you have the ability to change that in the source selection
This is a mathematically heavy, heavy-lifting strategy with multi-layered adaptivity. Make sure you do your own research so you understand what is happening here. This can be used as its own trading system without any other oscillators, moving average baselines, or volatility/momentum confirmation indicators.
What is the T3 moving average?
Better Moving Averages Tim Tillson
November 1, 1998
Tim Tillson is a software project manager at Hewlett-Packard, with degrees in Mathematics and Computer Science. He has privately traded options and equities for 15 years.
Introduction
"Digital filtering includes the process of smoothing, predicting, differentiating, integrating, separation of signals, and removal of noise from a signal. Thus many people who do such things are actually using digital filters without realizing that they are; being unacquainted with the theory, they neither understand what they have done nor the possibilities of what they might have done."
This quote from R. W. Hamming applies to the vast majority of indicators in technical analysis . Moving averages, be they simple, weighted, or exponential, are lowpass filters; low frequency components in the signal pass through with little attenuation, while high frequencies are severely reduced.
"Oscillator" type indicators (such as MACD , Momentum, Relative Strength Index ) are another type of digital filter called a differentiator.
Tushar Chande has observed that many popular oscillators are highly correlated, which is sensible because they are trying to measure the rate of change of the underlying time series, i.e., are trying to be the first and second derivatives we all learned about in Calculus.
We use moving averages (lowpass filters) in technical analysis to remove the random noise from a time series, to discern the underlying trend or to determine prices at which we will take action. A perfect moving average would have two attributes:
It would be smooth, not sensitive to random noise in the underlying time series. Another way of saying this is that its derivative would not spuriously alternate between positive and negative values.
It would not lag behind the time series it is computed from. Lag, of course, produces late buy or sell signals that kill profits.
The only way one can compute a perfect moving average is to have knowledge of the future, and if we had that, we would buy one lottery ticket a week rather than trade!
Having said this, we can still improve on the conventional simple, weighted, or exponential moving averages. Here's how:
Two Interesting Moving Averages
We will examine two benchmark moving averages based on Linear Regression analysis.
In both cases, a Linear Regression line of length n is fitted to price data.
I call the first moving average ILRS, which stands for Integral of Linear Regression Slope. One simply integrates the slope of a linear regression line as it is successively fitted in a moving window of length n across the data, with the constant of integration being a simple moving average of the first n points. Put another way, the derivative of ILRS is the linear regression slope. Note that ILRS is not the same as a SMA ( simple moving average ) of length n, which is actually the midpoint of the linear regression line as it moves across the data.
We can measure the lag of moving averages with respect to a linear trend by computing how they behave when the input is a line with unit slope. Both SMA (n) and ILRS(n) have lag of n/2, but ILRS is much smoother than SMA .
Our second benchmark moving average is well known, called EPMA or End Point Moving Average. It is the endpoint of the linear regression line of length n as it is fitted across the data. EPMA hugs the data more closely than a simple or exponential moving average of the same length. The price we pay for this is that it is much noisier (less smooth) than ILRS, and it also has the annoying property that it overshoots the data when linear trends are present.
However, EPMA has a lag of 0 with respect to linear input! This makes sense because a linear regression line will fit linear input perfectly, and the endpoint of the LR line will be on the input line.
These two moving averages frame the tradeoffs that we are facing. On one extreme we have ILRS, which is very smooth and has considerable phase lag. EPMA has 0 phase lag, but is too noisy and overshoots. We would like to construct a better moving average which is as smooth as ILRS, but runs closer to where EPMA lies, without the overshoot.
A easy way to attempt this is to split the difference, i.e. use (ILRS(n)+EPMA(n))/2. This will give us a moving average (call it IE /2) which runs in between the two, has phase lag of n/4 but still inherits considerable noise from EPMA. IE /2 is inspirational, however. Can we build something that is comparable, but smoother? Figure 1 shows ILRS, EPMA, and IE /2.
Filter Techniques
Any thoughtful student of filter theory (or resolute experimenter) will have noticed that you can improve the smoothness of a filter by running it through itself multiple times, at the cost of increasing phase lag.
There is a complementary technique (called twicing by J.W. Tukey) which can be used to improve phase lag. If L stands for the operation of running data through a low pass filter, then twicing can be described by:
L' = L(time series) + L(time series - L(time series))
That is, we add a moving average of the difference between the input and the moving average to the moving average. This is algebraically equivalent to:
2L-L(L)
This is the Double Exponential Moving Average or DEMA , popularized by Patrick Mulloy in TASAC (January/February 1994).
In our taxonomy, DEMA has some phase lag (although it exponentially approaches 0) and is somewhat noisy, comparable to IE /2 indicator.
We will use these two techniques to construct our better moving average, after we explore the first one a little more closely.
Fixing Overshoot
An n-day EMA has smoothing constant alpha=2/(n+1) and a lag of (n-1)/2.
Thus EMA (3) has lag 1, and EMA (11) has lag 5. Figure 2 shows that, if I am willing to incur 5 days of lag, I get a smoother moving average if I run EMA (3) through itself 5 times than if I just take EMA (11) once.
This suggests that if EPMA and DEMA have 0 or low lag, why not run fast versions (eg DEMA (3)) through themselves many times to achieve a smooth result? The problem is that multiple runs though these filters increase their tendency to overshoot the data, giving an unusable result. This is because the amplitude response of DEMA and EPMA is greater than 1 at certain frequencies, giving a gain of much greater than 1 at these frequencies when run though themselves multiple times. Figure 3 shows DEMA (7) and EPMA(7) run through themselves 3 times. DEMA^3 has serious overshoot, and EPMA^3 is terrible.
The solution to the overshoot problem is to recall what we are doing with twicing:
DEMA (n) = EMA (n) + EMA (time series - EMA (n))
The second term is adding, in effect, a smooth version of the derivative to the EMA to achieve DEMA . The derivative term determines how hot the moving average's response to linear trends will be. We need to simply turn down the volume to achieve our basic building block:
EMA (n) + EMA (time series - EMA (n))*.7;
This is algebraically the same as:
EMA (n)*1.7-EMA( EMA (n))*.7;
I have chosen .7 as my volume factor, but the general formula (which I call "Generalized Dema") is:
GD (n,v) = EMA (n)*(1+v)-EMA( EMA (n))*v,
Where v ranges between 0 and 1. When v=0, GD is just an EMA , and when v=1, GD is DEMA . In between, GD is a cooler DEMA . By using a value for v less than 1 (I like .7), we cure the multiple DEMA overshoot problem, at the cost of accepting some additional phase delay. Now we can run GD through itself multiple times to define a new, smoother moving average T3 that does not overshoot the data:
T3(n) = GD ( GD ( GD (n)))
In filter theory parlance, T3 is a six-pole non-linear Kalman filter. Kalman filters are ones which use the error (in this case (time series - EMA (n)) to correct themselves. In Technical Analysis , these are called Adaptive Moving Averages; they track the time series more aggressively when it is making large moves.
What is R-squared Adaptive?
One tool available in forecasting the trendiness of the breakout is the coefficient of determination ( R-squared ), a statistical measurement.
The R-squared indicates linear strength between the security's price (the Y - axis) and time (the X - axis). The R-squared is the percentage of squared error that the linear regression can eliminate if it were used as the predictor instead of the mean value. If the R-squared were 0.99, then the linear regression would eliminate 99% of the error for prediction versus predicting closing prices using a simple moving average .
R-squared is used here to derive a T3 factor used to modify price before passing price through a six-pole non-linear Kalman filter.
What are Dynamic Zones?
As explained in "Stocks & Commodities V15:7 (306-310): Dynamic Zones by Leo Zamansky, Ph .D., and David Stendahl"
Most indicators use a fixed zone for buy and sell signals. Here’ s a concept based on zones that are responsive to past levels of the indicator.
One approach to active investing employs the use of oscillators to exploit tradable market trends. This investing style follows a very simple form of logic: Enter the market only when an oscillator has moved far above or below traditional trading lev- els. However, these oscillator- driven systems lack the ability to evolve with the market because they use fixed buy and sell zones. Traders typically use one set of buy and sell zones for a bull market and substantially different zones for a bear market. And therein lies the problem.
Once traders begin introducing their market opinions into trading equations, by changing the zones, they negate the system’s mechanical nature. The objective is to have a system automatically define its own buy and sell zones and thereby profitably trade in any market — bull or bear. Dynamic zones offer a solution to the problem of fixed buy and sell zones for any oscillator-driven system.
An indicator’s extreme levels can be quantified using statistical methods. These extreme levels are calculated for a certain period and serve as the buy and sell zones for a trading system. The repetition of this statistical process for every value of the indicator creates values that become the dynamic zones. The zones are calculated in such a way that the probability of the indicator value rising above, or falling below, the dynamic zones is equal to a given probability input set by the trader.
To better understand dynamic zones, let's first describe them mathematically and then explain their use. The dynamic zones definition:
Find V such that:
For dynamic zone buy: P{X <= V}=P1
For dynamic zone sell: P{X >= V}=P2
where P1 and P2 are the probabilities set by the trader, X is the value of the indicator for the selected period and V represents the value of the dynamic zone.
The probability input P1 and P2 can be adjusted by the trader to encompass as much or as little data as the trader would like. The smaller the probability, the fewer data values above and below the dynamic zones. This translates into a wider range between the buy and sell zones. If a 10% probability is used for P1 and P2, only those data values that make up the top 10% and bottom 10% for an indicator are used in the construction of the zones. Of the values, 80% will fall between the two extreme levels. Because dynamic zone levels are penetrated so infrequently, when this happens, traders know that the market has truly moved into overbought or oversold territory.
Calculating the Dynamic Zones
The algorithm for the dynamic zones is a series of steps. First, decide the value of the lookback period t. Next, decide the value of the probability Pbuy for buy zone and value of the probability Psell for the sell zone.
For i=1, to the last lookback period, build the distribution f(x) of the price during the lookback period i. Then find the value Vi1 such that the probability of the price less than or equal to Vi1 during the lookback period i is equal to Pbuy. Find the value Vi2 such that the probability of the price greater or equal to Vi2 during the lookback period i is equal to Psell. The sequence of Vi1 for all periods gives the buy zone. The sequence of Vi2 for all periods gives the sell zone.
In the algorithm description, we have: Build the distribution f(x) of the price during the lookback period i. The distribution here is empirical namely, how many times a given value of x appeared during the lookback period. The problem is to find such x that the probability of a price being greater or equal to x will be equal to a probability selected by the user. Probability is the area under the distribution curve. The task is to find such value of x that the area under the distribution curve to the right of x will be equal to the probability selected by the user. That x is the dynamic zone.
Included:
Bar coloring
Signals
Alerts
Loxx's Expanded Source Types

MZ HTF HFT ROCit Bot - Non Repainting Scalper v1.2 ADX RSI MOM This is a new iteration based on my Momentum trading bot.
This is an original script meant to be a high frequency trader that works on higher time frame calculations.
I came up with the idea that using calculus I can figure out the actual rate of change and momentum with different calculations than the momentum indicator that is provided by trading view. Once momentum is shifted on a small time frame, it will provide an entry signal. The script is meant to be used on an algorithmic trading system for scalping purposes. It should be run on a one minute time frame. Unfortunately due to various plotting constraints in Pinescript, you cannot plot the rate of change and momentum and price in the same pane. To counter this, I have a showdata toggle to give you values of the indicators at each entry.
This version has two main entry settings toggled with a checkbox. There is the ROC (rate of change) version and the MOM (momentum) entry signals.
The rate of change version is meant to take a look at your moving average and try to trigger when it hits a certain rate of change point. This can be helpful if you rather play it safer. I have noticed that you can get slightly better entry points but also does not give you as many entries. The momentum algorithm will give you faster entry points and might work best with a slight offset (use your back test to help you figure it out).
I have started to add tooltips to help you along. If you have suggestions please let me know.
How does it work?
Let's just assume that you are looking at a one minute chart. I recommend using the one minute for bots because it will give you the fastest execution for entries. Pinescript has an issue where the signal is not usually sent until the end of the bar/beginning of next bar. If the signal was triggered at the beginning of a 15 minute bar, it might not actually send the signal until the following 15 minute bar. If you are trading on small time frames, this can make all the difference. If you are using an algo platform that trailing stops, stop losse, take profits, etc. I would recommend you use that platform to close your trade. The close trade message will work, but pinescript does not know the exact entry price you received, so if you are trying to collect small profits, it is best that intermediary platform does that calculation for you. If you are dealing with larger moves, instead of small 1-3% scalps, you are probably fine to use the close message setting from pinescript.
Ok, so to take an example. I like to use the 3L and 3S tokens on Kucoin. This gives you a lot of volatility to work with compared to other tokens and coins. However, it can also meas that you are likely taking a higher risk. However, there are some things that can help with that (more on that later).
So we have a token we want to run, and have it on the 1m chart.
First, be sure that all of your filters are OFF when you start playing with the back test. This allows you to see how to best optimize the bot.
Use the show data to show you additional data when you are backtesting. This can allow you to try to filter out results or market conditions that do not work. I typically work with the RSI and use the 30 minute and 15 minute RSIs. I make sure that it is trading within a certain band - about 40-75. You can try the inverse and only buy during really low RSI's as well.
www.dropbox.com
Find the source of your data with the variant drop down. You can use any time frame, open, close. high, low, olc4. Open is pretty much guaranteed to not have any repainting issues - although all the other calcs use a custom isbarconfirmed security repaint calculation. I have been finding that Open and SMA work well, but feel free to explore. If you use a source like open, close, high, low, etc - the interval will not change anything further. If you use a variant such as an sma, you should try to find an interval that works well for that token. For instance, try an sma of 8-11 minutes and see which gives you the best backtest result without changing anything else. Offset ALMA/LSMA parameters are only used for those specific variants. These specific parameters will also affect the ALMA and LSMA if you use that variant in the trend filter. In other words, you can skip these if you are not using those types of moving averages.
www.dropbox.com
Configure the ROC and MOM intervals. If you are using a source such as open, close, etc- this is where you set the interval for your change. So consider using OHLC4 or a interval of 5 thru 15 and see what works best. The Momentum inverval usually works best in the 2-5 bars. There is a custom calculation I added in to try to filter out false entries as momentum is waning. This calculation works best in 2-5 bar interval.
Configure the trigger point and offset. If you are using rate of change, the best settings will likely be between -1 to 0.5. If you are using momentum, you will likely want -20 to 10. This is where you will notice the entries will shift a bit. Try to find a balance between your backtest settings and actually finding what you thin will be the best entries based on a slight delay from trading view, to algo, to your trading platform. This can likely be a minute (maybe even) or so- so be sure to not get too caught up between the backtest results and be sure to finesse the entries to actually fit nicely - maybe a bar earlier than you would likely think. If your entries are coming in too early, you can use the offset to delay your entry by a few bars. This is both science and an art form- don't get too caught up on the back test results as that is based on having all the data tha already transpired, it's not based on how it will actually perform during deployment.
Take profit and stop loss. This should be self explanatory. This script can toggle between static take profit and a trailing profit. For scalping, you will likely want to limit it below 2% to get a good win ratio. Stop loss should be at least 5-6% for these types of 3L/3S tokens to give the strategy some room to move (if the token goes down 2% before it shoots back up, the price will go down 6%). This does not yield the best R/R ratio from a traditional trader perspective, but the statistical probabilities are in your favor for these events will happen. If you have better ideas for how to set this all up, feel free to contribute your ideas in the comments as we can all learn from each other. You can definitely set a much tighter stop loss with a larger take profit to get a lower win rate but in turn might get much better returns. It's all up to you.
FILTERS www.dropbox.com
These filters require you to know a bit about each indicator and how you want to use them. I will only go over the general idea.
Variant Filter - this is especially useful if you want to trade above a moving average. Say for instance you only want to take trades when we are over the 100 Day moving average. Or above a 30 minute, 30 bar EMA, etc. Although originally ported over from my other scripts, this is not a filter that I use often in conjunction with this script.
RSI - perhaps you want to buy when we are below the 30 line on the 30 minute RSI, or we want only want to have the strategy work when we are above the 50 RSI, this can all be configured here. I typically like to try a few different rationales here.
Now with brand NEW ADX filter - this is a brand new idea that seems to work rather well. Based on your ADX settings you can also turn on the "only uptrend" which will try to calculate if you are in an uptrend based on your ADX config. Please keep in mind that uptrend is based relatively on the ADX settings.
- There is a sprinkle of RSI magic in the entry signal to make sure that rsi is not declining in the calculation, so this can affect how many entries you get.
Some other tips:
Forward test.
Set up your algo bot on a one minute interval.
Set up take profit and stop loss on your algo trading platform.
Don't use the exact settings as your backtest, maybe try a slightly more conservative approach from the algo trading platform to make sure you are within range of triggering your events with a slight delay from signal to execution. If you have a 1.6% take profit, perhaps try 1.5% on your platform first.
By using these scripts you agree that you are trading at your own risk. I make no guarantees of returns or results. I just provide tools to help you trade better. However, I hope this ROCit will take you to the moon. And if it does, be sure to give me a shout as well as some tips of your own.
Send me a message with any questions or suggestions.

GRID SPOT TRADING ALGORITHM - GRID BOT TRADING STRATEGYGRID SPOT TRADING ALGORITHM : LONG ONLY STRATEGY OPEN SOURCE
This is a long only strategy for spot assets.
HOW IT WORKS
Grid trading is a trading strategy where an investor creates a so-called "price grid". The basic idea of the strategy is to repeatedly buy at the pre-specified price and then wait for the price to rise above that level and then sell the position (and vice versa with shorting or hedging).
FEATURES
Grids: This algorithm has a total of 10 grids.
Take profit: The trader can increase or decrease the distance between the grids from the User Interface panel, the distance between one grid and another represents the take profit.
Management: The algorithm buys 10% of the capital every time the price breaks down a grid and sells during a rise to the next higher grid. The initial capital is invested in 10 sizes which represent 10% of the capital per trade.
Stop Loss: The algorithm knows no stop loss as long as it is not activated from the User Interface panel. By activating the stop loss from the User Interface panel the algorithm will insert a close condition on all trades which will be calculated from the last lower grid.
Trades: Trades are opened only if the price is within the grid. If the market leaves the grid the algorithm will not buy new positions or sell new positions.
Optimal market conditions: The favorable market for this algorithm is the sideways market.
LIMITATIONS OF THE MODEL
The trader must take into account that this is a static model. It only works perfectly well if the market is in a sideways phase and incurs heavy losses if the market takes a downward trend. The model is unusable for an uptrend. The trader must therefore carefully analyze the market where he intends to use this strategy, making sure that the price is in a sideways phase.
USES
Indispensable research and backtesting tool for those using bots for their investments. The algorithm produces a backtesting of the strategy for past history. It is used by professional traders to understand if this strategy has been profitable on a market and what parameters to use for bots using this strategy (Kucoin, Binance etc.).
If you would like to develop your own algorithm with customized conditions based on a grid strategy, please contact us.
If you need help in using this tool, please contact us without hesitation.

Compound strategyIn this strategy, I looked at how to manage the crypto I bought. Once we have a little understanding of how cryptocurrency is valued, we can manage the coins we have. For example, the most valuable coin in a coin is to sell when it is overvalued and re-buy when it is undervalued. Furthermore, I realised that buying from the right place and selling at the right time is very important to make a good profit. When it says sell, it's divided into several parts.
1. When the major uptrend is over and we are able to make the desired profit, we will sell our holdings outright.
2. Selling in the middle of a down trend and buying less than that amount again
3. When a small uptrend is over, sell the ones you bought at a lower price and make a small profit.
The other important thing is that the average cost is gradually reduced. Also, those who sell at a loss will reduce their profit (winning rate), so knowing that we will have a chance to calculate our loss and recover it. I used this to write a strategy in Trading View. I have put the link below it. From that we can see how this idea works. What I did was I made the signal by taking some technical indicators as I did in the previous one (all the indicators I got in this case were directional indicators, then I was able to get a good correlation and a standard deviation. I multiplied the correlation and the standard deviation by both and I took the signal as the time when the graph went through zero, and I connected it to the volume so that I could see some of the volume supported by it.)
Now let me tell you a little bit about what I see in this strategy. In this I used the compound effect. That is, the strategy, the profit he takes to reinvest. On the other hand, the strategy itself can put a separate stop loss value on each trade and avoid any major loss from that trade. I also added to this strategy the ability to do swing trading. That means we can take the small profits that come with going on a big up trend or a big down trend. Combined with Compound Effect, Stop Loss and Swing Trading, I was able to make a profit of 894% per annum (1,117.62% for 15 months) with a winning rate of 80%. Winning rate dropped to 80% because I added stop loss and swing trading. The other thing is that I applied DCA to this in both the up trend and the down trend (both). That was another reason for me to make a good profit. The orange line shows how to reduction of costly trade. The yellow line shows the profit and you can see that the profit line does not go down during the loss trades. That's because I want to absorb the loss from that trade.
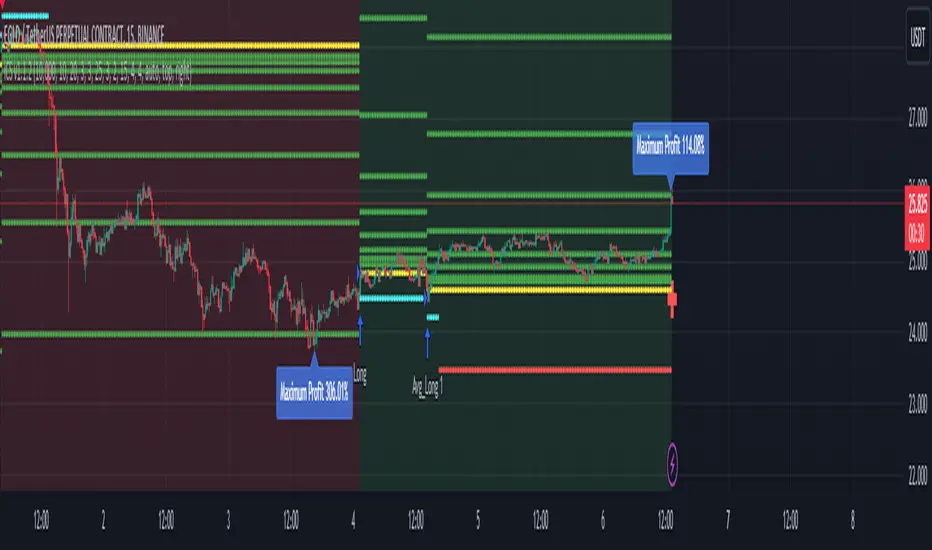
iCryptoScalperHi everyone!
In this post I would like to present my personal indicator for short-term strategies on cryptocurrencies called iCryptoScalper , but let me first introduce myself:
I am a theoretical physicist with a deep passion for trading and mathematical modelling of the financial markets.
I started trading cryptocurrencies more than 4 years ago and, throughout this period, I got more and more involved in trying to describe the mechanisms governing
the price action at lower timeframes like 1, 5 and 15 minutes.
As a beginner, I started with the usual "buy and hold" strategy, the safest but also boring option. Afterthat, I tried to get more involved on speed trading
and scalping and, as it happens to all the beginners, I went through many mistakes.
At the beginning, trying to find the best scalping strategy, was a very difficult task and I barely managed to perform well, mostly because every trade were overwhelmed
by my emotional approach and the fear of missing the right entry point and/or exit point. However, thanks to these difficulties, I understood that I needed
an algorithmic procedure to improve my performances and overtake the emotional approach, with a more technical approach: a mathematical guide that precisely tells me how to behave in the best way possible to be profitable.
To achieve this goal, I put all my efforts in trying to write a consistent mathematical model able to give me all the statistical informations I needed to reach
the best performances and, of course, the best possible profits.
The iCryptoScalper is an explicit mathematical tool to be used for scalping strategies and optimized for different cryptocurrency pairs on 15/30 min timeframes.
The script gives you many useful informations and details regarding the current and subsequent trade, accompanied with a detailed overview on both the last 20 short
and long trade results.
Let us have a look to all the detailed informations the script shows to you:
CHART
- Lines: The script plots for you the Entry price (yellow line), the Stop Loss price (red line) and a series of 8 Take Profit levels (green lines).
- Background: The green background color indicates that the script is in a long position, viceversa, the red background color indicates that the script is in a short position.
- Labels: The blue labels indicate the maximum achieved profit for each trade.
- Alerts: The script shows two types of alerts, the "prepare to #" one and the true entry one. The prepare alert is very useful to understand when the strategy is going
to enter a specific trade, thus giving you the possibility to set up all the necessary Entry/SL/TP levels on your favorite trading platform.
- Crosses: The green and red crosses are precisely located at the corresponding long and short entry price for the next trade, thus giving you a preview on the target price
that has to be reached for the indicator to enter. They are computed thanks to a mathematical model I set up and optimized for each cryptocurrency pair.
PANEL
- Overview: This part shows you two probability tables for the last 20 long and short trades each. The first table indicates the set of probabilities of reaching the corresponding TP level, whereas the second table shows the conditional probability , namely the probability of reaching a certain profit level once the previous one has been achieved.
Below the tables you can find three quantities again referring to the last 20 long and short trades: the Average Maximum Profit , the Average Maximum Drawdown and the Average Risk/Reward Ratio .
Last but not least, the correlation between the current asset and BTC is displayed together with the current BTC status.
- Active Trade: This part collects all the data related to the current trade status.
- Next Trade: This part collects all the data related to the next trade status.
ATTENTION!
Please notice that the equity line you see in the "Strategy Tester" section of TradingView is unreliable compared to the real performances of the script. This is due to the
fact that the TradingView engine is designed for backtesting automatic trading strategies and not real-time trading bots.
An example is the following: Bob buys 1 BTC-PERP contract at 10000$, setting the Stop Loss at 9000$. The price of the perpetual then goes to 12000$ and then go back hitting the Stop Loss. For the TradingView Engine this is a
trade with a permanent loss of 1000$. However, for the iCryptoScalper users, the trade is perfectly fine thanks to the numerous TP levels (and corresponding probabilities) given by the script within the trade window.
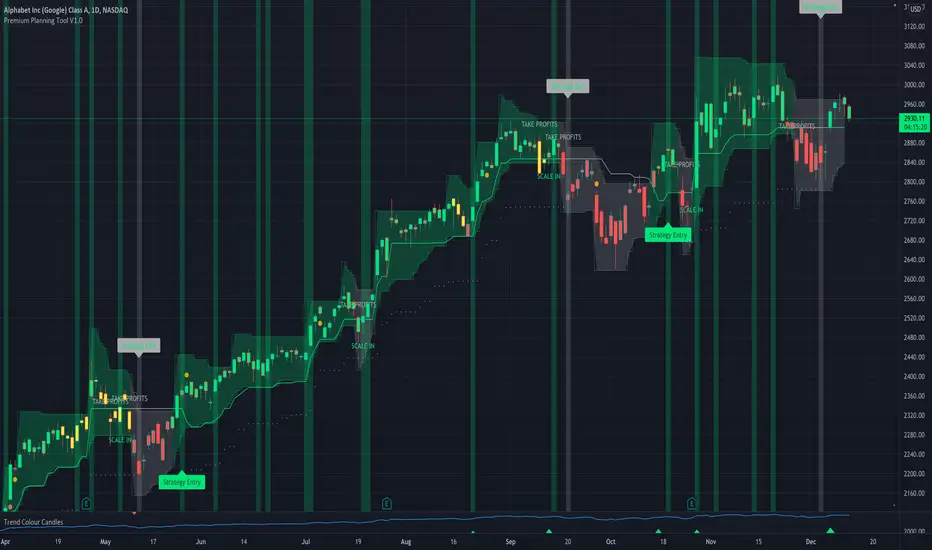
Premium Planning Tool V1.0Background to the tool
The tool was built out of frustration. Having traded for many years with a reasonable level of success I was always frustrated that my trading never went up a level. The world of trading is filled with people having so much more success than me and this level of FOMO really bothered me and resulted in inconsistency and countless hours sitting in front of a screen, hoping for the best. I also became a little bit of an indicator junkie - was there a holy grail indicator out there for me? I always felt that as a retail trader I was behind the curve. I started to investigate how the major market participants trade and make money and I was astounded at the level of success that they get from creating strategies and sticking to it. The market is driven largely by a "black boxes" which, for us retail traders are outside of our ability to access. I wanted to build a tool that could give me a traders edge.
Another factor that has always bothered me was when reading investing books there is a general assumption that a standard entry, say 8/13 cross over, works on all stocks. However, it is not the case and it can be frustrating for a trader using a set up and not realizing that the set up is the problem, not the trader. This realization alone has made a huge impact on my trading. The big boxes that control the market know this already.
Also, a lot of indicators that are available don’t take advantage of the backtesting capability provided in Tradingview. It is fairly simple to find 8-9 trades where a set up worked and then fall into the trade of assuming that it cannot fail. Knowing which set ups work and how frequently it will print will change the way that you trade.
The goal with the tool is to identify setups that have worked in the past with a high degree of profitability, high profit factor and low drawdown and using the planning tool allows you to customize the setup to find exactly what you are looking for across any tradeable asset on TradingView.
Over the past 20 years I have realized the following:
1) Not all entries and signals work the same on all stocks
2) Not having a plan in advance lowers your probability of success
3) Developing consistency in analysis is critical
4) Developing confidence in your own plan is more important than whose trades you try to copy
5) Having 30 indicators does not help you trade better - it leads to more frustration
So here is the product of these realisations:
1) The tool looks across the most common entry strategies (MA cross on 5 dimensions of type and 5 common crossovers) and can be used on 19 different time frames giving you guidance on what the best set up is for the stock you are analysing
2) It incorporates volatility into the strategy – when stocks are trading outside of a predetermined volatility band, a trade will not be entered. This accommodates traders who tend to get shaken out of trades too early.
3) It looks at the impact of “buying the dip” – often a common strategy employed by many traders which now can be backtested and reviewed to see if it actually helped or hindered the trade.
4) It measures your trade plan against your R – what you are willing to risk – and calculates your target profit based on your R multiple
5) It provides a non repaint signal on your base strategy and provides you with signals to trade smaller or shorter signals within the bigger strategy.
There are some additional visual tools:
• Squeeze signals - I am a big fan of the TTM squeeze however the Squeeze by itself can be hard to trade. Seeing a squeeze fire long on a chart can add to trade confidence.
• Seeing zones of support and resistance rather than single lines can also give you some leeway in terms of not getting pushed out of a trade too soon.
The backtester is always reviewed on a 2 to 3 year period to get an understanding of win rate %, profit ratio and average duration of trade. As an option trader knowing that a high probability move is playing out allows me to make sure that I don’t undercut the time frame for the expiration of the option relative to the historical average duration of a trade. Backtesting on shorter times is unrealistic.
Key benefits
1) It saves me a ton of time. I don’t have to sit in front of a screen watching ticks each day. I can plan for an entry, set an alert for a trade and when the conditions are met the TradingView system sends me a message and I will go and confirm a trade, execute it, set my alerts for control and move on with my life.
2) It allows me to review trade ideas in a consistent manner using the best trade plan and set up for a stock.
3) It forces me to be patient and not panic (always a good thing). With an adjustable volatility feature I can modify the volatility band in the trade plan to accommodate choppy market conditions.
4) It looks at both sides of the market (long and short) and you can calculate the impact of being market neutral or having a directional bias.
The setup is based on a reversal set up and we are doing a single entry trade here with a base of 4ATR stop using a long call or a bull call debit spread and allowing GOOGL to trade on a 1ATR price band on a daily basis. This strategy has only generated 10 signals since 2018 however it has been profitable 87.5% of the time with a profit factor of 25.26. Personally, on signals with this degree of strength I will trade a long stock purchase on a STRATEGY ENTRY signal and I will look to trade shorter duration option trades (both debit and credit spreads) on the trend signals INSIDE the major buy signal.
As a high probability set up you can trade this signal by itself or you can trade the trend inside the signal which will trigger at 2966. Either way, set your alerts and get on with your life.
I hope this tool helps you to achieve some degree of peace in your trading.
To get access to the tool, please contact the author.
Double SupertrendThis strategy is based on a custom indicator that was created based on the Supertrend indicator. At its core, there are always 2 super trend indicators with different factors to reduce market noise (false signals).
The strategy/indicator has some parameters to improve the signals and filters.
TECHNICAL ANALYSIS
☑ Show Indicators
This option will enable/disable the Supertrend indicators on the chart.
☑ Length
The length will be used on the Supertrend Indicator to calculate its values.
☑ Dev Fast
The fast deviation or factor from one of the super trend indicators. This will be the leading indicator for entry signals, as well as for the exit signals.
☑ Dev Slow
The slow deviation or factor from one of the super trend indicators. This will be the confirmation indicator for entry and exit signals.
☑ Exit Type
It's possible to select from 4 options for the exit signals. Exit signals always take profit target.
☑ ⥹ Reversals
This option will make the strategy/indicator calculate the exit signals based on the difference between the given period's highest and lowest candle value (see Period on this list). It's displayed on the chart with the cross. As it's possible to verify in the image below, there are multiple exit spots for every entry.
☑ ⥹ ATR
Using ATR as a base indicator for exit signals will make the strategy/indicator place limit/stop orders. Candle High + ATR for longs, Candle Low - ATR for shorts. The strategy will show the ATR level for take profit and stick with it until the next signal. This way, the take profit value remains based on the candle of the entry signal.
☑ ⥹ Fast Supertrend
With this option selected, the exit signals will be based on the Fast Supertsignal value, mirrored to make a profit.
☑ ⥹ Slow Supertrend
With this option selected, the exit signals will be based on the Slow Supertsignal value, which is mirrored to take profit.
☑ Period
This will represent the number of candles used on the exit signals when Reversals is selected as Exit Type. It's also used to calculate the gradient used on the Fills and Supertrend signals.
☑ Multiplier
It's used on the take profit when the ATR option is selected on the Exit Type.
STRATEGY
☑ Use The Strategy
This will enable/disable the strategy to show the trades calculations.
☑ Show Use Long/Short Entries
Option to make the strategy show/use Long or Short signals. Available only if Use The Strategy is enabled
☑ Show Use Exit Long/Short
Option to make the strategy show/use Exit Long or Short signals (valid when Reversals option is selected on the Exit Type). Available only if Use The Strategy is enabled
☑ Show Use Add Long/Short
Option to make the strategy show/use Add Long or Short signals. With this option enabled, the strategy will place multiple trades in the same direction, almost the same concept as a pyramiding parameter. It's based on the Fast Supersignal when the candle fails to cross and reverses. Available only if Use The Strategy is enabled
☑ Trades Date Start/End
The date range that the strategy will check the market data and make the trades
HOW TO USE
It's very straightforward. A long signal will appear as a green arrow with a text Long below it. A short signal will appear as a red arrow with a text Short above it. It's ideal to wait for the candle to finish to validate the signal.
The exit signals are optional but give a good idea of the configuration used when backtesting. Each market and timeframe will have its own configuration for the best results. On average, sticking to ATR as an exit signal will have less risk than the other options.
☑ Entry Signals
Follow the arrows with Long/Short texts on them. Wait for the signal candle to close to validate the entry.
☑ Exit Signals
Use them to close your position or to trail stop your orders and maximize profits. Select the exit type suitable for each timeframe and market
☑ Add Entries
It's possible to increase the position following the add margin/contracts based on the Add signals. Not mandatory, but may work as reentries or late entries using the same signal.
☑ What about Stop Loss?
The stop-loss levels were not included as a separated signal because it's already in the chart. There are some possible ideas for the stop loss:
☑⥹ Candle High/Low (2nd recommend option)
When it's a Long signal from the entry signal candle, the stop loss can be the Low value of the same candle. Very tight stop loss in some cases, depending on the candle range
☑⥹ Local Top/Bottom
Selecting the local top/bottom as stop loss will give the strategy more room for false breakouts or reversals, keeping the trade open and minimizing noises. Increases the risk
☑⥹ Fast Supertrend (1st recommend option)
The fast supertrend can be used as stop-loss as well. making it a moving level and working close to trail stop management
☑⥹ Fixed Percentage
It's possible to use a fixed risk percentage for the trades, making the risk easier to control and project. Since the market volatility is not fixed, this may affect the accuracy of the trades
☑⥹ Based on the ATR (3rd recommend option)
When the exit type option ATR is selected, it will display the take profit level for that entry. Just mirror that value and put it as stop-loss, or multiply that amount by 1.5 to have more room for market noise.
EXAMPLE CONFIGURATIONS
Here are some configuration ideas for some markets (all of them are from crypto, especially futures markets)
BTCUSDT 15min - Default configuration
BTCUSDT 1h - Length 10 | Dev Fast 3 | Dev Slow 4 | Exit Type ATR | Period 50 | Multiplier 1
BTCUSDT 4h - Length 10 | Dev Fast 2 | Dev Slow 4 | Exit Type ATR | Period 50 | Multiplier 1
ETHUSDT 15min - Length 20 | Dev Fast 1 | Dev Slow 3 | Exit Type Fast Supertrend | Period 50 | Multiplier 1
IOTAUSDT 15min - Length 10 | Dev Fast 1 | Dev Slow 2 | Exit Type Slow Supertrend | Period 50 | Multiplier 1
OMGUSDT 15min - Length 10 | Dev Fast 1 | Dev Slow 4 | Exit Type Slow Supertrend | Period 50 | Multiplier 1
VETUSDT 15min - Length 10 | Dev Fast 3 | Dev Slow 4 | Exit Type Slow Supertrend | Period 50 | Multiplier 1
HOW TO FIND OTHER CONFIGURATIONS
Here are some steps to find suitable configurations
select a market and time frame
enable the Use This Strategy option on the strategy
open the strategy tester panel and select the performance summary
open the strategy configuration and go to properties
change the balance to the same price of the symbol (example: BTCUSDT 60.000, use 60.000 as balance)
go back to the inputs tab and keep changing the parameters until you see the net profit be positive and bigger than the absolute value of the drawdown
in case you can't find a suitable configuration, try other timeframes
Since the tester reflects what happened in the past candles, it's not guaranteed to give the same results. However, this indicator/Strategy can be used with other indicators as a leading signal or confirmation signal.

Bollinger Bands And Aroon Scalping (by Coinrule)Many technical indicators can be profitable in certain market conditions while failing in others. No indicator is perfect alone.
All the best trading strategies involve multiple indicators and leverage the benefit of each of them. The following is an optimised strategy based on Bollinger Bands and the Aroon indicator.
The Bollinger Bands are among the most famous and widely used indicators. They can suggest when an asset is oversold or overbought in the short term, thus provide the best time for buying and selling it.
A strategy buying dips can work well during times of uptrend. Downtrends will result in a drawdown for the P&L of the strategy. The suggested approach minimises the drawdowns, ensuring that the system trades only when it's more likely to close the trade in profit.
The Setup
ENTRY
The price crosses below the basis line of the Bollinger Band indicator
The Aroon Indicator is above 90
EXIT
The price crosses below the upper Bollinger Band
The Aroon Indicator drops below 70
The Aroon Indicator plays a key role in this strategy. It acts as a confirmation that the asset is currently in an uptrend. On the other hand, it acts as a stop if market conditions deteriorate. The strategy uses an Aroon Indicator set to 288 periods to provide a longer-term view on market conditions, not being heavily dependent on short-term volatility.
The best time frame for this strategy based on our backtest is the 4-hr . The 1-hr can work well with three times more trades, on average. As trades increase, the profitability decreases. Yet again, this is the confirmation that trading more does not mean gaining more.
To make the results more realistic, the strategy assumes each order to trade 30% of the available capital. A trading fee of 0.1% is taken into account. The fee is aligned to the base fee applied on Binance, which is the largest cryptocurrency exchange.

Chaikin Money Flow + MACD + ATRHere I present you on of Trade Pro's Trading Idea: Chaikin Money Flow + MACD + ATR.
This strategy is not as profitable as it can be seen in one of his videos. In the forex market, the strategy could reach a maximum of 35% profitability.
I have, as some of my followers have requested, created an overview of the current position, risk and leverage settings in the form of a table.
Furthermore, one can again swap between short and long positions.
It is now possible to select or deselect individual indicators.
I have chosen the ATR alone as a take profit stop loss, as in his strategy.
A position is only triggered as soon as all prerequisites have been fulfilled and a command is executed. This prevents false triggering by bots and repainting.
-----------------------------------------------------------------------------------
How does the strategy work?
ENTRY
Long
The MACD indicator must be above the zero line.
Then the K line must cross the D line.
Finally, when this happens, the Money Flow Index must be above the zero line.
Short
Contrary to the premise of long positions.
EXIT
ATR Exit
The value of ATR at the time of buying is multiplied by the value entered in "Profit factor ATR" and "Stop factor ATR". As soon as the price reaches this value, it is closed.
Important
The script must be optimized for each coin or currency pair.
I will publish a guide to the strategy shortly. There I will explain how the table works and how to set the strategy correctly.
The results of the strategy are without commissions and leverage.
If you have any questions or feedback, please let me know in the comments.

SSP + VWMAInput menu allows you to set long / short entries using,
Net volume change from above or below zero.,
Net volume changes of positive to negative values,
VWAP rising or falling.
VWMA rising or falling
Stop loss and take profit are built in to test the most profitable strategy.
uncheck net volume in menu bar to remove background colours on chart
Uncheck VWAP and VWMAto test long and short entries ( using net volume change ) note session look back is available to edit, if use take profit is unchecked then this will simulate net volume change from positive to negative.
Check VWMA or VWAP to simulate long or short entries
With VWAP checked this will simulate VWAP entries with rising / falling VWAP with previous take profit and stop losses that we’re profitable.

Backtest Service Program (BASE) [FAF-Software-Solutions]{Deutsche Beschreibung folgt der englischen Beschreibung}
█ OVERVIEW
With BASE you can quick and easy create, test or optimize seasonal trading strategies. Seasonality is a strong, if not the strongest, trading approach to making money in the capital markets over the long term. Whether individually or in combination with other strategies, seasonality is a tool for your trading that should not be underestimated.
We have packed this script with everything you need for a meaningful seasonal analysis. Define entry and exit times according to day of the week, day of the month and the month itself, very easily via the settings window. Determine the period to be evaluated and, if desired, add a stop loss and / or a take profit to add a healthy risk and money management to your strategy. Since this is a pine strategy script, the usual trading view strategy parameters such as account size, commission, slippage, etc. are also available and you can set up your backtest even more realistically and therefore more truthfully.
Would you like to evaluate the behavior of a certain share over the turn of the year, would you like to find out which day of the week in gold has been the most profitable over the past 50 years or just check the "Sell in May" effect? This is exactly what we created this script for. With just a few clicks you can evaluate approaches such as the "Sell in May" effect or the "Santa Claus Rally", you can check which day of the week, which day of the month or which month is the strongest in an instrument and develop individual strategy systems from this.
█ FEATURES
The script input window has the following setting options:
• Backtest start / Backtest end: Set your Backtast Range here.
• Trade direction: Decide whether your strategy should open buy or sell positions.
• Pyramiding Indicates how many positions can be open at the same time (maximum 10 positions)
• Stop Loss / Take Profit: In order to optimize your strategy, you have the option of adding profit and loss levels (visible in the chart) to your open positions.
This enables you to adapt your trading system to your risk and money management. The stop and take profit levels are freely selectable.
• Entrys / Exits: Divided into days of the week, days of month and months itself, you can individually choose when you want to open and close a position.
• Advanced Filter: Seasonally, the 4-year election cycle of the US presidential election has a strong impact on the markets.
In order to be able to develop analyzes in connection with this cycle, there is an advanced filter to be able to filter the different election years.
█ HOW TO USE
After the script has been added to the chart, the input window opens immediately and you can easily select your strategy parameters. After confirming your selection, all trades will be added to the chart and you will find the key metrics for your system in the Tradingview Strategy Tester. If you have added a stop or profit level, you can also see this graphically in the chart and thus analyze every trade in the chart very precisely.
The entry and exit fields can be selected individually to be activated. If no selection is made, e.g. no selection for the weekday entry, then there is no longer any filtering and entry / exit is possible on any weekday. As soon as a selection is made under the entry / exit parameters, the system filters according to the criteria made during the selection. A position is always opened / closed at the closing price (close) of the candle, at which all selected criteria match.
█ LIMITATIONS
This script is just a tool for your trading. You dont receive any finished trading strategy or backtest, but a program with which you can create and optimize your own seasonal trading strategies without any programming knowledge.
This script was developed for seasonal back tests over a long history and therefore works best in a time resolution greater than or equal to the daily chart (1D).
█ IMPORTANT
The strategy results shown here were made with the default script settings in the SPX symbol. In order to test the pure seasonality, no slippage and commission are included in the default inputs. By default, 100% of the capital is used to open a position. These settings allow a quick check of seasonality without the distortion from commissions, slippage or margin calls, but to get a real strategy you need to add these things later. If you have identified a seasonal phase and want to build a trading strategy from it, you have to add realistic commission and slippage and adjust the positionsize. The backtesting results shown here are chosen randomly and are not a real strategy. The strategy key metrics are therefore not relevant and the chart is only used to illustrate the script design
Use the link below to get more information
═════════════════════════════════════════════════════════════════════════
█ ÜBERSICHT
Mit der BASE kannst Du schnell und unkompliziert saisonale Handelsstrategien erstellen, testen oder optimieren. Die Saisonalität ist ein starker, wenn nicht sogar der stärkste Handelsansatz, um langfristig Geld an den Kapitalmärkten zu verdienen. Ob nun einzeln oder in Kombination mit anderen Strategien, die Saisonalität ist ein nicht zu unterschätzendes Hilfsmittel für deinen Handel.
Dieses Skript haben wir mit allem vollgepackt was du für eine aussagekräftige saisonale Auswertung benötigst. Definiere Ein- und Ausstiegszeitpunkte nach Wochentag, Tag des Monats und dem Monat selbst, ganz einfach über das Einstellungsfenster. Bestimme den auszuwertenden Zeitraum und ergänze wenn gewünscht einen Stop Loss und/oder einen Take Profit um deiner Strategie ein gesundes Risiko- und Moneymanagement hinzuzufügen. Da es sich hierbei um ein Pine-Strategieskript handelt stehen Dir die üblichen Tradingview Strategieparameter wie Kontogröße, Kommission, Slippage usw. ebenfalls zur Verfügung und Du kannst deinen Backtest noch realistischer und damit auch wahrheitsgemäßer aufstellen.
Du möchtest das Verhalten einer bestimmten Aktie über den Jahreswechsel auswerten, möchtest herausfinden welcher Wochentag in Gold über die letzten 50 Jahre der profitabelste war oder einfach mal eben den "Sell in May" Ansatz überprüfen? Genau hierfür haben wir dieses Skript erstellt. Mit wenigen Klicks kannst Du Ansätze wie den "Sell in May" Effekt oder die "Santa Claus Rally" auswerten, kannst prüfen welcher Wochentag, welcher Tag des Monats oder welcher Monat der stärkste in einem Instrument ist und daraus ganz individuelle Strategie-Systeme entwickeln.
█ EIGENSCHAFTEN
Das Eingabefenster des Skripts hat folgende Einstellungsmöglichkeiten:
• Backtest start / Backtest end: Hier legst Du fest für welchen Zeitraum dein Backtest erstellt werden soll.
• Trade direction: In diesem Feld wird bestimmt ob die Positionen in Long- oder Short-Richtung eröffnet werden sollen.
• Pyramiding Gibt an wie viele Positionen zu selben Zeit offen stehen können (maximal 10 Positionen möglich)
• Stop Loss / Take Profit: Um deine Strategie optimieren zu können hast Du die Möglichkeit Gewinn- und Verlustlevel (sichtbar im Chart) zu deinen offenen Positionen hinzuzufügen.
Dadurch ist es Dir möglich dein Handelssystem an dein Risiko- und Moneymanagement anzupassen. Die Stop Loss und Take Profit Level sind frei wählbar.
• Entrys / Exits: Unterteilt in Wochentage, Kalendertage und Monate kannst Du hier ganz individuell auswählen zu welchem Zeitpunkt Du eine Position eröffnen und schließen möchtest.
• Advanced Filter: Saisonal betrachtet beeinflusst der 4-jährige Wahlzyklus der US-Präsidentschaftswahlen die Märkte stark.
Um Analysen im Zusammenhang mit diesem Zyklus entwickeln zu können gibt es hierfür einen erweiterten Filter um die verschiedenen Wahljahre filtern zu können.
█ ANWENDUNG
Nachdem das Skript auf den Chart aufgerufen wurde öffnet sich sofort das Eingabefenster in welchem Du deine Strategieparameter auswählen kannst. Nach dem Bestätigen der Auswahl kannst du sofort deine Trades auf dem Chart erkennen und hast über den Tradingview Strategie-Tester die Auswertung zu deinem System vorliegen. Wenn du ein Stop Loss oder Take Profit Level hinzugefügt hast kannst Du auch dieses grafisch auf dem Chart erkennen und so jeden Trade im Chart ganz genau analysieren.
Die Entry und Exit Felder können einzeln angewählt und somit aktiviert werden. Ist in einer Reihe wie beispielsweise den Wochentagen keiner der Tage ausgewählt so wird nicht mehr nach den Wochentagen gefiltert und ein Einstieg/ Ausstieg ist zu jedem Wochentag möglich. Sobald unter den Entry/ Exit Parametern eine Auswahl getroffen wird filtert das System nach den in der Auswahl getroffenen Kriterien. Es wird immer zum Schlusskurs (Close) der Kerze eingestiegen bei der alle ausgewählten Kriterien übereinstimmen.
█ EINSCHRÄNKUNGEN
Dieses Skript stellt ausschließlich ein Hilfsmittel für deinen Handel dar. Du erhältst keine fertigen Handelsstrategien oder Backtests sondern ein Tool mit welchem Du ohne Programmierkenntnisse in der Lage bist eigene saisonale Handelsstrategien zu erstellen und zu optimieren.
Das Skript wurde für saisonale Backtests über eine lange Historie entwickelt und arbeitet daher am besten in den Zeitfenstern größer oder gleich dem Tageschart (1D).
█ WICHTIG
Die hier gezeigten Strategieergebnisse wurden mit den Standard-Skripteinstellungen im SPX-Symbol erstellt. Um die reine Saisonalität zu testen, sind in den Standardeingaben keine Slippage und Provision enthalten. Standardmäßig wird 100% des Kapitals verwendet, um eine Position zu eröffnen. Diese Einstellungen ermöglichen eine schnelle Prüfung der Saisonalität ohne Verzerrungen durch Provisionen, Slippage oder Margin Calls. Um eine handelbare Strategie zu erhalten müssen die Angaben zu Slippage, Kommission und Positionsgröße aber später unbedingt ergänzt werden. Die hier gezeigten Backtesting-Ergebnisse wurden zufällig ausgewählt und sind keine echte Strategie. Die Strategiekennzahlen sind daher nicht relevant und das Chartbild dient nur zur Veranschaulichung des Skriptdesigns
Verwende den untenstehenden Link für mehr Informationen
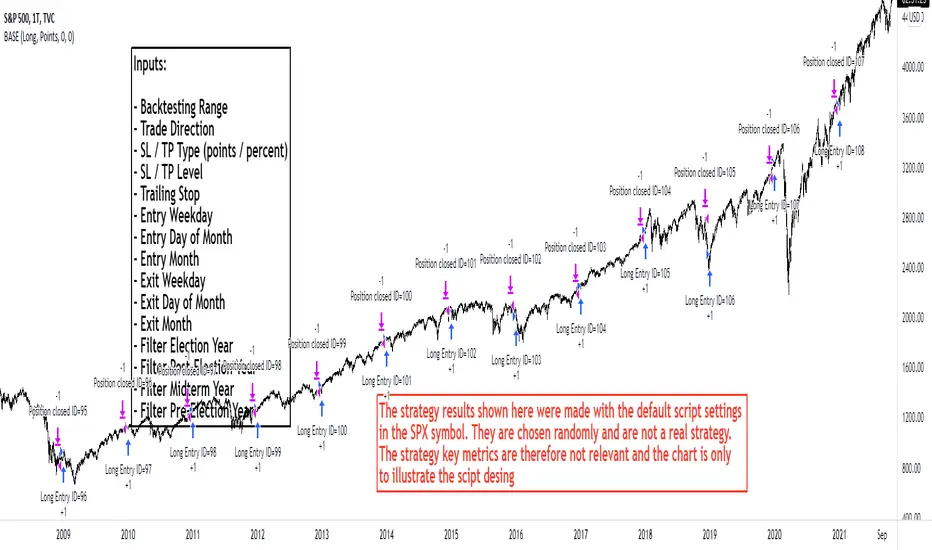
RSI Strategy w/ Trailing SL / TP Optimized for Crypto [Strategy]This strategy is designed to use the RSI and EMA filters. A 200 period EMA is used for short / long filters, and the 50 period EMA is used to determine the direction of the short term trend.
In addition, the script uses "rate of change" for the fast EMA (trend), volume , RSI (momentum), and price (volatility) and only takes trades when all are in optimal conditions.
I.E., the EMA is in an uptrend, the volume is increasing, price is in an uptrend, and the RSI is in an uptrend, so we will place a Long trade.
This strategy uses EMAs as a trailing stop loss and take profit. As this is a trend following strategy, the idea is to maximize profits when correct and minimize losses when
wrong.
It was designed specifically using crypto pairs, and was optimized for the 10 minute chart.
My goal was to get the best use out of the RSI indicator. I was originally an MACD fanboy, but have recently converted.
Want to help me improve this code or strategy? Have suggestions for improvement? Leave them in the comments below.
Thanks for using my script! I hope it works well for you and good luck in the markets.
If you have any questions, please leave them in the comments and I'll do my best to respond.
This script does not repaint as it only relies on close data to make a decision to enter a trade.
How to use this strategy:
___________________________
Enable Long Entries? - Used to enable or disable the strategy from executing long entries.
Enable Short Entries? - Used to enable or disable the strategy from executing short entries.
How Many Bars To Look Back for Hi/Lo: - This is used for the Stop Loss and Take Profit targets. An integer of bars is used to look back and calculate the values.
RSI Length (Rec: 8) - The length of the RSI
Source - The RSI Source
Use Slow EMA? - If checked, a 200 period EMA will be used to filter entries long or short (only take shorts when the price is below, long when above). In addition, the script will close any trades that cross the 200 period EMA. By default this is disabled.
EMA Slow - the period of the Slow EMA (200 by default)
EMA Slow Src - what to use to calculate the Slow EMA (high by default)
EMA Fast - The Fast EMA (50 period) is used to calculate the direction of the short term trend. This also factored into the Rates of Change.
EMA Fast Src - what to use to calculate the Fast EMA
ATR Length - If used, the ATR length is used to calculate the Stop Loss and Take Profit targets.
SL Multiplier - The distance away from the initial value to multiply the Stop Loss
TP Multiplier - The distance away from the initial value to multiply the Take Profit.
Use EMA as SL / TP? - If true (default) a 3 period EMA is used to calculate Stop Loss and Take Profit targets. Else, an ATR is used to calculate these values.
Stop Loss / Take Profit Offset - Default: 3 - this is used to shift the EMA / ATR Stop Loss and Take Profit lines to the right X bars. This is to ensure that they are hit properly and not exceeded.
Short Len Vol - Use to calculate the volume of the short length, used in rate of change calculations
Long Len - Use to calculate the volume of the long length, used in rate of change calculations
RSI Long Entry Val - Minimum RSI crossover value to enter a trade Long. If the RSI is below this value, trade entries are not valid.
RSI Long Cutoff Threshold - Long entry RSI value cutoff to no longer enter trades. If the RSI is above this value, trades entries are not valid.
RSI Short Entry Val - Minimum RSI crossover value to enter a trade Short. If the RSI is above this value, trade entries are not valid.
RSI Short Cutoff Threshold - Short entry RSI value cutoff to no longer enter trades. If the RSI is below this value, trades entries are not valid.
ROC Fast EMA - Calculates the rate of change between the Fast Ema now and 'X' bars ago. \n\n For a long entry, a positive value is needed, and for a short entry, a negative value is needed.
ROC Price - Calculates the rate of change between the most recent price close and 'X' bars ago. \n\n For a long entry, a positive value is needed, and for a short entry, a negative value is needed.
ROC RSI - Calculates the rate of change between the RSI now and 'X' bars ago. \n\n For a long entry, a positive value is needed, and for a short entry, a negative value is needed.
Use Close for SL - Default = Off - If checked, when a candle hits the stop loss, the trade will close on the next candle. If unchecked, the trade will remain open until the candle closes at or beyond the stop loss lines.
Custom Message Boxes - Primarily used for bots, but can be used to also insert your own messages for your trading alerts.

FCMS - Time in x Timing - The Market - StudyTime in x Timing - The Market
█ DISCLAIMER
THIS IS NOT AN INVESTMENT ADVICE
The use of strategy functions doesn't compile recurring investments/contributions as used in this study, so disregard the results of the strategy tester.
As seen in the style/plots lists, I calculate the results in internal variables to analyze historical results.
prnt.sc
Anyway, this is only a historical study and past performance is no guarantee of future results
█ CONCEPTS
There is a discussion about Timing x Time in the market.
The point of this discussion is between buying in the better moment, against exposing yourself to the market as soon as possible.
Anyone who argues that the most important factor is the time exposed to the asset, no matter when, is usually based on the SP500 asset.
As shown in the image above, a hypothetical investor who made a single investment of US $ 1500.00 in December 1999, was trapped by a volatility of approximately 10% in the period, followed by a loss of around 50% in the following years. In December 2012, this investment was finally positive, and after 20 years it accumulated a gain of 180% - without reducing inflation in the period.
█ Timing the news
When an asset reaches a new historic high, the idea of "time in the market is the best strategy" gains momentum, after all, at this "moment" everyone previously exposed to the asset is making a profit, regardless of inflation or any benchmark.
█ Time in the market
Considering using this strategy, we can define 3 points for a brief analysis:
1. Asset
SPX is used as a reference for this type of statement due to the difficulty of finding another one with such consistency, liquidity, ease of access and time of history.
2. Long Term
We cannot consider it a long term strategy, as it never has a predetermined term
3. Recurring contributions.
To generate an average cost spread over periods of high and low, opening the possibility to realize positions with profit in eventual needs.
As shown in the image below, if this hypothetical investor made monthly contributions since the date of the first contributions, he would have the possibility of making profits between the period from October 2004 to September 2008, returning to the loss until October 2010, and then with a profit of 100% over the total amount invested.
Below, an example of an asset in a downtrend with the final balance returning below the total volume invested.
█ First Conclusion
> Recurring contributions (3) to an asset (1) during a downtrend will increase the loss for an indefinite period (2).
> Recurring contributions (3) to an asset (1) during an uptrend are more important than immediate exposure to the asset, regardless of the term (2).
> Recurring contributions (3) in an asset (1) in a region of possible long-term top (2), will negatively affect profitability even considering the resumption of the upward trend in an indefinite period.
█ Timing the market
As shown in the image below, following the strategy above: a single contribution in the amount of US$ 1000.00 at the worst moment (Dec / 2017), the hypothetical investor would have hold a loss of over 80%. At the moment it accumulates 89% of profit, having reached the maximum of 200% at the beginning of the year.
By making monthly contributions since the date of the first contribution, this investor would have the possibility to make profits from May 2019, accumulating 335% profit at the moment.
Adding the condition of buying the maximum cost of 10% above the average price of the last 200 days, the final result is little affected, and reduces losses in the initial investment period.
Adding the condition of taking profit of 50% of the position when the price is above the average of the last 200 days, and reinvesting 50% of the cash obtained in the next purchase opportunity (paying a maximum of 10% above the average of the last 200 days), the profit cumulative final price drops to 270%, but the realized profit already exceeds the total amount invested, which eliminates future risk of the operation. (favorable risk-return ratio)
Adding the condition to reinvest 50% of the cash flow, with the condition to buy when the price is below 20% away from the average of the last 200 days, the final result would be more than 400% of retained earnings, and realized profit in cash greater than the total amount invested.
█ Other Assets
It's possible to analyze other assets, including dividend yield and earnings for the equity formula. This way we can analyse assets more fairly.
ITSA4
BOVA11
█ Final Conclusion
> Exposing yourself early to a good opportunity may be good, but the risk of doing so at the wrong time could delay your projects indefinitely.
> Investment recurrence is the main driver for your future results.
> Setting a maximum value for making entries reduces short-term fluctuation but, in the long run, the effect is almost imperceptible.
> The realization of profits at favorable times considerably reduces the risk and volatility of the balance, in addition to providing cash for better opportunities in the short and medium term.
> Taking advantage of part of this cash flow for purchases in moments of opportunity, enhances future earnings.
Even an extremely simple strategy like the one used in the examples above, offers a better risk return for the investor compared to the immediate exposure to an asset.
Thus arises the desire to study more sophisticated strategies, as we will see in the future
█ Challenges
Time in the market
- Find good assets (1) to make recurring contributions (3) for an indeterminate period (2).
Timing the market
- Reading the markets to position yourself in favor of the more probable trends at certain times with predetermined terms.

(IK) Base Break BuyThis strategy first calculates areas of support (bases), and then enters trades if that support is broken. The idea is to profit off of retracement. Dollar-cost-averaging safety orders are key here. This strategy takes into account a .1% commission, and tests are done with an initial capital of 100.00 USD. This only goes long.
The strategy is highly customizable. I've set the default values to suit ETH/USD 15m. If you're trading this on another ticker or timeframe, make sure to play around with the settings. There is an explanation of each input in the script comments. I found this to be profitable across most 'common sense' values for settings, but tweaking led to some pretty promising results. I leaned more towards high risk/high trade volume.
Always remember though: historical performance is no guarantee of future behavior . Keep settings within your personal risk tolerance, even if it promises better profit. Anyone can write a 100% profitable script if they assume price always eventually goes up.
Check the script comments for more details, but, briefly, you can customize:
-How many bases to keep track of at once
-How those bases are calculated
-What defines a 'base break'
-Order amounts
-Safety order count
-Stop loss
Here's the basic algorithm:
-Identify support.
--Have previous candles found bottoms in the same area of the current candle bottom?
--Is this support unique enough from other areas of support?
-Determine if support is broken.
--Has the price crossed under support quickly and with certainty?
-Enter trade with a percentage of initial capital.
-Execute safety orders if price continues to drop.
-Exit trade at profit target or stop loss.
Take profit is dynamic and calculated on order entry. The bigger the 'break', the higher your take profit percentage. This target percentage is based on average position size, so as safety orders are filled, and average position size comes down, the target profit becomes easier to reach.
Stop loss can be calculated one of two ways, either a static level based on initial entry, or a dynamic level based on average position size. If you use the latter (default), be aware, your real losses will be greater than your stated stop loss percentage . For example:
-stop loss = 15%, capital = 100.00, safety order threshold = 10%
-you buy $50 worth of shares at $1 - price average is $1
-you safety $25 worth of shares at $0.9 - price average is $0.966
-you safety $25 worth of shares at $0.8. - price average is $0.925
-you get stopped out at 0.925 * (1-.15) = $0.78625, and you're left with $78.62.
This is a realized loss of ~21.4% with a stop loss set to 15%. The larger your safety order threshold, the larger your real loss in comparison to your stop loss percentage, and vice versa.
Indicator plots show the calculated bases in white. The closest base below price is yellow. If that base is broken, it turns purple. Once a trade is entered, profit target is shown in silver and stop loss in red.

BitcoinNinjas NINJASIGNALS V4 (Strategy)BitcoinNinjas NINJASIGNALS V4 (Strategy)
(for Cryptocurrencies, Forex, GunBot, ProfitTrailer, Autoview, CryptoHopper, manual or automated trading, and more)
This is version 4 of our Ninja Signals trading script, with accompanying backtesting strategy.
BitcoinNinjas NINJASIGNALS V4 (Script)
•Allows users to easily set automated buy/long and sell/short alerts on TradingView for use with automatic and manual trading of cryptocurrencies, Forex securities, and more (alerts are compatible with automatic trading software such as GunBot, ProfitTrailer, Autoview, CryptoHopper, and more).
•Synthesizes many powerful indicators [e.g., Relative Strength Index (RSI), Stochastic RSI, Money Flow Index (MFI), Moving Average Convergence Divergence (MACD), etc.) into one powerful script to generate very precise buy and sell signals in virtually all market conditions.
•Features user-defined adjustable calibration settings, allowing traders to customize the script to fit any currency / security on any exchange available through TradingView.com, simply by adjusting settings.
•Buy/Long arrows, Sell/Short arrows, & EMA trendline can be customized or hidden, if desired.
•Complete with backtesting strategy version of script which allows users to test various trading strategies based on the alerts the script generates (see information and screenshots below).
•Backtesting strategy features a user-defined adjustable date range, so traders can estimate performance of the script over specific periods of time, such as the last week, month, or year.
•Script and backtesting strategy feature many user-adjustable settings including stop loss and take profit alerts, an ‘only sell for profit’ option (Gunbot-specific), many different buy and sell filters, and more. Simply adjust the script settings and the backtesting results will automatically refresh.
•Backtesting strategy allows for pyramid buying to test various average down / dollar cost average trading strategies. Simply adjust the number of pyramid buys and the quantity of each buy.
•Fully compatible with margin and futures trading for any currency / security on TradingView.com.
DISCLAIMER: By using our BitcoinNinjas ‘Ninja Signals’ planning script, you agree to the BitcoinNinjas 'Terms of Use'. No sharing, copying, reselling, modifying, or any other forms of use are authorized for our documents, script / strategy, and the information published with them. This informational planning script / strategy is strictly for individual use and educational purposes only. This is not financial or investment advice. Investments are always made at your own risk and are based on your personal judgement. BitcoinNinjas is not responsible for any losses you may incur. Please invest wisely.