Risk TrackerThis Risk Tracker Pine Script provides traders with a customizable tool for tracking and managing trade risk directly on their chart. The script is designed to accommodate both futures and crypto trades, allowing you to monitor risk and reward parameters, adjust contract sizes, and manage leverage in real-time.
Key Features:
1. Trade Direction and Risk-Reward Ratio:
• Select between Long or Short trade directions.
• Set a custom Risk-Reward Ratio (RRR) to calculate potential profit and loss levels based on your trade setup.
2. Customizable Parameters:
• Input fields for contract size, leverage, margin, and maximum drawdown allow you to adjust the risk settings depending on the market you are trading.
• You can toggle between using a dollar-based or percentage-based risk calculation depending on whether you’re trading futures (USD-based) or crypto.
3. Real-time Stop-Loss and Take-Profit Calculation:
• The script automatically calculates and draws the Stop-Loss (SL) and Take-Profit (TP) levels on the chart based on your entry price and selected risk settings.
• The color of the SL and TP lines is customizable, allowing you to visually distinguish profit and loss levels.
4. Historical Price Levels:
• If there is no active trade, the script scans historical price data to find the last instances when the price hit the predefined stop-loss or take-profit levels, helping you understand past price behavior.
5. Risk Management Table:
• A summary table is displayed on the chart, showing the key metrics of your trade, including:
• Tick value and Dollar value for futures.
• Margin and Leverage for crypto.
• Risk-Reward Ratio, Entry price, Risk and Profit in USD or percentage terms.
• The table dynamically updates based on the current trade status.
6. Extended Chart Visualization:
• Option to extend the SL and TP lines to the left of the chart, allowing you to easily view these levels across multiple timeframes and bars.
This script helps ensure you are always aware of your trade’s risk profile, providing a clear and visual representation of potential profit and loss, both in terms of percentage and dollar value. Ideal for futures and crypto traders who rely on precise risk management to maintain profitability.
Cerca negli script per "profit"

RSI Trend Following StrategyOverview
The RSI Trend Following Strategy utilizes Relative Strength Index (RSI) to enter the trade for the potential trend continuation. It uses Stochastic indicator to check is the price is not in overbought territory and the MACD to measure the current price momentum. Moreover, it uses the 200-period EMA to filter the counter trend trades with the higher probability. The strategy opens only long trades.
Unique Features
Dynamic stop-loss system: Instead of fixed stop-loss level strategy utilizes average true range (ATR) multiplied by user given number subtracted from the position entry price as a dynamic stop loss level.
Configurable Trading Periods: Users can tailor the strategy to specific market windows, adapting to different market conditions.
Two layers trade filtering system: Strategy utilizes MACD and Stochastic indicators measure the current momentum and overbought condition and use 200-period EMA to filter trades against major trend.
Trailing take profit level: After reaching the trailing profit activation level script activates the trailing of long trade using EMA. More information in methodology.
Wide opportunities for strategy optimization: Flexible strategy settings allows users to optimize the strategy entries and exits for chosen trading pair and time frame.
Methodology
The strategy opens long trade when the following price met the conditions:
RSI is above 50 level.
MACD line shall be above the signal line
Both lines of Stochastic shall be not higher than 80 (overbought territory)
Candle’s low shall be above the 200 period EMA
When long trade is executed, strategy set the stop-loss level at the price ATR multiplied by user-given value below the entry price. This level is recalculated on every next candle close, adjusting to the current market volatility.
At the same time strategy set up the trailing stop validation level. When the price crosses the level equals entry price plus ATR multiplied by user-given value script starts to trail the price with trailing EMA(by default = 20 period). If price closes below EMA long trade is closed. When the trailing starts, script prints the label “Trailing Activated”.
Strategy settings
In the inputs window user can setup the following strategy settings:
ATR Stop Loss (by default = 1.75)
ATR Trailing Profit Activation Level (by default = 2.25)
MACD Fast Length (by default = 12, period of averaging fast MACD line)
MACD Fast Length (by default = 26, period of averaging slow MACD line)
MACD Signal Smoothing (by default = 9, period of smoothing MACD signal line)
Oscillator MA Type (by default = EMA, available options: SMA, EMA)
Signal Line MA Type (by default = EMA, available options: SMA, EMA)
RSI Length (by default = 14, period for RSI calculation)
Trailing EMA Length (by default = 20, period for EMA, which shall be broken close the trade after trailing profit activation)
Justification of Methodology
This trading strategy is designed to leverage a combination of technical indicators—Relative Strength Index (RSI), Moving Average Convergence Divergence (MACD), Stochastic Oscillator, and the 200-period Exponential Moving Average (EMA)—to determine optimal entry points for long trades. Additionally, the strategy uses the Average True Range (ATR) for dynamic risk management to adapt to varying market conditions. Let's look in details for which purpose each indicator is used for and why it is used in this combination.
Relative Strength Index (RSI) is a momentum indicator used in technical analysis to measure the speed and change of price movements in a financial market. It helps traders identify whether an asset is potentially overbought (overvalued) or oversold (undervalued), which can indicate a potential reversal or continuation of the current trend.
How RSI Works? RSI tracks the strength of recent price changes. It compares the average gains and losses over a specific period (usually 14 periods) to assess the momentum of an asset. Average gain is the average of all positive price changes over the chosen period. It reflects how much the price has typically increased during upward movements. Average loss is the average of all negative price changes over the same period. It reflects how much the price has typically decreased during downward movements.
RSI calculates these average gains and losses and compares them to create a value between 0 and 100. If the RSI value is above 70, the asset is generally considered overbought, meaning it might be due for a price correction or reversal downward. Conversely, if the RSI value is below 30, the asset is considered oversold, suggesting it could be poised for an upward reversal or recovery. RSI is a useful tool for traders to determine market conditions and make informed decisions about entering or exiting trades based on the perceived strength or weakness of an asset's price movements.
This strategy uses RSI as a short-term trend approximation. If RSI crosses over 50 it means that there is a high probability of short-term trend change from downtrend to uptrend. Therefore RSI above 50 is our first trend filter to look for a long position.
The MACD (Moving Average Convergence Divergence) is a popular momentum and trend-following indicator used in technical analysis. It helps traders identify changes in the strength, direction, momentum, and duration of a trend in an asset's price.
The MACD consists of three components:
MACD Line: This is the difference between a short-term Exponential Moving Average (EMA) and a long-term EMA, typically calculated as: MACD Line = 12 period EMA − 26 period EMA
Signal Line: This is a 9-period EMA of the MACD Line, which helps to identify buy or sell signals. When the MACD Line crosses above the Signal Line, it can be a bullish signal (suggesting a buy); when it crosses below, it can be a bearish signal (suggesting a sell).
Histogram: The histogram shows the difference between the MACD Line and the Signal Line, visually representing the momentum of the trend. Positive histogram values indicate increasing bullish momentum, while negative values indicate increasing bearish momentum.
This strategy uses MACD as a second short-term trend filter. When MACD line crossed over the signal line there is a high probability that uptrend has been started. Therefore MACD line above signal line is our additional short-term trend filter. In conjunction with RSI it decreases probability of following false trend change signals.
The Stochastic Indicator is a momentum oscillator that compares a security's closing price to its price range over a specific period. It's used to identify overbought and oversold conditions. The indicator ranges from 0 to 100, with readings above 80 indicating overbought conditions and readings below 20 indicating oversold conditions.
It consists of two lines:
%K: The main line, calculated using the formula (CurrentClose−LowestLow)/(HighestHigh−LowestLow)×100 . Highest and lowest price taken for 14 periods.
%D: A smoothed moving average of %K, often used as a signal line.
This strategy uses stochastic to define the overbought conditions. The logic here is the following: we want to avoid long trades in the overbought territory, because when indicator reaches it there is a high probability that the potential move is gonna be restricted.
The 200-period EMA is a widely recognized indicator for identifying the long-term trend direction. The strategy only trades in the direction of this primary trend to increase the probability of successful trades. For instance, when the price is above the 200 EMA, only long trades are considered, aligning with the overarching trend direction.
Therefore, strategy uses combination of RSI and MACD to increase the probability that price now is in short-term uptrend, Stochastic helps to avoid the trades in the overbought (>80) territory. To increase the probability of opening long trades in the direction of a main trend and avoid local bounces we use 200 period EMA.
ATR is used to adjust the strategy risk management to the current market volatility. If volatility is low, we don’t need the large stop loss to understand the there is a high probability that we made a mistake opening the trade. User can setup the settings ATR Stop Loss and ATR Trailing Profit Activation Level to realize his own risk to reward preferences, but the unique feature of a strategy is that after reaching trailing profit activation level strategy is trying to follow the trend until it is likely to be finished instead of using fixed risk management settings. It allows sometimes to be involved in the large movements.
Backtest Results
Operating window: Date range of backtests is 2023.01.01 - 2024.08.01. It is chosen to let the strategy to close all opened positions.
Commission and Slippage: Includes a standard Binance commission of 0.1% and accounts for possible slippage over 5 ticks.
Initial capital: 10000 USDT
Percent of capital used in every trade: 30%
Maximum Single Position Loss: -3.94%
Maximum Single Profit: +15.78%
Net Profit: +1359.21 USDT (+13.59%)
Total Trades: 111 (36.04% win rate)
Profit Factor: 1.413
Maximum Accumulated Loss: 625.02 USDT (-5.85%)
Average Profit per Trade: 12.25 USDT (+0.40%)
Average Trade Duration: 40 hours
These results are obtained with realistic parameters representing trading conditions observed at major exchanges such as Binance and with realistic trading portfolio usage parameters.
How to Use
Add the script to favorites for easy access.
Apply to the desired timeframe and chart (optimal performance observed on 2h BTC/USDT).
Configure settings using the dropdown choice list in the built-in menu.
Set up alerts to automate strategy positions through web hook with the text: {{strategy.order.alert_message}}
Disclaimer:
Educational and informational tool reflecting Skyrex commitment to informed trading. Past performance does not guarantee future results. Test strategies in a simulated environment before live implementation

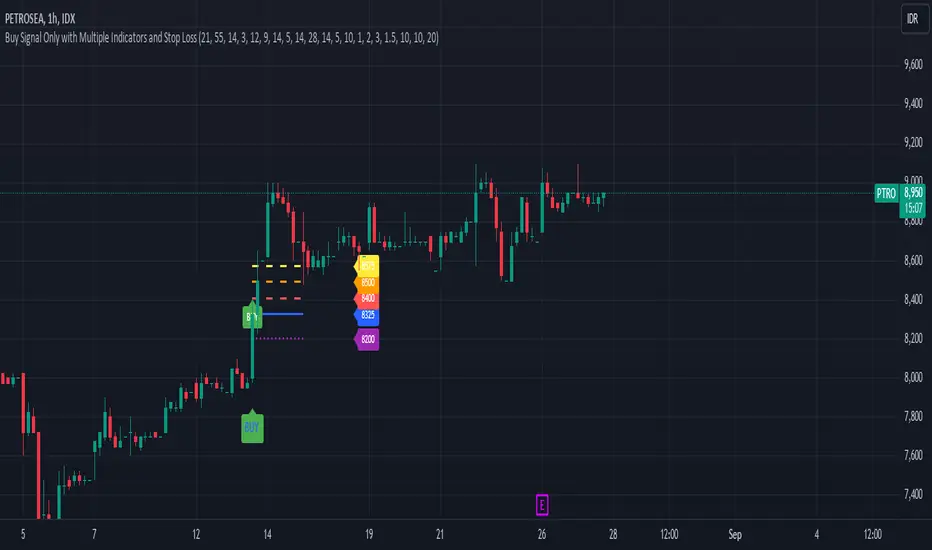
Buy Signal Only with Multiple Indicators and Stop LossDescription: This custom Pine Script indicator is designed to help traders identify optimal buy signals using a combination of multiple technical indicators. It provides visual markers for entry points, take profit levels, and stop loss, offering a comprehensive tool for decision-making.
Features:
Buy Signal: Generates a buy signal based on a combination of EMA Cloud, SuperTrend, Zero Lag MACD, QQE, Volume Oscillator, and ATR Bands.
Entry Point: Displays a horizontal line at the entry price with a price label, extended to the right for visibility.
Take Profit Levels:
1% Take Profit: A dashed red line with a price label for the first take profit level.
2% Take Profit: A dashed orange line with a price label for the second take profit level.
Stop Loss: A dotted purple line with a price label to indicate the stop loss level set at 3%.
Parameters:
EMA Short Length: Adjust the period for the short EMA.
EMA Long Length: Adjust the period for the long EMA.
ATR Length: Set the length for ATR calculation.
Multiplier: Define the factor for the SuperTrend calculation.
MACD Length and Signal Length: Configure lengths for MACD and its signal line.
RSI Length and Smooth Length: Set parameters for RSI and its smoothing.
Volume Lengths: Customize lengths for the volume oscillator.
ATR Band Length and Multiplier: Set parameters for ATR Bands.
Delay Bars: Specify the number of bars to wait before showing another buy signal.
Take Profit Percentages: Adjust percentages for the 1% and 2% take profit levels.
Stop Loss Percentage: Set the stop loss percentage.
Line Extension Length: Define the number of bars to extend lines.
Right Offset Bars: Configure how many bars to offset labels and lines to the right.
Usage:
Identify Buy Opportunities: The indicator helps identify potential buy signals using multiple indicators.
Manage Trades: Visualize entry points, take profit targets, and stop loss levels to manage trades effectively.
Customization: Tailor the indicator to fit your trading strategy by adjusting the parameters.
Notes:
This is what we call version 1.
Ensure that the indicator's settings align with your trading strategy and market conditions.Use in conjunction with other analysis tools for a comprehensive trading approach.
Multi-Step FlexiSuperTrend - Strategy [presentTrading]At the heart of this endeavor is a passion for continuous improvement in the art of trading
█ Introduction and How it is Different
The "Multi-Step FlexiSuperTrend - Strategy " is an advanced trading strategy that integrates the well-known SuperTrend indicator with a nuanced and dynamic approach to market trend analysis. Unlike conventional SuperTrend strategies that rely on static thresholds and fixed parameters, this strategy introduces multi-step take profit mechanisms that allow traders to capitalize on varying market conditions in a more controlled and systematic manner.
What sets this strategy apart is its ability to dynamically adjust to market volatility through the use of an incremental factor applied to the SuperTrend calculation. This adjustment ensures that the strategy remains responsive to both minor and major market shifts, providing a more accurate signal for entries and exits. Additionally, the integration of multi-step take profit levels offers traders the flexibility to scale out of positions, locking in profits progressively as the market moves in their favor.
BTC 6hr Long/Short Performance
█ Strategy, How it Works: Detailed Explanation
The Multi-Step FlexiSuperTrend strategy operates on the foundation of the SuperTrend indicator, but with several enhancements that make it more adaptable to varying market conditions. The key components of this strategy include the SuperTrend Polyfactor Oscillator, a dynamic normalization process, and multi-step take profit levels.
🔶 SuperTrend Polyfactor Oscillator
The SuperTrend Polyfactor Oscillator is the heart of this strategy. It is calculated by applying a series of SuperTrend calculations with varying factors, starting from a defined "Starting Factor" and incrementing by a specified "Increment Factor." The indicator length and the chosen price source (e.g., HLC3, HL2) are inputs to the oscillator.
The SuperTrend formula typically calculates an upper and lower band based on the average true range (ATR) and a multiplier (the factor). These bands determine the trend direction. In the FlexiSuperTrend strategy, the oscillator is enhanced by iteratively applying the SuperTrend calculation across different factors. The iterative process allows the strategy to capture both minor and significant trend changes.
For each iteration (indexed by `i`), the following calculations are performed:
1. ATR Calculation: The Average True Range (ATR) is calculated over the specified `indicatorLength`:
ATR_i = ATR(indicatorLength)
2. Upper and Lower Bands Calculation: The upper and lower bands are calculated using the ATR and the current factor:
Upper Band_i = hl2 + (ATR_i * Factor_i)
Lower Band_i = hl2 - (ATR_i * Factor_i)
Here, `Factor_i` starts from `startingFactor` and is incremented by `incrementFactor` in each iteration.
3. Trend Determination: The trend is determined by comparing the indicator source with the upper and lower bands:
Trend_i = 1 (uptrend) if IndicatorSource > Upper Band_i
Trend_i = 0 (downtrend) if IndicatorSource < Lower Band_i
Otherwise, the trend remains unchanged from the previous value.
4. Output Calculation: The output of each iteration is determined based on the trend:
Output_i = Lower Band_i if Trend_i = 1
Output_i = Upper Band_i if Trend_i = 0
This process is repeated for each iteration (from 0 to 19), creating a series of outputs that reflect different levels of trend sensitivity.
Local
🔶 Normalization Process
To make the oscillator values comparable across different market conditions, the deviations between the indicator source and the SuperTrend outputs are normalized. The normalization method can be one of the following:
1. Max-Min Normalization: The deviations are normalized based on the range of the deviations:
Normalized Value_i = (Deviation_i - Min Deviation) / (Max Deviation - Min Deviation)
2. Absolute Sum Normalization: The deviations are normalized based on the sum of absolute deviations:
Normalized Value_i = Deviation_i / Sum of Absolute Deviations
This normalization ensures that the oscillator values are within a consistent range, facilitating more reliable trend analysis.
For more details:
🔶 Multi-Step Take Profit Mechanism
One of the unique features of this strategy is the multi-step take profit mechanism. This allows traders to lock in profits at multiple levels as the market moves in their favor. The strategy uses three take profit levels, each defined as a percentage increase (for long trades) or decrease (for short trades) from the entry price.
1. First Take Profit Level: Calculated as a percentage increase/decrease from the entry price:
TP_Level1 = Entry Price * (1 + tp_level1 / 100) for long trades
TP_Level1 = Entry Price * (1 - tp_level1 / 100) for short trades
The strategy exits a portion of the position (defined by `tp_percent1`) when this level is reached.
2. Second Take Profit Level: Similar to the first level, but with a higher percentage:
TP_Level2 = Entry Price * (1 + tp_level2 / 100) for long trades
TP_Level2 = Entry Price * (1 - tp_level2 / 100) for short trades
The strategy exits another portion of the position (`tp_percent2`) at this level.
3. Third Take Profit Level: The final take profit level:
TP_Level3 = Entry Price * (1 + tp_level3 / 100) for long trades
TP_Level3 = Entry Price * (1 - tp_level3 / 100) for short trades
The remaining portion of the position (`tp_percent3`) is exited at this level.
This multi-step approach provides a balance between securing profits and allowing the remaining position to benefit from continued favorable market movement.
█ Trade Direction
The strategy allows traders to specify the trade direction through the `tradeDirection` input. The options are:
1. Both: The strategy will take both long and short positions based on the entry signals.
2. Long: The strategy will only take long positions.
3. Short: The strategy will only take short positions.
This flexibility enables traders to tailor the strategy to their market outlook or current trend analysis.
█ Usage
To use the Multi-Step FlexiSuperTrend strategy, traders need to set the input parameters according to their trading style and market conditions. The strategy is designed for versatility, allowing for various market environments, including trending and ranging markets.
Traders can also adjust the multi-step take profit levels and percentages to match their risk management and profit-taking preferences. For example, in highly volatile markets, traders might set wider take profit levels with smaller percentages at each level to capture larger price movements.
The normalization method and the incremental factor can be fine-tuned to adjust the sensitivity of the SuperTrend Polyfactor Oscillator, making the strategy more responsive to minor market shifts or more focused on significant trends.
█ Default Settings
The default settings of the strategy are carefully chosen to provide a balanced approach between risk management and profit potential. Here is a breakdown of the default settings and their effects on performance:
1. Indicator Length (10): This parameter controls the lookback period for the ATR calculation. A shorter length makes the strategy more sensitive to recent price movements, potentially generating more signals. A longer length smooths out the ATR, reducing sensitivity but filtering out noise.
2. Starting Factor (0.618): This is the initial multiplier used in the SuperTrend calculation. A lower starting factor makes the SuperTrend bands closer to the price, generating more frequent trend changes. A higher starting factor places the bands further away, filtering out minor fluctuations.
3. Increment Factor (0.382): This parameter controls how much the factor increases with each iteration of the SuperTrend calculation. A smaller increment factor results in more gradual changes in sensitivity, while a larger increment factor creates a wider range of sensitivity across the iterations.
4. Normalization Method (None): The default is no normalization, meaning the raw deviations are used. Normalization methods like Max-Min or Absolute Sum can make the deviations more consistent across different market conditions, improving the reliability of the oscillator.
5. Take Profit Levels (2%, 8%, 18%): These levels define the thresholds for exiting portions of the position. Lower levels (e.g., 2%) capture smaller profits quickly, while higher levels (e.g., 18%) allow positions to run longer for more significant gains.
6. Take Profit Percentages (30%, 20%, 15%): These percentages determine how much of the position is exited at each take profit level. A higher percentage at the first level locks in more profit early, reducing exposure to market reversals. Lower percentages at higher levels allow for a portion of the position to benefit from extended trends.

MACD with 1D Stochastic Confirmation Reversal StrategyOverview
The MACD with 1D Stochastic Confirmation Reversal Strategy utilizes MACD indicator in conjunction with 1 day timeframe Stochastic indicators to obtain the high probability short-term trend reversal signals. The main idea is to wait until MACD line crosses up it’s signal line, at the same time Stochastic indicator on 1D time frame shall show the uptrend (will be discussed in methodology) and not to be in the oversold territory. Strategy works on time frames from 30 min to 4 hours and opens only long trades.
Unique Features
Dynamic stop-loss system: Instead of fixed stop-loss level strategy utilizes average true range (ATR) multiplied by user given number subtracted from the position entry price as a dynamic stop loss level.
Configurable Trading Periods: Users can tailor the strategy to specific market windows, adapting to different market conditions.
Higher time frame confirmation: Strategy utilizes 1D Stochastic to establish the major trend and confirm the local reversals with the higher probability.
Trailing take profit level: After reaching the trailing profit activation level scrip activate the trailing of long trade using EMA. More information in methodology.
Methodology
The strategy opens long trade when the following price met the conditions:
MACD line of MACD indicator shall cross over the signal line of MACD indicator.
1D time frame Stochastic’s K line shall be above the D line.
1D time frame Stochastic’s K line value shall be below 80 (not overbought)
When long trade is executed, strategy set the stop-loss level at the price ATR multiplied by user-given value below the entry price. This level is recalculated on every next candle close, adjusting to the current market volatility.
At the same time strategy set up the trailing stop validation level. When the price crosses the level equals entry price plus ATR multiplied by user-given value script starts to trail the price with EMA. If price closes below EMA long trade is closed. When the trailing starts, script prints the label “Trailing Activated”.
Strategy settings
In the inputs window user can setup the following strategy settings:
ATR Stop Loss (by default = 3.25, value multiplied by ATR to be subtracted from position entry price to setup stop loss)
ATR Trailing Profit Activation Level (by default = 4.25, value multiplied by ATR to be added to position entry price to setup trailing profit activation level)
Trailing EMA Length (by default = 20, period for EMA, when price reached trailing profit activation level EMA will stop out of position if price closes below it)
User can choose the optimal parameters during backtesting on certain price chart, in our example we use default settings.
Justification of Methodology
This strategy leverages 2 time frames analysis to have the high probability reversal setups on lower time frame in the direction of the 1D time frame trend. That’s why it’s recommended to use this strategy on 30 min – 4 hours time frames.
To have an approximation of 1D time frame trend strategy utilizes classical Stochastic indicator. The Stochastic Indicator is a momentum oscillator that compares a security's closing price to its price range over a specific period. It's used to identify overbought and oversold conditions. The indicator ranges from 0 to 100, with readings above 80 indicating overbought conditions and readings below 20 indicating oversold conditions.
It consists of two lines:
%K: The main line, calculated using the formula (CurrentClose−LowestLow)/(HighestHigh−LowestLow)×100 . Highest and lowest price taken for 14 periods.
%D: A smoothed moving average of %K, often used as a signal line.
Strategy logic assumes that on 1D time frame it’s uptrend in %K line is above the %D line. Moreover, we can consider long trade only in %K line is below 80. It means that in overbought state the long trade will not be opened due to higher probability of pullback or even major trend reversal. If these conditions are met we are going to our working (lower) time frame.
On the chosen time frame, we remind you that for correct work of this strategy you shall use 30min – 4h time frames, MACD line shall cross over it’s signal line. The MACD (Moving Average Convergence Divergence) is a popular momentum and trend-following indicator used in technical analysis. It helps traders identify changes in the strength, direction, momentum, and duration of a trend in a stock's price.
The MACD consists of three components:
MACD Line: This is the difference between a short-term Exponential Moving Average (EMA) and a long-term EMA, typically calculated as: MACD Line=12-period EMA−26-period
Signal Line: This is a 9-period EMA of the MACD Line, which helps to identify buy or sell signals. When the MACD Line crosses above the Signal Line, it can be a bullish signal (suggesting a buy); when it crosses below, it can be a bearish signal (suggesting a sell).
Histogram: The histogram shows the difference between the MACD Line and the Signal Line, visually representing the momentum of the trend. Positive histogram values indicate increasing bullish momentum, while negative values indicate increasing bearish momentum.
In our script we are interested in only MACD and signal lines. When MACD line crosses signal line there is a high chance that short-term trend reversed to the upside. We use this strategy on 45 min time frame.
ATR is used to adjust the strategy risk management to the current market volatility. If volatility is low, we don’t need the large stop loss to understand the there is a high probability that we made a mistake opening the trade. User can setup the settings ATR Stop Loss and ATR Trailing Profit Activation Level to realize his own risk to reward preferences, but the unique feature of a strategy is that after reaching trailing profit activation level strategy is trying to follow the trend until it is likely to be finished instead of using fixed risk management settings. It allows sometimes to be involved in the large movements.
Backtest Results
Operating window: Date range of backtests is 2023.01.01 - 2024.08.01. It is chosen to let the strategy to close all opened positions.
Commission and Slippage: Includes a standard Binance commission of 0.1% and accounts for possible slippage over 5 ticks.
Initial capital: 10000 USDT
Percent of capital used in every trade: 30%
Maximum Single Position Loss: -4.79%
Maximum Single Profit: +20.14%
Net Profit: +2361.33 USDT (+44.72%)
Total Trades: 123 (44.72% win rate)
Profit Factor: 1.623
Maximum Accumulated Loss: 695.80 USDT (-5.48%)
Average Profit per Trade: 19.20 USDT (+0.59%)
Average Trade Duration: 30 hours
These results are obtained with realistic parameters representing trading conditions observed at major exchanges such as Binance and with realistic trading portfolio usage parameters.
How to Use
Add the script to favorites for easy access.
Apply to the desired timeframe between 30 min and 4 hours and chart (optimal performance observed on 45 min BTC/USDT).
Configure settings using the dropdown choice list in the built-in menu.
Set up alerts to automate strategy positions through web hook with the text: {{strategy.order.alert_message}}
Disclaimer:
Educational and informational tool reflecting Skyrex commitment to informed trading. Past performance does not guarantee future results. Test strategies in a simulated environment before live implementation

Double CCI Confirmed Hull Moving Average Reversal StrategyOverview
The Double CCI Confirmed Hull Moving Average Strategy utilizes hull moving average (HMA) in conjunction with two commodity channel index (CCI) indicators: the slow and fast to increase the probability of entering when the short and mid-term uptrend confirmed. The main idea is to wait until the price breaks the HMA while both CCI are showing that the uptrend has likely been already started. Moreover, strategy uses exponential moving average (EMA) to trail the price when it reaches the specific level. The strategy opens only long trades.
Unique Features
Dynamic stop-loss system: Instead of fixed stop-loss level strategy utilizes average true range (ATR) multiplied by user given number subtracted from the position entry price as a dynamic stop loss level.
Configurable Trading Periods: Users can tailor the strategy to specific market windows, adapting to different market conditions.
Double trade setup confirmation: Strategy utilizes two different period CCI indicators to confirm the breakouts of HMA.
Trailing take profit level: After reaching the trailing profit activation level scrip activate the trailing of long trade using EMA. More information in methodology.
Methodology
The strategy opens long trade when the following price met the conditions:
Short-term period CCI indicator shall be above 0.
Long-term period CCI indicator shall be above 0.
Price shall cross the HMA and candle close above it with the same candle
When long trade is executed, strategy set the stop-loss level at the price ATR multiplied by user-given value below the entry price. This level is recalculated on every next candle close, adjusting to the current market volatility.
At the same time strategy set up the trailing stop validation level. When the price crosses the level equals entry price plus ATR multiplied by user-given value script starts to trail the price with EMA. If price closes below EMA long trade is closed. When the trailing starts, script prints the label “Trailing Activated”.
Strategy settings
In the inputs window user can setup the following strategy settings:
ATR Stop Loss (by default = 1.75)
ATR Trailing Profit Activation Level (by default = 2.25)
CCI Fast Length (by default = 25, used for calculation short term period CCI
CCI Slow Length (by default = 50, used for calculation long term period CCI)
Hull MA Length (by default = 34, period of HMA, which shall be broken to open trade)
Trailing EMA Length (by default = 20)
User can choose the optimal parameters during backtesting on certain price chart.
Justification of Methodology
Before understanding why this particular combination of indicator has been chosen let's briefly explain what is CCI and HMA.
The Commodity Channel Index (CCI) is a momentum-based technical indicator used in trading to measure a security's price relative to its average price over a given period. Developed by Donald Lambert in 1980, the CCI is primarily used to identify cyclical trends in a security, helping traders to spot potential buying or selling opportunities.
The CCI formula is:
CCI = (Typical Price − SMA) / (0.015 × Mean Deviation)
Typical Price (TP): This is calculated as the average of the high, low, and closing prices for the period.
Simple Moving Average (SMA): This is the average of the Typical Prices over a specific number of periods.
Mean Deviation: This is the average of the absolute differences between the Typical Price and the SMA.
The result is a value that typically fluctuates between +100 and -100, though it is not bounded and can go higher or lower depending on the price movement.
The Hull Moving Average (HMA) is a type of moving average that was developed by Alan Hull to improve upon the traditional moving averages by reducing lag while maintaining smoothness. The goal of the HMA is to create an indicator that is both quick to respond to price changes and less prone to whipsaws (false signals).
How the Hull Moving Average is Calculated?
The Hull Moving Average is calculated using the following steps:
Weighted Moving Average (WMA): The HMA starts by calculating the Weighted Moving Average (WMA) of the price data over a period square root of n (sqrt(n))
Speed Adjustment: A WMA is then calculated for half of the period n/2, and this is multiplied by 2 to give more weight to recent prices.
Lag Reduction: The WMA of the full period n is subtracted from the doubled n/2 WMA.
Final Smoothing: To smooth the result and reduce noise, a WMA is calculated for the square root of the period n.
The formula can be represented as:
HMA(n) = WMA(WMA(n/2) × 2 − WMA(n), sqrt(n))
The Weighted Moving Average (WMA) is a type of moving average that gives more weight to recent data points, making it more responsive to recent price changes than a Simple Moving Average (SMA). In a WMA, each data point within the selected period is multiplied by a weight, with the most recent data receiving the highest weight. The sum of these weighted values is then divided by the sum of the weights to produce the WMA.
This strategy leverages HMA of user given period as a critical level which shall be broken to say that probability of trend change to the upside increased. HMA reacts faster than EMA or SMA to the price change, that’s why it increases chances to enter new trade earlier. Long-term period CCI helps to have an approximation of mid-term trend. If it’s above 0 the probability of uptrend increases. Short-period CCI allows to have an approximation of short-term trend reversal from down to uptrend. This approach increases chances to have a long trade setup in the direction of mid-term trend when the short-term trend starts to reverse.
ATR is used to adjust the strategy risk management to the current market volatility. If volatility is low, we don’t need the large stop loss to understand the there is a high probability that we made a mistake opening the trade. User can setup the settings ATR Stop Loss and ATR Trailing Profit Activation Level to realize his own risk to reward preferences, but the unique feature of a strategy is that after reaching trailing profit activation level strategy is trying to follow the trend until it is likely to be finished instead of using fixed risk management settings. It allows sometimes to be involved in the large movements. It’s also important to make a note, that script uses HMA to enter the trade, but for trailing it leverages EMA. It’s used because EMA has no such fast reaction to price move which increases probability not to be stopped out from any significant uptrend move.
Backtest Results
Operating window: Date range of backtests is 2022.07.01 - 2024.08.01. It is chosen to let the strategy to close all opened positions.
Commission and Slippage: Includes a standard Binance commission of 0.1% and accounts for possible slippage over 5 ticks.
Initial capital: 10000 USDT
Percent of capital used in every trade: 100%
Maximum Single Position Loss: -4.67%
Maximum Single Profit: +19.66%
Net Profit: +14897.94 USDT (+148.98%)
Total Trades: 104 (36.54% win rate)
Profit Factor: 2.312
Maximum Accumulated Loss: 1302.66 USDT (-9.58%)
Average Profit per Trade: 143.25 USDT (+0.96%)
Average Trade Duration: 34 hours
These results are obtained with realistic parameters representing trading conditions observed at major exchanges such as Binance and with realistic trading portfolio usage parameters.
How to Use
Add the script to favorites for easy access.
Apply to the desired timeframe and chart (optimal performance observed on 2h BTC/USDT).
Configure settings using the dropdown choice list in the built-in menu.
Set up alerts to automate strategy positions through web hook with the text: {{strategy.order.alert_message}}
Disclaimer:
Educational and informational tool reflecting Skyrex commitment to informed trading. Past performance does not guarantee future results. Test strategies in a simulated environment before live implementation

Harmonic Patterns Library [TradingFinder]🔵 Introduction
Harmonic patterns blend geometric shapes with Fibonacci numbers, making these numbers fundamental to understanding the patterns.
One person who has done a lot of research on harmonic patterns is Scott Carney.Scott Carney's research on harmonic patterns in technical analysis focuses on precise price structures based on Fibonacci ratios to identify market reversals.
Key patterns include the Gartley, Bat, Butterfly, and Crab, each with specific alignment criteria. These patterns help traders anticipate potential market turning points and make informed trading decisions, enhancing the predictability of technical analysis.
🟣 Understanding 5-Point Harmonic Patterns
In the current library version, you can easily draw and customize most XABCD patterns. These patterns often form M or W shapes, or a combination of both. By calculating the Fibonacci ratios between key points, you can estimate potential price movements.
All five-point patterns share a similar structure, differing only in line lengths and Fibonacci ratios. Learning one pattern simplifies understanding others.
🟣 Exploring the Gartley Pattern
The Gartley pattern appears in both bullish (M shape) and bearish (W shape) forms. In the bullish Gartley, point X is below point D, and point A surpasses point C. Point D marks the start of a strong upward trend, making it an optimal point to place a buy order.
The bearish Gartley mirrors the bullish pattern with inverted Fibonacci ratios. In this scenario, point D indicates the start of a significant price drop. Traders can place sell orders at this point and buy at lower prices for profit in two-way markets.
🟣 Analyzing the Butterfly Pattern
The Butterfly pattern also manifests in bullish (M shape) and bearish (W shape) forms. It resembles the Gartley pattern but with point D lower than point X in the bullish version.
The Butterfly pattern involves deeper price corrections than the Gartley, leading to more significant price fluctuations. Point D in the bullish Butterfly indicates the beginning of a sharp price rise, making it an entry point for buy orders.
The bearish Butterfly has inverted Fibonacci ratios, with point D marking the start of a sharp price decline, ideal for sell orders followed by buying at lower prices in two-way markets.
🟣 Insights into the Bat Pattern
The Bat pattern, appearing in bullish (M shape) and bearish (W shape) forms, is one of the most precise harmonic patterns. It closely resembles the Butterfly and Gartley patterns, differing mainly in Fibonacci levels.
The bearish Bat pattern shares the Fibonacci ratios with the bullish Bat, with an inverted structure. Point D in the bearish Bat marks the start of a significant price drop, suitable for sell orders followed by buying at lower prices for profit.
🟣 The Crab Pattern Explained
The Crab pattern, found in both bullish (M shape) and bearish (W shape) forms, is highly favored by analysts. Discovered in 2000, the Crab pattern features a larger final wave correction compared to other harmonic patterns.
The bearish Crab shares Fibonacci ratios with the bullish version but in an inverted form. Point D in the bearish Crab signifies the start of a sharp price decline, making it an ideal point for sell orders followed by buying at lower prices for profitable trades.
🟣 Understanding the Shark Pattern
The Shark pattern appears in bullish (M shape) and bearish (W shape) forms. It differs from previous patterns as point C in the bullish Shark surpasses point A, with unique level measurements.
The bearish Shark pattern mirrors the Fibonacci ratios of the bullish Shark but is inverted. Point D in the bearish Shark indicates the start of a sharp price drop, ideal for placing sell orders and buying at lower prices to capitalize on the pattern.
🟣 The Cypher Pattern Overview
The Cypher pattern is another that appears in both bullish (M shape) and bearish (W shape) forms. It resembles the Shark pattern, with point C in the bullish Cypher extending beyond point A, and point D forming within the XA line.
The bearish Cypher shares the Fibonacci ratios with the bullish Cypher but in an inverted structure. Point D in the bearish Cypher marks the start of a significant price drop, perfect for sell orders followed by buying at lower prices.
🟣 Introducing the Nen-Star Pattern
The Nen-Star pattern appears in both bullish (M shape) and bearish (W shape) forms. In the bullish Nen-Star, point C extends beyond point A, and point D, the final point, forms outside the XA line, making CD the longest wave.
The bearish Nen-Star has inverted Fibonacci ratios, with point D indicating the start of a significant price drop. Traders can place sell orders at point D and buy at lower prices to profit from this pattern in two-way markets.
The 5-point harmonic patterns, commonly referred to as XABCD patterns, are specific geometric price structures identified in financial markets. These patterns are used by traders to predict potential price movements based on historical price data and Fibonacci retracement levels.
Here are the main 5-point harmonic patterns :
Gartley Pattern
Anti-Gartley Pattern
Bat Pattern
Anti-Bat Pattern
Alternate Bat Pattern
Butterfly Pattern
Anti-Butterfly Pattern
Crab Pattern
Anti-Crab Pattern
Deep Crab Pattern
Shark Pattern
Anti- Shark Pattern
Anti Alternate Shark Pattern
Cypher Pattern
Anti-Cypher Pattern
🔵 How to Use
To add "Order Block Refiner Library", you must first add the following code to your script.
import TFlab/Harmonic_Chart_Pattern_Library_TradingFinder/1 as HP
🟣 Parameters
XABCD(Name, Type, Show, Color, LineWidth, LabelSize, ShVF, FLPC, FLPCPeriod, Pivot, ABXAmin, ABXAmax, BCABmin, BCABmax, CDBCmin, CDBCmax, CDXAmin, CDXAmax) =>
Parameters:
Name (string)
Type (string)
Show (bool)
Color (color)
LineWidth (int)
LabelSize (string)
ShVF (bool)
FLPC (bool)
FLPCPeriod (int)
Pivot (int)
ABXAmin (float)
ABXAmax (float)
BCABmin (float)
BCABmax (float)
CDBCmin (float)
CDBCmax (float)
CDXAmin (float)
CDXAmax (float)
🟣 Genaral Parameters
Name : The name of the pattern.
Type: Enter "Bullish" to draw a Bullish pattern and "Bearish" to draw an Bearish pattern.
Show : Enter "true" to display the template and "false" to not display the template.
Color : Enter the desired color to draw the pattern in this parameter.
LineWidth : You can enter the number 1 or numbers higher than one to adjust the thickness of the drawing lines. This number must be an integer and increases with increasing thickness.
LabelSize : You can adjust the size of the labels by using the "size.auto", "size.tiny", "size.smal", "size.normal", "size.large" or "size.huge" entries.
🟣 Logical Parameters
ShVF : If this parameter is on "true" mode, only patterns will be displayed that they have exact format and no noise can be seen in them. If "false" is, the patterns displayed that maybe are noisy and do not exactly correspond to the original pattern.
FLPC : if Turned on, you can see this ability of patterns when their last pivot is formed. If this feature is off, it will see the patterns as soon as they are formed. The advantage of this option being clear is less formation of fielded patterns, and it is accompanied by the lateest pattern seeing and a sharp reduction in reward to risk.
FLPCPeriod : Using this parameter you can determine that the last pivot is based on Pivot period.
Pivot : You need to determine the period of the zigzag indicator. This factor is the most important parameter in pattern recognition.
ABXAmin : Minimum retracement of "AB" line compared to "XA" line.
ABXAmax : Maximum retracement of "AB" line compared to "XA" line.
BCABmin : Minimum retracement of "BC" line compared to "AB" line.
BCABmax : Maximum retracement of "BC" line compared to "AB" line.
CDBCmin : Minimum retracement of "CD" line compared to "BC" line.
CDBCmax : Maximum retracement of "CD" line compared to "BC" line.
CDXAmin : Minimum retracement of "CD" line compared to "XA" line.
CDXAmax : Maximum retracement of "CD" line compared to "XA" line.
🟣 Function Outputs
This library has two outputs. The first output is related to the alert of the formation of a new pattern. And the second output is related to the formation of the candlestick pattern and you can draw it using the "plotshape" tool.
Candle Confirmation Logic :
Example :
import TFlab/Harmonic_Chart_Pattern_Library_TradingFinder/1 as HP
PP = input.int(3, 'ZigZag Pivot Period')
ShowBull = input.bool(true, 'Show Bullish Pattern')
ShowBear = input.bool(true, 'Show Bearish Pattern')
ColorBull = input.color(#0609bb, 'Color Bullish Pattern')
ColorBear = input.color(#0609bb, 'Color Bearish Pattern')
LineWidth = input.int(1 , 'Width Line')
LabelSize = input.string(size.small , 'Label size' , options = )
ShVF = input.bool(false , 'Show Valid Format')
FLPC = input.bool(false , 'Show Formation Last Pivot Confirm')
FLPCPeriod =input.int(2, 'Period of Formation Last Pivot')
//Call function
= HP.XABCD('Bullish Bat', 'Bullish', ShowBull, ColorBull , LineWidth, LabelSize ,ShVF, FLPC, FLPCPeriod, PP, 0.382, 0.50, 0.382, 0.886, 1.618, 2.618, 0.85, 0.9)
= HP.XABCD('Bearish Bat', 'Bearish', ShowBear, ColorBear , LineWidth, LabelSize ,ShVF, FLPC, FLPCPeriod, PP, 0.382, 0.50, 0.382, 0.886, 1.618, 2.618, 0.85, 0.9)
//Alert
if BearAlert
alert('Bearish Harmonic')
if BullAlert
alert('Bulish Harmonic')
//CandleStick Confirm
plotshape(BearCandleConfirm, style = shape.arrowdown, color = color.red)
plotshape(BullCandleConfirm, style = shape.arrowup, color = color.green, location = location.belowbar )

Fibo Level DailyOverview
The "Fibo Level Daily" strategy is designed for trading Bitcoin (BTC) using the 1-hour timeframe. This strategy relies on Fibonacci levels calculated from the previous day's range and determines entry and exit points based on whether the previous daily candle was bullish or bearish.
How It Works
Fibonacci Levels Calculation:
The indicator calculates Fibonacci levels (0.8, 0.5, and 0.2) based on the high and low of the previous day.
The levels are calculated as follows:
0.8: This level is calculated by multiplying the difference between the previous day's high and low by 0.8 and adding the result to the previous day's low.
0.5: This is the midpoint of the previous day's range.
0.2: This level is calculated by multiplying the difference between the previous day's high and low by 0.2 and adding the result to the previous day's low.
Identifying the Previous Day's Trend:
The indicator checks if the previous daily candle closed bullish (close greater than open) or bearish (close less than open).
Setting Entry and Take Profit Levels:
If the previous daily candle was bearish:
Sell Entry: Wait for the price to rise to the 0.5 level (midpoint of the previous day's range) to enter a sell position.
Take Profit: The profit target is set at the 0.2 level.
If the previous daily candle was bullish:
Buy Entry: Wait for the price to drop to the 0.5 level (midpoint of the previous day's range) to enter a buy position.
Take Profit: The profit target is set at the 0.8 level.
Visual Representation on the Chart:
The indicator draws horizontal lines on the chart representing the Fibonacci levels (0.8, 0.5, and 0.2) from the previous day. These lines help visualize entry and exit points clearly.
Additionally, the last 15 minutes of the daily session are highlighted with a light red background to indicate the session's end.
Conditions of Use:
Timeframe: This indicator is specifically designed for use on the 1-hour timeframe.
Assets: While it can be used on any asset, it is optimized for trading Bitcoin (BTC).
Steps to Use the Indicator
Add the Indicator:
Insert the "Fibo Level Daily" indicator script into your trading platform (such as TradingView).
Select Timeframe:
Change the chart timeframe to 1 hour.
Interpret the Levels:
Observe the horizontal lines drawn on the chart representing the Fibonacci levels.
Identify whether the previous daily candle was bullish or bearish.
Wait for the Entry Price:
For a bearish previous daily candle: Wait for the price to rise to the 0.5 level to enter a sell position.
For a bullish previous daily candle: Wait for the price to drop to the 0.5 level to enter a buy position.
Set the Profit Target:
For a sell: Set your profit target at the 0.2 level.
For a buy: Set your profit target at the 0.8 level.
Execute the Trade:
Initiate the trade once the price reaches the entry level and set your take profit according to the identified trend from the previous day.
Conclusion
The "Fibo Level Daily" strategy provides a clear and precise methodology for identifying entry and exit points in Bitcoin using Fibonacci levels. By following this step-by-step guide, any trader can take advantage of market movements based on the previous day's price action, optimizing their trading opportunities on the 1-hour timeframe.

Bitcoin Macro Trend Map [Ox_kali]
## Introduction
__________________________________________________________________________________
The “Bitcoin Macro Trend Map” script is designed to provide a comprehensive analysis of Bitcoin’s macroeconomic trends. By leveraging a unique combination of Bitcoin-specific macroeconomic indicators, this script helps traders identify potential market peaks and troughs with greater accuracy. It synthesizes data from multiple sources to offer a probabilistic view of market excesses, whether overbought or oversold conditions.
This script offers significant value for the following reasons:
1. Holistic Market Analysis : It integrates a diverse set of indicators that cover various aspects of the Bitcoin market, from investor sentiment and market liquidity to mining profitability and network health. This multi-faceted approach provides a more complete picture of the market than relying on a single indicator.
2. Customization and Flexibility : Users can customize the script to suit their specific trading strategies and preferences. The script offers configurable parameters for each indicator, allowing traders to adjust settings based on their analysis needs.
3. Visual Clarity : The script plots all indicators on a single chart with clear visual cues. This includes color-coded indicators and background changes based on market conditions, making it easy for traders to quickly interpret complex data.
4. Proven Indicators : The script utilizes well-established indicators like the EMA, NUPL, PUELL Multiple, and Hash Ribbons, which are widely recognized in the trading community for their effectiveness in predicting market movements.
5. A New Comprehensive Indicator : By integrating background color changes based on the aggregate signals of various indicators, this script essentially creates a new, comprehensive indicator tailored specifically for Bitcoin. This visual representation provides an immediate overview of market conditions, enhancing the ability to spot potential market reversals.
Optimal for use on timeframes ranging from 1 day to 1 week , the “Bitcoin Macro Trend Map” provides traders with actionable insights, enhancing their ability to make informed decisions in the highly volatile Bitcoin market. By combining these indicators, the script delivers a robust tool for identifying market extremes and potential reversal points.
## Key Indicators
__________________________________________________________________________________
Macroeconomic Data: The script combines several relevant macroeconomic indicators for Bitcoin, such as the 10-month EMA, M2 money supply, CVDD, Pi Cycle, NUPL, PUELL, MRVR Z-Scores, and Hash Ribbons (Full description bellow).
Open Source Sources: Most of the scripts used are sourced from open-source projects that I have modified to meet the specific needs of this script.
Recommended Timeframes: For optimal performance, it is recommended to use this script on timeframes ranging from 1 day to 1 week.
Objective: The primary goal is to provide a probabilistic solution to identify market excesses, whether overbought or oversold points.
## Originality and Purpose
__________________________________________________________________________________
This script stands out by integrating multiple macroeconomic indicators into a single comprehensive tool. Each indicator is carefully selected and customized to provide insights into different aspects of the Bitcoin market. By combining these indicators, the script offers a holistic view of market conditions, helping traders identify potential tops and bottoms with greater accuracy. This is the first version of the script, and additional macroeconomic indicators will be added in the future based on user feedback and other inputs.
## How It Works
__________________________________________________________________________________
The script works by plotting each macroeconomic indicator on a single chart, allowing users to visualize and interpret the data easily. Here’s a detailed look at how each indicator contributes to the analysis:
EMA 10 Monthly: Uses an exponential moving average over 10 monthly periods to signal bullish and bearish trends. This indicator helps identify long-term trends in the Bitcoin market by smoothing out price fluctuations to reveal the underlying trend direction.Moving Averages w/ 18 day/week/month.
Credit to @ryanman0
M2 Money Supply: Analyzes the evolution of global money supply, indicating market liquidity conditions. This indicator tracks the changes in the total amount of money available in the economy, which can impact Bitcoin’s value as a hedge against inflation or economic instability.
Credit to @dylanleclair
CVDD (Cumulative Value Days Destroyed): An indicator based on the cumulative value of days destroyed, useful for identifying market turning points. This metric helps assess the Bitcoin market’s health by evaluating the age and value of coins that are moved, indicating potential shifts in market sentiment.
Credit to @Da_Prof
Pi Cycle: Uses simple and exponential moving averages to detect potential sell points. This indicator aims to identify cyclical peaks in Bitcoin’s price, providing signals for potential market tops.
Credit to @NoCreditsLeft
NUPL (Net Unrealized Profit/Loss): Measures investors’ unrealized profit or loss to signal extreme market levels. This indicator shows the net profit or loss of Bitcoin holders as a percentage of the market cap, helping to identify periods of significant market optimism or pessimism.
Credit to @Da_Prof
PUELL Multiple: Assesses mining profitability relative to historical averages to indicate buying or selling opportunities. This indicator compares the daily issuance value of Bitcoin to its yearly average, providing insights into when the market is overbought or oversold based on miner behavior.
Credit to @Da_Prof
MRVR Z-Scores: Compares market value to realized value to identify overbought or oversold conditions. This metric helps gauge the overall market sentiment by comparing Bitcoin’s market value to its realized value, identifying potential reversal points.
Credit to @Pinnacle_Investor
Hash Ribbons: Uses hash rate variations to signal buying opportunities based on miner capitulation and recovery. This indicator tracks the health of the Bitcoin network by analyzing hash rate trends, helping to identify periods of miner capitulation and subsequent recoveries as potential buying opportunities.
Credit to @ROBO_Trading
## Indicator Visualization and Interpretation
__________________________________________________________________________________
For each horizontal line representing an indicator, a legend is displayed on the right side of the chart. If the conditions are positive for an indicator, it will turn green, indicating the end of a bearish trend. Conversely, if the conditions are negative, the indicator will turn red, signaling the end of a bullish trend.
The background color of the chart changes based on the average of green or red indicators. This parameter is configurable, allowing adjustment of the threshold at which the background color changes, providing a clear visual indication of overall market conditions.
## Script Parameters
__________________________________________________________________________________
The script includes several configurable parameters to customize the display and behavior of the indicators:
Color Style:
Normal: Default colors.
Modern: Modern color style.
Monochrome: Monochrome style.
User: User-customized colors.
Custom color settings for up trends (Up Trend Color), down trends (Down Trend Color), and NaN (NaN Color)
Background Color Thresholds:
Thresholds: Settings to define the thresholds for background color change.
Low/High Red Threshold: Low and high thresholds for bearish trends.
Low/High Green Threshold: Low and high thresholds for bullish trends.
Indicator Display:
Options to show or hide specific indicators such as EMA 10 Monthly, CVDD, Pi Cycle, M2 Money, NUPL, PUELL, MRVR Z-Scores, and Hash Ribbons.
Specific Indicator Settings:
EMA 10 Monthly: Options to customize the period for the exponential moving average calculation.
M2 Money: Aggregation of global money supply data.
CVDD: Adjustments for value normalization.
Pi Cycle: Settings for simple and exponential moving averages.
NUPL: Thresholds for unrealized profit/loss values.
PUELL: Adjustments for mining profitability multiples.
MRVR Z-Scores: Settings for overbought/oversold values.
Hash Ribbons: Options for hash rate moving averages and capitulation/recovery signals.
## Conclusion
__________________________________________________________________________________
The “Bitcoin Macro Trend Map” by Ox_kali is a tool designed to analyze the Bitcoin market. By combining several macroeconomic indicators, this script helps identify market peaks and troughs. It is recommended to use it on timeframes from 1 day to 1 week for optimal trend analysis. The scripts used are sourced from open-source projects, modified to suit the specific needs of this analysis.
## Notes
__________________________________________________________________________________
This is the first version of the script and it is still in development. More indicators will likely be added in the future. Feedback and comments are welcome to improve this tool.
## Disclaimer:
__________________________________________________________________________________
Please note that the Open Interest liquidation map is not a guarantee of future market performance and should be used in conjunction with proper risk management. Always ensure that you have a thorough understanding of the indicator’s methodology and its limitations before making any investment decisions. Additionally, past performance is not indicative of future results.

Performance IndicatorsDescription:
The Performance Indicators tool provides traders with a comprehensive overview of both fundamental and technical performance metrics of a security. This dual approach helps traders make informed decisions by evaluating the security's intrinsic value as well as its market behavior.
Fundamental Performance Indicators:
EPS Year Over Year % Growth : Measures the percentage growth in earnings per share (EPS) compared to the same quarter in the previous year. This helps in understanding the company's profitability trends.
EPS 3 Quarters Year Over Year % Growth : Analyzes the percentage growth in EPS over the last three quarters compared to the same quarters in the previous year, providing insight into the company's recent earnings performance.
Sales Year Over Year % Growth : Tracks the percentage growth in sales compared to the same quarter in the previous year, offering a view of the company's revenue trends.
Sales 3 Quarters Year Over Year % Growth : Evaluates the percentage growth in sales over the last three quarters compared to the same quarters in the previous year, helping to assess the company's recent revenue performance.
Return On Equity (ROE) : Measures the company's profitability by comparing net income to shareholder equity. This indicates how effectively the company is using its equity base to generate profits.
Market Capitalization : Represents the total market value of the company's outstanding shares, providing a sense of the company's size and market presence.
Float Shares Outstanding : Refers to the number of shares available for trading by the public, excluding restricted shares. This metric helps in understanding the liquidity and volatility of the stock.
Technical Performance Indicators:
Average Daily Range (ADR) %: Calculates the average range between the high and low prices over a specific period, expressed as a percentage. This helps in understanding the stock's daily volatility.
Average True Range (ATR) $ : Measures market volatility by calculating the average range between the high and low prices, taking into account any gaps in the price. It is expressed in dollar terms.
% Off 52-Week High : Indicates how far the current price is from the highest price achieved over the last 52 weeks, helping to assess the stock's current performance relative to its yearly peak.
Relative Price Strength (RPS) : Compares the stock's price performance to a benchmark index, helping to identify how the stock is performing relative to the broader market.
How it Works:
The fundamental performance indicators provide insights into the company's financial health and growth trends by analyzing key metrics such as EPS, sales growth, ROE, market capitalization, and float shares outstanding.
The technical performance indicators offer a view of the stock's market behavior and volatility through metrics like ADR, ATR, % off 52-week high, and RPS.
By combining these fundamental and technical metrics, traders can gain a well-rounded perspective on the security's overall performance.
How to Use:
Add the Performance Indicators tool to your chart.
Evaluate the fundamental indicators to assess the company's financial health and growth trends.
Analyze the technical indicators to understand the stock's market behavior and volatility.
Use the combined insights from both fundamental and technical indicators to make informed trading decisions.
This tool is particularly useful for traders who want to integrate both fundamental analysis and technical analysis into their trading strategy, providing a holistic view of a security's performance.
Smart Money Concept Strategy - Uncle SamThis strategy combines concepts from two popular TradingView scripts:
Smart Money Concepts (SMC) : The strategy identifies key levels in the market (swing highs and lows) and draws trend lines to visualize potential breakouts. It uses volume analysis to gauge the strength of these breakouts.
Smart Money Breakouts : This part of the strategy incorporates the idea of "Smart Money" – institutional traders who often lead market movements. It looks for breakouts of established levels with significant volume, aiming to catch the beginning of new trends.
How the Strategy Works:
Identification of Key Levels: The script identifies swing highs and swing lows based on a user-defined lookback period. These levels are considered significant points where price has reversed in the past.
Drawing Trend Lines: Trend lines are drawn connecting these key levels, creating a visual representation of potential support and resistance zones.
Volume Analysis: The script analyzes the volume during the formation of these levels and during breakouts. Higher volume suggests stronger moves and increases the probability of a successful breakout.
Entry Conditions:
Long Entry: A long entry is triggered when the price breaks above a resistance line with significant volume, and the moving average trend filter (optional) is bullish.
Short Entry: A short entry is triggered when the price breaks below a support line with significant volume, and the moving average trend filter (optional) is bearish.
Exit Conditions:
Stop Loss: Customizable stop loss percentages are implemented to protect against adverse price movements.
Take Profit: Customizable take profit percentages are used to lock in profits.
Credits and Compliance:
This strategy is inspired by the concepts and code from "Smart Money Concepts (SMC) " and "Smart Money Breakouts ." I've adapted and combined elements of both scripts to create this strategy. Full credit is given to the original authors for their valuable contributions to the TradingView community.
To comply with TradingView's House Rules, I've made the following adjustments:
Clearly Stated Inspiration: The description explicitly mentions the original scripts and authors as the inspiration for this strategy.
No Direct Copying: The code has been modified and combined, not directly copied from the original scripts.
Educational Purpose: The primary purpose of this strategy is for learning and backtesting. It's not intended as financial advice.
Important Note:
This strategy is intended for educational and backtesting purposes only. It should not be used for live trading without thorough testing and understanding of the underlying concepts. Past performance is not indicative of future results.

Support and Resistance Breakouts By RICHIESupport and resistance are fundamental concepts in technical analysis used to identify price levels on charts that act as barriers, preventing the price of an asset from getting pushed in a certain direction. Here’s a detailed description of each and how breakout strategies are typically used:
Support
Support is a price level where a downtrend can be expected to pause due to a concentration of demand. As the price of an asset drops, it hits a level where buyers tend to step in, causing the price to rebound.
Support Level Identification: Support levels are identified by looking at historical data where prices have repeatedly fallen to a certain level but have then rebounded.
Strength of Support: The more times an asset price hits a support level without breaking below it, the stronger that support level is considered to be.
Resistance
Resistance is a price level where an uptrend can be expected to pause due to a concentration of selling interest. As the price of an asset increases, it hits a level where sellers tend to step in, causing the price to drop.
Resistance Level Identification: Resistance levels are identified by looking at historical data where prices have repeatedly risen to a certain level but have then fallen back.
Strength of Resistance: The more times an asset price hits a resistance level without breaking above it, the stronger that resistance level is considered to be.
Breakouts
A breakout occurs when the price moves above a resistance level or below a support level with increased volume. Breakouts can be significant because they suggest a change in supply and demand dynamics, often leading to strong price movements.
Breakout Above Resistance: Indicates a bullish market sentiment. Traders often interpret this as a sign to enter a long position (buy).
Breakout Below Support: Indicates a bearish market sentiment. Traders often interpret this as a sign to enter a short position (sell).
Breakout Trading Strategies
Confirmation: Wait for a candle to close beyond the support or resistance level to confirm the breakout.
Volume: Increased volume on a breakout adds credibility, suggesting that the price move is supported by strong buying or selling interest.
Retest: Sometimes, after a breakout, the price will return to the breakout level to test it as a new support or resistance. This retest offers another entry point.
Stop-Loss: Place stop-loss orders just below the resistance (for long positions) or above the support (for short positions) to limit potential losses in case of a false breakout.
Take-Profit: Identify target levels for taking profits. These can be set based on previous support/resistance levels or using tools like Fibonacci retracements.

Turbo Oscillator [RunRox]Introducing Turbo Oscillator by RunRox, our new indicator that combines a multitude of useful and unique features, which we will detail in this post.
List of Advanced Technologies:
Real-Time Divergences: Detects discrepancies between price movements and oscillator indicators to forecast potential price reversals.
Real-Time Hidden Divergences: We identify hidden divergences in real-time. These are not the standard type of divergences; they are opposite to regular divergences, providing unique insights into potential market movements.
Overbought and Oversold Zones: Identifies areas where the market is potentially overextended, suggesting possible entry and exit points.
Signal Line: Indicates the market direction, helping traders to quickly understand current trends.
Money Flow Histogram: Shows the flow of money into and out of the market, providing insights into buying and selling pressure.
Predicted Reversal Zones: Pinpoints areas where the market might experience reversals, aiding in strategic planning and risk management. These zones also serve as potential areas for taking profits, enhancing their utility for exit strategy planning.
Customizable Alerts: You can flexibly set up alerts for any events detected by our indicator, ensuring you stay informed about critical market movements.
To begin with, I would like to describe the difference between classic divergences and hidden divergences.
As you can see, these are opposite situations. Our oscillator identifies both types of divergences and displays them in real-time.
Divergences can serve as points where the price might reverse in the opposite direction, making both classic and hidden divergences powerful tools for spotting reversal points. I'll show a few examples of how divergences are used in our oscillator.
Classic Divergences - which we identify in real-time. As you can see, the price often reacts strongly to the formation of these divergences, frequently changing its direction.
Hidden Divergences - we also observe frequent movement in the opposite direction on the chart. The advantage of our indicator is that we show divergences in real-time without delays, allowing you to react immediately to trend changes.
Overbought and Oversold Zones - These zones allow you to see trend changes when the price is clearly overbought or oversold. When the color changes from a contrasting shade to a neutral one, you can observe the trend shift. The lines work by combining the positivity/negativity of the histogram, the positivity/negativity of the signal line, and the direction of the signal line (red/green). This sophisticated interaction provides precise insights into market conditions, making it an invaluable tool for traders.
Signal Line - This provides insights into trend changes and price reversals. The points on the line better indicate the beginning of a trend shift. These points can vary in size, offering a clearer understanding of the strength of the emerging trend. This feature works in combination with RSI, Stochastic, and MFI. RSI and MFI are top-tier indicators, while Stochastic adds responsiveness and sensitivity to trend changes, ensuring you capture every market movement accurately and promptly.
Money Flow Histogram - As shown in the example, our histogram displays the divergence between money flow and the actual price. You can see that while the price is rising, the money flow is decreasing, indicating insufficient demand for the asset and an imminent trend change. This feature uses MFI with an extended period, providing a more comprehensive and accurate analysis of market conditions. The extended period enhances the reliability of the Money Flow Index, making it an essential tool for identifying subtle shifts in market dynamics.
Predicted Reversal Zones - We automatically identify potential price reversal zones and display them above our overbought and oversold zones. In cases of strong overbought or oversold conditions, we detect potential price pullbacks and mark the beginning of a trend change. This helps you better identify trend shifts. We recommend considering these zones as potential take profit points for your trades.
Customizable Alerts - Our flexible alert system allows you to receive notifications only for the events you are interested in. These can include:
1. Classic Divergences
2. Hidden Divergences
3. Overbought or Oversold conditions on the status line
4. Strong Overbought or Oversold conditions on the status line
5. Signals from the signal line
6. Reversal zones in any direction
Our oscillator is a unique indicator that provides a comprehensive understanding of price movements. It can be used as a standalone tool for analyzing price action.
Here are a few examples of using our Oscillator in practice:
In the example above, you can see three conditions that have formed for a potential trade:
1. Clear overbought condition with a formed reversal point.
2. Decreasing Money Flow Index diverging from the rising price.
3. Formed classic divergence.
The entry point could be the formed divergence, while the exit point could be the overbought condition at the bottom of the oscillator along with the reversal points.
Here's another example of using hidden divergence, where you can see three conditions for a potential trade:
1. Overbought zone
2. Formed hidden divergence
3. Start of bearish movement indicated by the signal line
You can enter the trade either when the hidden divergence forms or wait for confirmation of the trend change by the signal line and enter the trade when the corresponding signal forms on the signal line. The exit point could be the opposite reversal point or the formation of a new hidden divergence.
We have demonstrated a few examples of how you can use our indicator, but we are confident that you will find many more applications in your own strategies.
Oscillator offers a variety of customizable parameters to tailor the indicator to your trading preferences. Here’s what our settings include:
Signal Line
Turn On/Off: Enable or disable the signal line.
Length: Set the length period for the signal line calculation.
Smooth: Adjust the smoothing level of the signal line for more accurate display.
Histogram
Turn On/Off: Enable or disable the histogram.
Length: Set the length period for the histogram calculation.
Smooth: Adjust the smoothing level of the histogram.
Other
Show Divergence Line: Display divergence lines on the chart.
Show Hidden Divergence: Display hidden divergences.
Show Status Line: Show the status line indicating overbought or oversold conditions.
Show TP Signal: Display signals for take profit.
Show Reversal Points: Display potential trend reversal points.
Delete Broken Divergence Lines: Remove broken divergence lines from the chart.
Alerts Customization
Signal Line Bull/Bear: Set alerts for bullish or bearish signals from the signal line.
TP Bull/Bear: Set alerts for take profit signals.
Status Bull/Bear: Set alerts for bullish or bearish status conditions.
Status Bull+/Bear+: Set enhanced alerts for stronger bullish or bearish status conditions.
Divergence Bull/Bear: Set alerts for bullish or bearish divergences.
Hidden Divergence Bull/Bear: Set alerts for hidden bullish or bearish divergences.
With these comprehensive settings, you can fine-tune the Oscillator to perfectly fit your trading strategy and preferences.
Our indicator utilizes technologies such as RSI, Stochastic, and Money Flow Index, with numerous enhancements from our team. It includes exclusive features such as real-time detection of hidden and classic divergences, identification of reversal points using our unique methodology, and much more.
Disclaimer:
While we consider our Turbo Oscillator to be an excellent tool, it is important to understand that past performance is not indicative of future results. We recommend approaching market analysis comprehensively, using a combination of tools and techniques to make well-informed trading decisions. Always consider the full range of market data and risks when using any trading indicator.

Futures Auto Levels [NariCapitalTrading]Futures Auto Levels Indicator
Introduction
The "Futures Auto Levels" (FAL) indicator shows the previous day's levels, weekly open, high, low, and the Initial Balance Range (IBR).
Indicator Components
The FAL indicator comprises the following components:
Previous Day's Levels: These include the open, high, low, and close of the previous trading day. They are represented on the chart by lines and labels, helping to identify significant price levels from the prior session.
Weekly Open, High, Low: These levels represent the open, high, and low prices of the current trading week.
Initial Balance Range (IBR): The IBR is calculated based on the price range during the first 60 minutes of the trading day. It helps identify initial trading range and potential breakout levels.
How to Use the Indicator
1. Previous Day's Levels:
Monitor the previous day's open, high, low, and close to identify key support and resistance levels.
Use these levels to gauge market sentiment and potential price reversals.
2. Weekly Open, High, Low:
Pay attention to the weekly open, high, and low to understand the market's behavior within the weekly timeframe.
These levels can act as reference points for setting profit targets and stop-loss orders.
3. Initial Balance Range (IBR):
Watch for price movements within the IBR to identify potential trading opportunities.
Breakouts above or below the IBR may signal the beginning of a new trend or continuation of the current trend.
Suggested/Potential Strategies
Reversal Trading: Look for price reversals around previous day's levels, especially when they coincide with other technical indicators or significant support/resistance zones.
Trend Following: Follow the trend by trading breakouts above/below the IBR or weekly high/low levels. Use trailing stops to capture profits while the trend remains intact.
Range Trading: Trade within the IBR when the market is consolidating. Buy near the IBR low and sell near the IBR high, with tight stop-loss orders to manage risk.
Conclusion
The Futures Auto Levels indicator is designed to help incorporate levels into trading analysis and trading strategies to improve profitability and consistency.

BlackPika Supertrend Public v2Hello Reader!
What is Supertrend indicator ?
The Supertrend Indicator is a popular technical analysis tool designed to assist traders in identifying market trends.
The indicator combines the average true range (ATR) with a multiplier to calculate its value. This value is then added to or subtracted from the asset’s closing price to plot the supertrend line.
The Supertrend Indicator can help identify trends, manage risk, and confirm market tendencies.
The indicator is limited by its lagging nature, is not very flexible, and can send up false signals.
The Supertrend Indicator has become a staple for traders in stocks, currencies, and commodities for its ability to identify and follow market trends.
About this script:
This script is based on the SuperTrend. There are some extra things added to make it able to use more efficiently. They are listed below:
1. Pullback signals: These signals indicate a pull back after a trend reversal and are the most optimum places where you can add to your existing position. They also come with Alerts !
2. Trailing Stop Loss and Take Profit: These further help to reduce the draw-down and can help you to trail profits with more granularity thus securing gains. This are using RSI levels. RSI levels above 70 will indicate a partial take profit when long and RSI levels below 25 will indicate a take profit level when short.
How to use ?
----------------
Personally I use it on major pairs on cryptocurrencies like BTCUSD . Usually after the trend flips, there will be pullbacks, You can enter a part of the position when trend reversal is confirmed. (LONG signal)
Then add more when you get a pullback (PB_LONG signal).
To make life simpler, alerts are added for pullback signals as well. These can help acheive good entry price. Entering at pullback signals limits your losses to a great extent, as the trend will flip on the bar close if it goes against you.
You can trade manually or you can automate. All the signals have been provided with Alerts. some signals have been grouped, to reduce the number of the alerts if you wish to.
I wish you all the luck and please comment and Like if you have any doubts.

Trailing Management (Zeiierman)█ Overview
The Trailing Management (Zeiierman) indicator is designed for traders who seek an automated and dynamic approach to managing trailing stops. It helps traders make systematic decisions regarding when to enter and exit trades based on the calculated risk-reward ratio. By providing a clear visual representation of trailing stop levels and risk-reward metrics, the indicator is an essential tool for both novice and experienced traders aiming to enhance their trading discipline.
The Trailing Management (Zeiierman) indicator integrates a Break-Even Curve feature to enhance its utility in trailing stop management and risk-reward optimization. The Break-Even Curve illuminates the precise point at which a trade neither gains nor loses value, offering clarity on the risk-reward landscape. Furthermore, this precise point is calculated based on the required win rate and the risk/reward ratio. This calculation aids traders in understanding the type of strategy they need to employ at any given time to be profitable. In other words, traders can, at any given point, assess the kind of strategy they need to utilize to make money, depending on the price's position within the risk/reward box.
█ How It Works
The indicator operates by computing the highest high and the lowest low over a user-defined period and then applying this information to determine optimal trailing stop levels for both long and short positions.
Directional Bias:
It establishes the direction of the market trend by comparing the index of the highest high and the lowest low within the lookback period.
Bullish
Bearish
Trailing Stop Adjustment:
The trailing stops are adjusted using one of three methods: an automatic calculation based on the median of recent peak differences, pivot points, or a fixed percentage defined by the user.
The Break-Even Curve:
The Break-Even Curve, along with the risk/reward ratio, is determined through the trailing method. This approach utilizes the current closing price as a hypothetical entry point for trades. All calculations, including those for the curve, are based on this current closing price, ensuring real-time accuracy and relevance. As market conditions fluctuate, the curve dynamically adjusts, offering traders a visual benchmark that signifies the break-even point. This real-time adjustment provides traders with an invaluable tool, allowing them to visually track how shifts in the market could impact the point at which their trades neither gain nor lose value.
Example:
Let's say the price is at the midpoint of the risk/reward box; this means that the risk/reward ratio should be 1:1, and the minimum win rate is 50% to break even.
In this example, we can see that the price is near the stop-loss level. If you are about to take a trade in this area and would respect your stop, you only need to have a minimum win rate of 11% to earn money, given the risk/reward ratio, assuming that you hold the trade to the target.
In other words, traders can, at any given point, assess the kind of strategy they need to employ to make money based on the price's position within the risk/reward box.
█ How to Use
Market Bias:
When using the Auto Bias feature, the indicator calculates the underlying market bias and displays it as either bullish or bearish. This helps traders align their trades with the underlying market trend.
Risk Management:
By observing the plotted trailing stops and the risk-reward ratios, traders can make strategic decisions to enter or exit positions, effectively managing the risk.
Strategy selection:
The Break-Even Curve is a powerful tool for managing risk, allowing traders to visualize the relationship between their trailing stops and the market's price movements. By understanding where the break-even point lies, traders can adjust their strategies to either lock in profits or cut losses.
Based on the plotted risk/reward box and the location of the price within this box, traders can easily see the win rate required by their strategy to make money in the long run, given the risk/reward ratio.
Consider this example: The market is bullish, as indicated by the bias, and the indicator suggests looking into long trades. The price is near the top of the risk/reward box, which means entering the market right now carries a huge risk, and the potential reward is very low. To take this trade, traders must have a strategy with a win rate of at least 90%.
█ Settings
Trailing Method:
Auto: The indicator calculates the trailing stop dynamically based on market conditions.
Pivot: The trailing stop is adjusted to the highest high (long positions) or lowest low (short positions) identified within a specified lookback period. This method uses the pivotal points of the market to set the trailing stop.
Percentage: The trailing stop is set at a fixed percentage away from the peak high or low.
Trailing Size (prd):
This setting defines the lookback period for the highest high and lowest low, which affects the sensitivity of the trailing stop to price movements.
Percentage Step (perc):
If the 'Percentage' method is selected, this setting determines the fixed percentage for the trailing stop distance.
Set Bias (bias):
Allows users to set a market bias which can be Bullish, Bearish, or Auto, affecting how the trailing stop is adjusted in relation to the market trend.
-----------------
Disclaimer
The information contained in my Scripts/Indicators/Ideas/Algos/Systems does not constitute financial advice or a solicitation to buy or sell any securities of any type. I will not accept liability for any loss or damage, including without limitation any loss of profit, which may arise directly or indirectly from the use of or reliance on such information.
All investments involve risk, and the past performance of a security, industry, sector, market, financial product, trading strategy, backtest, or individual's trading does not guarantee future results or returns. Investors are fully responsible for any investment decisions they make. Such decisions should be based solely on an evaluation of their financial circumstances, investment objectives, risk tolerance, and liquidity needs.
My Scripts/Indicators/Ideas/Algos/Systems are only for educational purposes!

Turtle Trading Strategy@lihexieThe full implementation of the Turtle Trading Rules (as distinct from the various truncated versions circulating within the community) is now ready.
This trading strategy script distinguishes itself from all currently publicly available Turtle trading systems on Tradingview by comprehensively embodying the rules for entries, exits, position management, and profit and loss controls.
Market Selection:
Trade in highly liquid markets such as forex, commodity futures, and stock index futures.
Entry Strategies:
Model 1: Buy when the price breaks above the highest point of the last 20 trading days; Sell when the price drops below the lowest point of the last 20 trading days. When an entry opportunity arises, if the previous trade was profitable, skip the current breakout opportunity and refrain from entering.
Model 2: Buy when the price breaks above the highest point of the last 55 trading days; Sell when the price drops below the lowest point of the last 55 trading days.
Position Sizing:
Determine the size of each position based on the price volatility (ATR) to ensure that the risk of each trade does not exceed 2% of the account balance.
Exit Strategies:
1. Use a fixed stop-loss point to limit losses: Close long positions when the price falls below the lowest point of the last 10 trading days.
2. Trailing stop-loss: Once a position is profitable, adjust the stop-loss point to protect profits.
Pyramiding Rules:
Unit Doubling: Increase position size by one unit every time the price moves forward by n (default is 0.5) units of ATR, up to a maximum of 4 units, while also raising the stop-loss point to below the ATR value at the level of additional entries.
海龟交易法则的完整实现(区别于当前社区各种有阉割海龟交易系统代码)
本策略脚本区别于Tradingview目前公开的所有的海龟交易系统,完整的实现了海龟交易法则中入场、出场、仓位管理,止盈止损的规则。
市场选择:
选择流动性高的市场进行交易,如外汇、商品期货和股指期货等。
入市策略:
模式1:当价格突破过去20个交易日的高点时,买入;当价格跌破过去20个交易日的低点时,卖出。当出现入场机会时,如果上一笔交易是盈利的,那么跳过当前突破的机会,不进行入场。
模式2:当价格突破过去55个交易日的高点时,买入;当价格跌破过去55个交易日的低点时,卖出。
头寸规模:
根据价格波动性(ATR)来确定每个头寸的大小, 使每笔交易的风险不超过账户余额的2%。
退出策略:
1. 使用一个固定的止损点来限制损失:当多头头寸的价格跌破过去10个交易日的低点时,平仓止损。
2. 跟踪止损:一旦头寸盈利,移动止损点以保护利润。
加仓规则:
单位加倍:每当价格向前n(默认是0.5)个单位的ATR移动时,就增加一个单位的头寸大小(默认最大头寸数量是4个),同时将止损点提升至加仓点位的ATR值以下。

TTP Intelligent AccumulatorThe intelligent accumulator is a proof of concept strategy. A hybrid between a recurring buy and TA-based entries and exits.
Distribute the amount of equity and add to your position as long as the TA condition is valid.
Use the exit TA condition to define your exit strategy.
Decide between adding only into losing positions to average down or take a riskier approach by allowing to add into a winning position as well.
Take full profit or distribute your exit into multiple take profit exists of the same size.
You can also decide if you allow your exit conditions to close your position in a loss or require a minimum take profit %.
The strategy includes a default built-in TA conditions just for showcasing the idea but the final intent of this script is to delegate the TA entries and exists to external sources.
The internal conditions use RSI length 7 crossing below the BB with std 1 for entries and above for exits.
To control the number of orders use the properties from settings:
- adjust the pyramiding
- adjust the percentage of equity
- make sure that pyramiding * % equity equals 100 to prevent over use of equity (unless using leverage)
The script is designed as an alternative to daily or weekly recurring buys but depending on the accuracy of your TA conditions it might prove profitable also in lower timeframes.
The reason the script is named Intelligent is because recurring buy is most commonly used without any decision making: buy no matter what with certain frequency. This strategy seeks to still perform recurring buys but filtering out some of the potential bad entries that can delay unnecessarily seeing the position in profits. The second reason is also securing an exit strategy from the beginning which no recurring buy option offers out-of-the-box.

ROCE with 3-Year EMAThis Pine Script indicator, "3-Year EMA of Return on Capital Employed (ROCE)," is designed for investors and traders who incorporate both fundamental and technical analysis in their market approach. ROCE is a crucial metric for evaluating the efficiency and profitability of a company's capital employment. Our script enhances this analysis by overlaying a 3-year Exponential Moving Average (EMA) on the ROCE, allowing users to compare current performance against a longer-term trend.
Key Features:
ROCE Calculation: The script calculates the Return on Capital Employed (ROCE) using EBIT (Earnings Before Interest and Taxes) for the Trailing Twelve Months (TTM) and Capital Employed (Total Assets minus Short Term Debt) for the Fiscal Year (FY). This calculation provides a snapshot of how effectively a company is using its capital to generate profits.
3-Year EMA Overlay: The script features a 3-year EMA of the ROCE, providing a smoothed, long-term trend line. This EMA helps in identifying broader trends in a company's operational efficiency and profitability, making it easier to spot deviations from the historical norm.
Customizable for Different Data Frequencies: Whether your data is quarterly, monthly, or weekly, the script is adaptable. The length of the EMA is adjustable to suit the data frequency, ensuring accurate representation over a 3-year period.
Visualization: The ROCE and its 3-year EMA are plotted with distinct colors for easy comparison and analysis. This visual representation aids in quickly assessing the company's current performance against its historical trend.
Customization: Users can adjust the EMA length to match the frequency of their data (e.g., 12 for quarterly, 36 for monthly, 156 for weekly data).
Usage Tips:
Best used on companies with stable and consistent reporting.
Combine with other fundamental and technical indicators fo
r comprehensive analysis.
Disclaimer: This script is provided for informational and educational purposes only and should not be construed as investment advice.

Donchian Quest Research// =================================
Trend following strategy.
// =================================
Strategy uses two channels. One channel - for opening trades. Second channel - for closing.
Channel is similar to Donchian channel, but uses Close prices (not High/Low). That helps don't react to wicks of volatile candles (“stop hunting”). In most cases openings occur earlier than in Donchian channel. Closings occur only for real breakout.
// =================================
Strategy waits for beginning of trend - when price breakout of channel. Default length of both channels = 50 candles.
Conditions of trading:
- Open Long: If last Close = max Close for 50 closes.
- Close Long: If last Close = min Close for 50 closes.
- Open Short: If last Close = min Close for 50 closes.
- Close Short: If last Close = max Close for 50 closes.
// =================================
Color of lines:
- black - channel for opening trade.
- red - channel for closing trade.
- yellow - entry price.
- fuchsia - stoploss and breakeven.
- vertical green - go Long.
- vertical red - go Short.
- vertical gray - close in end, don't trade anymore.
// =================================
Order size calculated with ATR and volatility.
You can't trade 1 contract in BTC and 1 contract in XRP - for example. They have different price and volatility, so 1 contract BTC not equal 1 contract XRP.
Script uses universal calculation for every market. It is based on:
- Risk - USD sum you ready to loss in one trade. It calculated as percent of Equity.
- ATR indicator - measurement of volatility.
With default setting your stoploss = 0.5 percent of equity:
- If initial capital is 1000 USD and used parameter "Permit stop" - loss will be 5 USD (0.5 % of equity).
- If your Equity rises to 2000 USD and used parameter "Permit stop"- loss will be 10 USD (0.5 % of Equity).
// =================================
This Risk works only if you enable “Permit stop” parameter in Settings.
If this parameter disabled - strategy works as reversal strategy:
⁃ If close Long - channel border works as stoploss and momentarily go Short.
⁃ If close Short - channel border works as stoploss and momentarily go Long.
Channel borders changed dynamically. So sometime your loss will be greater than ‘Risk %’. Sometime - less than ‘Risk %’.
If this parameter enabled - maximum loss always equal to 'Risk %'. This parameter also include breakeven: if profit % = Risk %, then move stoploss to entry price.
// =================================
Like all trend following strategies - it works only in trend conditions. If no trend - slowly bleeding. There is no special additional indicator to filter trend/notrend. You need to trade every signal of strategy.
Strategy gives many losses:
⁃ 30 % of trades will close with profit.
⁃ 70 % of trades will close with loss.
⁃ But profit from 30% will be much greater than loss from 70 %.
Your task - patiently wait for it and don't use risky setting for position sizing.
// =================================
Recommended timeframe - Daily.
// =================================
Trend can vary in lengths. Selecting length of channels determine which trend you will be hunting:
⁃ 20/10 - from several days to several weeks.
⁃ 20/20 or 50/20 - from several weeks to several months.
⁃ 50/50 or 100/50 or 100/100 - from several months to several years.
// =================================
Inputs (Settings):
- Length: length of channel for trade opening/closing. You can choose 20/10, 20/20, 50/20, 50/50, 100/50, 100/100. Default value: 50/50.
- Permit Long / Permit short: Longs are most profitable for this strategy. You can disable Shorts and enable Longs only. Default value: permit all directions.
- Risk % of Equity: for position sizing used Equity percent. Don't use values greater than 5 % - it's risky. Default value: 0.5%.
⁃ ATR multiplier: this multiplier moves stoploss up or down. Big multiplier = small size of order, small profit, stoploss far from entry, low chance of stoploss. Small multiplier = big size of order, big profit, stop near entry, high chance of stoploss. Default value: 2.
- ATR length: number of candles to calculate ATR indicator. It used for order size and stoploss. Default value: 20.
- Close in end - to close active trade in the end (and don't trade anymore) or leave it open. You can see difference in Strategy Tester. Default value: don’t close.
- Permit stop: use stop or go reversal. Default value: without stop, reversal strategy.
// =================================
Properties (Settings):
- Initial capital - 1000 USD.
- Script don't uses 'Order size' - you need to change 'Risk %' in Inputs instead.
- Script don't uses 'Pyramiding'.
- 'Commission' 0.055 % and 'Slippage' 0 - this parameters are for crypto exchanges with perpetual contracts (for example Bybit). If use on other markets - set it accordingly to your exchange parameters.
// =================================
Big dataset used for chart - 'BITCOIN ALL TIME HISTORY INDEX'. It gives enough trades to understand logic of script. It have several good trends.
// =================================

Narrow Range StrategyNarrow Range Strategy :
INTRODUCTION :
This strategy is based on the Narrow Range Day concept, implying that low volatility will generate higher volatility in the days ahead. The strategy sends us buy and sell signals with well-defined profit targets. It's a medium/long-term strategy. There's also a money management method that allows us to reinvest part of the profits or reduce the size of orders in the event of substantial losses.
NARROW RANGE (NR) DAY :
A Narrow Range Day is a day in which price variations are included in those of a specific day some time before. The high and low of this specific day form the "reference range". In general, we compare these variations with those of 4 or 7 days ago. The mathematical formula for finding an NR4 is :
If low > low(4) and high < high(4) :
nr = true
This implies that the current low is greater than the low of 4 days ago, and the current high is smaller than the high of 4 days ago. So today's volatility is lower than that of 4 days ago, and may be a sign of high volatility to come.
PARAMETERS :
Narrow Range Length : Corresponds to the number of candles back to compare current volatility. The default is 4, allowing comparison of current volatility with that of 4 candles ago.
Stop Loss : Percentage of the reference range on which to set an exit order to limit losses. The minimum value is 0.001, while the maximum is 1. The default value is 0.35.
Fixed Ratio : This is the amount of gain or loss at which the order quantity is changed. The default is 400, which means that for each $400 gain or loss, the order size is increased or decreased by an amount chosen by the user.
Increasing Order Amount : This is the amount to be added to or subtracted from orders when the fixed ratio is reached. The default is $200, which means that for every $400 gain, $200 is reinvested in the strategy. On the other hand, for every $400 loss, the order size is reduced by $200.
Initial capital : $1000
Fees : Interactive Broker fees apply to this strategy. They are set at 0.18% of the trade value.
Slippage : 3 ticks or $0.03 per trade. Corresponds to the latency time between the moment the signal is received and the moment the order is executed by the broker.
Important : A bot was used to test NR4 and NR7 with all possible Stop Losses in order to find out which combination generates the highest return on BITSTAMP:ETHUSD while limiting the drawdown. This strategy is the most optimal with an NR4 and a SL of 35% of the reference range size in 5D timeframe.
BUY AND SHORT SIGNALS :
When an NR is spotted, we create two stop orders on the high and low of the reference range. As soon as there's a breakout from this reference range (shown in blue on the chart), we open a position. We're LONG if there's a breakout on the high and SHORT if there's a breakout on the low. Executing a stop order cancels the second stop order.
RISK MANAGEMENT :
This strategy is subject to losses. We manage our risk with Stop Losses. The user is free to enter a SL as a percentage of the reference range. The maximum amount risked per trade therefore depends on the size of the range. The larger the range, the greater the risk. That's why we have set a maximum Stop Loss to 10% to limiting risks per trade.
The special feature of this strategy is that it targets a precise profit objective. This corresponds to the size of the reference range at the top of the high if you're LONG, or at the bottom of the low if you're short. In the same way, the larger the reference range, the greater the potential profits.
The risk reward remains the same for all trades and amounts to : 100/35 = 2.86. If the reference range is too high, we have set a SL to 10% of the trade value to limit losses. In that case, the risk reward is less than 2.86.
MONEY MANAGEMENT :
The fixed ratio method was used to manage our gains and losses. For each gain of an amount equal to the value of the fixed ratio, we increase the order size by a value defined by the user in the "Increasing order amount" parameter. Similarly, each time we lose an amount equal to the value of the fixed ratio, we decrease the order size by the same user-defined value. This strategy increases both performance and drawdown.
NOTE :
Please note that the strategy is backtested from 2017-01-01. As the timeframe is 5D, this strategy is a medium/long-term strategy. That's why only 37 trades were closed. Be careful, as the test sample is small and performance may not necessarily reflect what may happen in the future.
Enjoy the strategy and don't forget to take the trade :)

Auto Trailing stoploss By InvestYourAsset💥The Auto Trailing Stop-Loss indicator is a technical indicator that uses the ATR (Average True Range) to calculate a trailing stop-loss for both long and short positions.
💥The signals according to the indicator allows traders to exit from the position before its too late! The indicator can be used to determine when to enter and exit trades.
💥To use the indicator, you simply need to set the input parameters to suit your trading style and risk tolerance. The default values for the parameters are:
p: The ATR period (14)
q: The stop period (20)
x: The multiplier used to calculate the initial high and initial low (1.5)
Calculations:
📈Calculates the ATR using the specified period you can modify ATR period according to your trading style.
📈Calculates the initial high and low stop levels based on the highest high and lowest low over the user defined ATR period.
📈Calculates short and long stoploss levels using the initial high and low stops.
💥Once you have set the input parameters according to your trading style whether you are a day trader or a swing trader, the indicator will plot the short stoploss, long stoploss, and stoploss hit signals on your chart.
💥You can use the indicator to enter and exit trades in a various ways.
For example,
🚀 you could enter a long trade when the price crosses above both red and green lines plotted on the chart. (or when price crosses over both short stoploss and long stoploss.) You could also use the indicator to secure your profits by moving your stop-loss up as the price moves in your favor.
Here is an example of how you could use the indicator to enter and exit trades:
🚀Enter a long trade when the price crosses above the red line or short stoploss.
✅keep Moving your stop-loss upward with the long stoploss or green line.
✅Exit the trade when the price crosses below the long stoploss or green line.
💥You can also use the indicator to protect your existing trades. For example, if you are already in a long trade, you could move your stop-loss up to the short stop when the price moves up 10%. This will help you to protect your profits in case the price starts to move against you.
💥💥some additional tips for using the Auto Trailing Stop-Loss indicator:
✅Use the indicator in conjunction with other technical indicators or your own trading strategy to generate entry and exit signals.
✅Backtest your trading strategy before using it live to make sure that it is profitable.
✅Use the indicator to protect your profits by moving your stop-loss up as the price moves in your favor.
✅ Always follow risk management rules and manage your position sizing according to your risk appetite.
✅ Be aware of the overall trend direction. If the trend is up, you should be looking for bullish reversals or continuations. If the trend is down, you should be looking for bearish reversals or continuations.
This script essentially provides a visual representation of a trading strategy that automatically adjusts stop-loss levels based on market volatility (ATR). It also includes signals for entering long or short positions and visually highlights these signals on the chart.
📣📣Follow us for timely updates regarding future indicators and give it a like if you appreciate the work.📣📣

Risk Reward Optimiser [ChartPrime]█ CONCEPTS
In modern day strategy optimization there are few options when it comes to optimizing a risk reward ratio. Users frequently need to experiment and go through countless permutations in order to tweak, adjust and find optimal in their data.
Therefore we have created the Risk Reward Optimizer.
The Risk Reward Optimizer is a technical tool designed to provide traders with comprehensive insights into their trading strategies.
It offers a range of features and functionalities aimed at enhancing traders' decision-making process.
With a focus on comprehensive data, it is there to help traders quickly and efficiently locate Risk Reward optimums for inbuilt of custom strategies.
█ Internal and external Signals:
The script can optimize risk to reward ratio for any type of signals
You can utilize the following :
🔸Internal signals ➞ We have included a number of common indicators into the optimizer such as:
▫️ Aroon
▫️ AO (Awesome Oscillator)
▫️ RSI (Relative Strength Index)
▫️ MACD (Moving Average Convergence Divergence)
▫️ SuperTrend
▫️ Stochastic RSI
▫️ Stochastic
▫️ Moving averages
All these indicators have 3 conditions to generate signals :
Crossover
High Than
Less Than
🔸External signal
▫️ by incorporating your own indicators into the analysis. This flexibility enables you to tailor your strategy to your preferences.
◽️ How to link your signal with the optimizer:
In order to be able to analysis your signal we need to read it and to do so we would need to PLOT your signal with a defined value
plot( YOUR LONG Condition ? 100 : 0 , display = display.data_window)
█ Customizable Risk to Reward Ratios:
This tool allows you to test seven different customizable risk to reward ratios , helping you determine the most suitable risk-reward balance for your trading strategy. This data-driven approach takes the guesswork out of setting stop-loss and take-profit levels.
█ Comprehensive Data Analysis:
The tool provides a table displaying key metrics, including:
Total trades
Wins
Losses
Profit factor
Win rate
Profit and loss (PNL)
This data is essential for refining your trading strategy.
🔸 It includes a tooltip for each risk to reward ratio which gives data for the:
Most Profitable Trade USD value
Most Profitable Trade % value
Most Profitable Trade Bar Index
Most Profitable Trade Time (When it occurred)
Position and size is adjustable
█ Visual insights with histograms:
Visualize your trading performance with histograms displaying each risk to reward ratio trade space, showing total trades, wins, losses, and the ratio of profitable trades.
This visual representation helps you understand the strengths and weaknesses of your strategy.
It offers tooltips for each RR ratio with the average win and loss percentages for further analysis.
█ Dynamic Highlighting:
A drop-down menu allows you to highlight the maximum values of critical metrics such as:
Profit factor
Win rate
PNL
for quick identification of successful setups.
█ Stop Loss Flexibility:
You can adjust stop-loss levels using three different calculation methods:
ATR
Pivot
VWAP
This allows you to align risk-reward ratios with your preferred risk tolerance.
█ Chart Integration:
Visualize your trades directly on your price chart, with each trade displayed in a distinct color for easy tracking.
When your take-profit (TP) level is reached , the tool labels the corresponding risk-reward ratio for that specific TP, simplifying trade management.
█ Detailed Tooltips:
Tooltips provide deeper insights into your trading performance. They include information about the most profitable trade, such as the time it occurred, the bar index, and the percentage gain. Histogram tooltips also offer average win and loss percentages for further analysis.
█ Settings:
█ Code:
In summary, the Risk Reward Optimizer is a data-driven tool that offers traders the ability to optimize their risk-reward ratios, refine their strategies, and gain a deeper understanding of their trading performance. Whether you're a day trader, swing trader, or investor, this tool can help you make informed decisions and improve your trading outcomes.
