[ProfitTrailer:Feeder] ATRThis script was created to help people determine which ATR settings work for them in the ProfitTrailer bot as well as set specific groupings in PTFeeder. For more in-depth knowledge on how it's calculated/works I would advice you to visit the ProfitTrailer and/or PtFeeder wiki pages.
If you have any questions, please just let me know! Enjoy
Cerca negli script per "profit"

Profitable Loser Model [MMT]Profitable Loser Model
Overview
The Profitable Loser Model is a powerful PineScript v6 indicator designed to enhance your trading by visualizing key price levels, session open zones, Fibonacci retracements, and premium/discount zones. This overlay indicator provides traders with a customizable toolkit to analyze market structure across any timeframe, making it ideal for intraday and swing trading strategies.
Features
Open Zone Visualization
- Plots a box based on the open and close of the first candle in a user-defined timeframe (default: 5-minute).
- Customizable box color, projection offset, and label size (Tiny, Small, Normal, Large).
- Displays a timeframe label (e.g., "5m Open Zone") for quick reference, toggleable on/off.
Session Open Lines
- Optionally draws horizontal lines at key session opens (8:30 AM, 9:30 AM, 1:30 PM, Midnight, New York time).
- Customize line color, style (Solid, Dashed, Dotted), width, and label size for each session.
- Perfect for identifying critical intraday price levels.
Premium and Discount Zones
- Highlights premium (above midpoint) and discount (below midpoint) zones based on session high/low.
- Toggleable with customizable colors and projection offsets.
- Helps traders spot overbought/oversold areas for potential mean-reversion trades.
Fibonacci Retracement Levels
- Plots user-defined Fibonacci levels (default: 0.23, 0.35, 0.5, 0.62, 0.705, 0.79, 0.886, 1, 1.1).
- Customizable line style, width, color, and labels (showing percentage and/or price).
- Dynamically adjusts based on price movement relative to the open zone.
Take Profit (TP) and Stop Loss (SL) Levels
- Highlights TP (default: 0.23) and SL (default: 1.1) Fibonacci levels with distinct colors.
- Fully customizable to align with your risk-reward strategy.
How It Works
- Session Detection : Resets daily (or per user-defined timeframe) to capture the first candle's open, high, low, and close.
- Open Zone : Draws a box between the open and close, extended forward by the projection offset.
- Session Lines : Plots lines at specified session opens with customizable styles and labels.
- Fibonacci Retracement : Adjusts levels dynamically based on session high/low and price action.
- Premium/Discount Zones : Calculated from the session range midpoint, updated in real-time.
Settings
- Open Zone :
- Timeframe (default: 5m), Calculate Timeframe (default: Daily).
- Toggle label, adjust size, box color, and projection offset.
- Session Open Lines :
- Enable/disable lines for 8:30 AM, 9:30 AM, 1:30 PM, Midnight.
- Customize color, style, width, label size, and vertical offset.
- Premium/Discount Zones :
- Toggle visibility, set colors, and adjust projection offset.
- Fibonacci Retracement :
- Toggle visibility, set custom levels, line style, width, color, and label options.
- Adjust projection offset.
- TP/SL :
- Set TP/SL Fibonacci levels and colors.
Use Cases
- Intraday Trading : Use session open lines and open zones to trade key market hours.
- Swing Trading : Leverage Fibonacci levels for potential reversal or continuation zones.
- Risk Management : Set precise TP/SL levels based on Fibonacci retracements.
- Market Structure : Identify overbought/oversold zones with premium/discount areas.
Notes
- Optimized with `dynamic_requests = true` for efficient real-time data handling.
- Visual elements (boxes, lines, labels) are cleaned up at the start of each new session.
- Session lines use New York time (`America/New_York`) for alignment with major markets.

Profit Maximizer PMax Strategy - Long-ShortI developed a different strategy perspective for the Profit Maximizer PMax indicator prepared by Kıvanç Özbilgiç.
When you come to the settings section;
- You will see 2 options as Straregy Type. You can test the price and pmax intersections as different strategies.
- I added the Long-Short option for spot traders to calculate the profitability rate correctly. Spot traders should not choose this option.
Here you can set alarms on the original indicator with the parameters you find successful.
Türkçe:
Kıvanç Özbilgiç tarafından hazırlanan Profit Maximizer PMax indikatör için farklı bir strateji bakış açısı geliştirdim.
Ayarlar bölümüne geldiğinizde;
- Straregy Type olarak 2 seçenek göreceksiniz. Fiyat kesişimi ve pmax kesişimlerini, farklı stratejiler olarak test edebilirsiniz.
- Spot işlem yapanlar için karlılık oranını doğru hesaplayabilmeleri için Long-Short seçeneği ekledim. Spot işlem yapanların bu seçeneği seçmemeleri gerekmektedir.
Burada başarılı bulduğunuz parametreler ile orijinal indikatör üzerinde alarmlar kurabilirsiniz.

Moving Average profit targets with var sizeProfit target:
Profit targets are those scenarios where the system expects to be greater than the actual return at the end of the transaction: they may be short-term benefits, such as a favorable price shock model.
In short-term transactions, profit objectives are essential. Price fluctuations make any favorable event likely to turn around in an instant. Moreover, profit objectives are more difficult to integrate into the longer-term trading system, because they are afraid of losing larger profits at risk, so they will replace them with smaller but more frequent gains. As a follower of the trend, once you make a profit and stop earning, but the trend direction is still intact, you need to find a way to re-enter the transaction to avoid losing the rare but very large market situation.
Profit target is best calculated based on price volatility (V), and the most commonly used method:
For Long, the system buy point (E), needs to be multiplied by the average true volatility or annualized volatility :E+f×V.
The net value multiplier f used to calculate the profit level is usually obtained through data mining.

Profitability IndexDisplays the percent difference from the outer Bollinger Band to the middle Bollinger Band, in addition to the Simple Moving Average of the Profitability Index itself.
Grants the trader the ability to quickly ascertain the instrument's profitability based on its current and recent percentage of movement.
Profit booking Indicatorell signal when RSI < 40, MACD crosses zero or signal line downward in negative zone, close below 50 EMA, candle bearish.
Strong sell signal confirmed on 5-minute higher timeframe with same conditions.
Square off half/full signals as defined.
Target lines drawn bold based on previous swing lows and extended as described.
Blue candle color when RSI below 30.
One sell and one full square off per cycle, blocking repeated sells until full square off.

Profitable Mondays & Losing FridaysHere's a Pine Script that marks profitable Mondays and losing Fridays for a given stock:
Explanation
Input Parameter: The script allows you to input the stock symbol, defaulting to SPX.
Daily Returns: It calculates the daily return based on the closing price.
Day Identification: It checks if the current day is Monday or Friday.
Conditions:
Profitable Mondays: Marks with a green background if Monday's return is positive.
Losing Fridays: Marks with a red background if Friday's return is negative.
Visualization: Uses bgcolor to highlight the respective days on the chart.
You can adjust the stockSymbol input to analyze different stocks.
Profitable Contrarian scalpingUses the 5 period and 10 period VMWAs that have been smoothed with a 5 period SMA of the close price. Normally, a short crossover long formation signals a buy signal, but as scalpers know, the 1 minute chart moves so fast and with so much volatility that lagging indicators get wrecked by the market. According, this strategy operates under the assumption that by the time this lagging indicator makes a signal, the price is ready to reverse. Losses are taken swiftly in the case of a continuation pattern. This indicator averages a 55-65% profitable rate and is almost always a positive P/L on the 1 minute chart of the most commonly traded assets.
Of course, there may be validity for this indicator outside the 1 minute chart, but I have found such success to be very limited. Accordingly, use this indicator on SPY, TQQQ, TSLA, AMZN, and major cryptos on the 1 min chart.

Profit Punch: Risk & Target Planner (ATR + Fixed R)Profit Punch: Risk & Target Planner (ATR + Fixed R)
This indicator is a complete trade planning tool designed to visualize your Risk (R) and Reward levels instantly. Whether you use a volatility-based strategy (ATR) or precise manual levels, this tool draws your roadmap directly on the chart.
It solves the problem of calculating "R-Multiples" manually and ensures every trade plan is consistent.
Key Features
1. Smart Risk Calculation
Auto Mode (ATR): Uses the stock's daily volatility (ATR) to automatically suggest a logical Stop Loss.
Manual Mode: Lets you type in your exact Stop Loss price (e.g., below a recent low), and the tool automatically adjusts your Profit Targets to match that specific risk.
2. Hybrid Targeting (The "Nuance")
You can set a tight manual stop but keep your profit targets based on daily volatility (ATR). This allows for "Hybrid" setups where you risk a small amount (tight stop) but aim for a standard volatility move (ATR targets).
3. Backtesting Friendly
Use the "Target Date" feature to apply the tool to any past candle. It will calculate the targets based on what the volatility was on that specific day , allowing you to accurately review past trades.
4. Clean & Customizable
Editable Labels: Rename "1R" to "Goal 1" or "Take Profit".
Clean Look: Toggle any line on/off to keep your chart simple.
Timeframe Independent: Calculations are always anchored to Daily data for consistency, even if you are viewing a 5-minute chart.
How to Use
Step 1: Add to Chart. The lines will appear on the latest bar by default.
Step 2: Set Entry. In Settings, check "Use Manual Entry" to type your exact buy price, or leave unchecked to use the closing price.
Step 3: Set Stop. Choose "Auto (ATR)" for a volatility-based stop, or "Manual Price" to type in your specific stop level.
Step 4: Visualize. The tool draws your 1R, 3R, 5R, and 7R targets instantly.
Settings Guide
Risk Factor: Multiplier for the ATR calculation (Default is 1.5).
Target Base: Choose whether profit targets are multiples of your Stop Distance (Classic) or Fixed ATR (Volatility).
Custom Labels: Change the text displayed on the chart (e.g., "Safe Exit" instead of "1R").
Who is this for?
This tool is built for swing traders, educators, and anyone who uses "R-Multiples" (Risk Units) to manage their portfolio. It is especially useful for creating consistent trade plan screenshots.

Profit Hunter @DaviddTechProfit Hunter @DaviddTech is an advanced multi-strategy indicator designed to give traders a significant edge in identifying high-probability trading opportunities across all market conditions. By combining the power of T3 adaptive moving averages, ADX-based trend strength analysis, SuperTrend trailing stops, and dynamic support/resistance detection, this indicator delivers a complete trading system in one powerful package.
## 📊 Recommended Usage
Timeframes: Most effective on 1H, 4H, and Daily charts for swing trading; 5M and 15M for day trading
Markets: Works across all markets including Forex, Crypto, Indices, and Stocks
Setup Guidelines: Look for T3 crossovers with strong ADX readings (>25) coinciding with breakout signals (yellow dots/red crosses) near key support/resistance levels for highest probability entries
## 🔥 Key Features:
### T3 Adaptive Trend Detection:
Utilizes premium T3 adaptive indicators instead of standard EMAs for superior smoothing and accuracy
Dynamic color-shifting cloud formation between fast and slow T3 lines reveals immediate trend direction
Proprietary transparency algorithm intensifies cloud colors during strong trends based on real-time ADX readings
### Advanced Support & Resistance Mapping:
Automatically identifies and marks key market structure levels during T3 crossovers
Dynamic horizontal level plotting with optional extension for monitoring future price interactions
Intelligent level validation - converts to dotted lines when price breaks through, maintaining visual clarity
### SuperTrend Trailing Stoploss System:
Professional-grade white trailing stop indicator adapts to market volatility using ATR calculations
Generates precise entry and exit signals with optional buy/sell labels at critical reversal points
Visual trend state highlighting for immediate assessment of current market position
### Breakout Detection & Confirmation:
Sophisticated dual-algorithm breakout system combining Bollinger Bands and Keltner Channels
Visual breakout alerts with yellow dots (bullish) and red crosses (bearish) for instant pattern recognition
Validates breakouts against T3 trend direction to minimize false signals
### Alpha Edge Color System:
Utilizes DaviddTech's signature color scheme with bullish green and bearish pink
Revolutionary transparency algorithm translates ADX readings into precise visual intensity
Higher ADX values produce more vivid colors, instantly communicating trend strength without additional indicators
## 💰 Trading Applications:
Alpha Discovery: Identify emerging trends before the majority of market participants
Precision Entry/Exit: Use SuperTrend signals combined with support/resistance levels for optimal trade execution
Risk Management: Set stops based on the white trailing stoploss line for mathematically-optimized protection
Trend Confirmation: Validate setups using the T3 cloud direction and ADX-based intensity
Breakout Trading: Capture explosive moves with confirmed Bollinger/Keltner breakout signals
Swing Position Management: Monitor extended support/resistance levels for multi-day positioning
## ✨ Strategy Example
As shown in the chart image, ideal entries occur when:
The T3 cloud turns bullish (green) or bearish (pink) with strong color intensity
A yellow dot (bullish) or red cross (bearish) breakout signal appears
Price respects the white SuperTrend line as support/resistance
The trade aligns with key horizontal support/resistance levels identified by the indicator
## 📝 Attribution
This indicator builds upon and enhances concepts from:
Market Trend Levels Detector by BigBeluga (support/resistance detection framework)
T3 indicator implementation by DaviddTech (adaptive moving average system)
Average Directional Index (ADX) methodology for trend strength measurement
Profit Hunter @DaviddTech represents the culmination of advanced technical analysis methodologies in one seamless system.

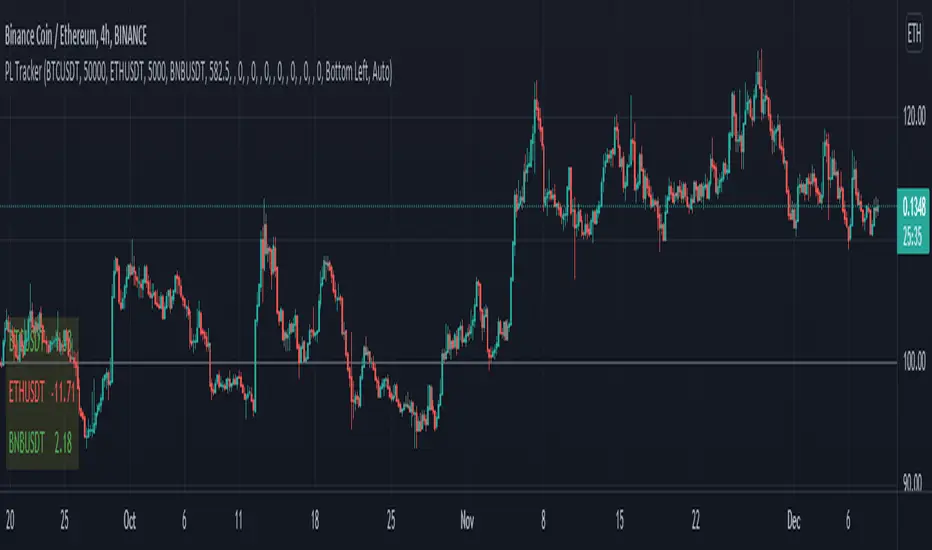
Profit Loss TrackerIt's a simple profit loss tracker for up to 10 symbols. A concise panel displays all your positions, whether if they're in profit or loss, and what percentage.
Text size and box position can be adjustable.
Profit MAX MTF HeatMapThis is a powerfull strategy which is made from combining 3 multi timeframes into one for profit max indicator
In this case we have daily, weekly and montly.
Our long conditions are the next ones :
if we have an uptrend on all 3 at the same time, we go long.
If we have a downtrend on all 3 of them at the same time we go short.
For exit, for long, as soon as one of the 3 converts into downtrend we exit the trade.
For exit, for short, as soon as one of the 3 converts into uptrend we exit the trade.
This tool can be used on all types of markets, and can also be changed the time frames.

Profit Maximizer StrategyFirst I would like to thank to @KivancOzbilgic for developing this indicator.
All the credit goes to him.
I just created a strategy, in order to try to find the perfect parameters, timeframe and currency for it.
I will provide below the same description like he has in the publish of profit maximizer
Profit Maximizer - PMax combines the powerful sides of MOST (Moving Average Trend Changer) and SuperTrend (ATR price detection) in one indicator.
Backtest and optimization results of PMax are far better when compared to its ancestors MOST and SuperTrend. It reduces the number of false signals in sideways and give more reliable trade signals.
PMax is easy to determine the trend and can be used in any type of markets and instruments. It does not repaint.
The first parameter in the PMax indicator set by the three parameters is the period/length of ATR.
The second Parameter is the Multiplier of ATR which would be useful to set the value of distance from the built in Moving Average.
I personally think the most important parameter is the Moving Average Length and type.
PMax will be much sensitive to trend movements if Moving Average Length is smaller. And vice versa, will be less sensitive when it is longer.
As the period increases it will become less sensitive to little trends and price actions.
In this way, your choice of period, will be closely related to which of the sort of trends you are interested in.
We are under the effect of the uptrend in cases where the Moving Average is above PMax;
conversely under the influence of a downward trend, when the Moving Average is below PMax.
Built in Moving Average type defaultly set as EMA but users can choose from 8 different Moving Average types like:
SMA : Simple Moving Average
EMA : Exponential Movin Average
WMA : Weighted Moving Average
TMA : Triangular Moving Average
VAR : Variable Index Dynamic Moving Average aka VIDYA
WWMA : Welles Wilder's Moving Average
ZLEMA : Zero Lag Exponential Moving Average
TSF : True Strength Force
Tip: In sideways VAR would be a good choice
You can use PMax default alarms and Buy Sell signals like:
1-
BUY when Moving Average crosses above PMax
SELL when Moving Average crosses under PMax
2-
BUY when prices jumps over PMax line.
SELL when prices go under PMax line.

Profit Maximizer PMaxPMax is a brand new indicator developed by KivancOzbilgic in earlier 2020.
It's a combination of two trailing stop loss indicators;
One is Anıl Özekşi's MOST (Moving Stop Loss) Indicator
and the other one is well known ATR based SuperTrend.
Both MOST and SuperTrend Indicators are very good at trend following systems but conversely their performance is not bright in sideways market conditions like most of the other indicators.
Profit Maximizer - PMax tries to solve this problem. PMax combines the powerful sides of MOST (Moving Average Trend Changer) and SuperTrend (ATR price detection) in one indicator.
Backtest and optimization results of PMax are far better when compared to its ancestors MOST and SuperTrend. It reduces the number of false signals in sideways and give more reliable trade signals.
PMax is easy to determine the trend and can be used in any type of markets and instruments. It does not repaint.
The first parameter in the PMax indicator set by the three parameters is the period/length of ATR.
The second Parameter is the Multiplier of ATR which would be useful to set the value of distance from the built in Moving Average.
I personally think the most important parameter is the Moving Average Length and type.
PMax will be much sensitive to trend movements if Moving Average Length is smaller. And vice versa, will be less sensitive when it is longer.
As the period increases it will become less sensitive to little trends and price actions.
In this way, your choice of period, will be closely related to which of the sort of trends you are interested in.
We are under the effect of the uptrend in cases where the Moving Average is above PMax;
conversely under the influence of a downward trend, when the Moving Average is below PMax.
Built in Moving Average type defaultly set as EMA but users can choose from 8 different Moving Average types like:
SMA : Simple Moving Average
EMA : Exponential Movin Average
WMA : Weighted Moving Average
TMA : Triangular Moving Average
VAR : Variable Index Dynamic Moving Average aka VIDYA
WWMA : Welles Wilder's Moving Average
ZLEMA : Zero Lag Exponential Moving Average
TSF : True Strength Force
Tip: In sideways VAR would be a good choice
You can use PMax default alarms and Buy Sell signals like:
1-
BUY when Moving Average crosses above PMax
SELL when Moving Average crosses under PMax
2-
BUY when prices jumps over PMax line.
SELL when prices go under PMax line.

Profit and Stoploss CalculatorThis script is designed to display three stop loss areas to assist either with automation of risk management or identify and alert when price is in a range of a trade for risk to reward ratio.
In this version there are three stop losses and 1 PT. Mainly because i will most likely only be using 1 of the SL to pair with the PT.
Stoploss areas are displayed on both sides of the price for long and short calculations along with the two profit factors but the settings in the indicator it self apply to both sides in terms of percentage.


Profit target areaCalculates short-term support and resistance and shows areas where put profit targets. Area calculation is based on retracement levels 38% and 62%
Assuming that price always tests previous resistance and performs 38% or 62% retracement. So if area above or below are 62% or 38% of the movement, current resistance-support is 100-62 or 100-38. Result area is rest part above resistance to fill 100% of movement (same below).
When price breaks the support or the resistance, put profit target into the area.
You should always watch not only current suggested area, but also previous areas because detecting supports and resistances is not always perfect

Gabriel's Relative Unrealized Profit with Dynamic MVRV Histogram
Certainly! Here’s an enhanced description of the Gabriel's Relative Unrealized Profit with Dynamic MVRV Histogram indicator with detailed usage instructions and explanations of why it's effective:
Gabriel's Relative Unrealized Profit with Dynamic MVRV Histogram
Description:
The Gabriel's Relative Unrealized Profit with Dynamic MVRV Histogram is an advanced trading indicator designed to offer in-depth insights into asset profitability and market valuation. By integrating Relative Unrealized Profit (RUP) and the Market Value to Realized Value (MVRV) Ratio, this indicator provides a nuanced view of an asset's performance and potential trading signals.
Key Components:
SMA Length and Volume Indicator:
SMA Length: Defines the period for the Simple Moving Average (SMA) used to calculate the entry price, defaulted to 14 periods. This smoothing technique helps estimate the average historical price at which the asset was acquired.
Volume Indicator: Allows selection between "volume" and "vwap" (Volume-Weighted Average Price) for calculating entry volume. The choice impacts the calculation of entry volume, either based on standard trading volume or a weighted average price.
Realized Price Calculation:
Computes the average price over a specified period (default of 30 periods) to establish the realized price. This serves as a benchmark for evaluating the cost basis of the asset.
MVRV Calculation:
Current Price: The most recent closing price of the asset, representing its market value.
Total Cost: Calculated as the product of the entry price and entry volume, reflecting the total investment made.
Unrealized Profit: The difference between the current price and the entry price, multiplied by entry volume, indicating profit or loss that has yet to be realized.
Relative Unrealized Profit: Expressed as a percentage of the total cost, showing how much profit or loss exists relative to the initial investment.
Market Value and Realized Value: Market Value is the current price multiplied by entry volume, while Realized Value is the realized price multiplied by entry volume. The MVRV Ratio is obtained by dividing Market Value by Realized Value.
Normalization:
Normalizes both Relative Unrealized Profit and MVRV Ratio to a standardized range of -100 to 100. This involves calculating the minimum and maximum values over a 100-period window to ensure comparability and relevance.
Histogram Calculation:
The histogram is derived from the difference between the normalized Relative Unrealized Profit and the normalized MVRV Ratio. It visually represents the disparity between the two metrics, highlighting potential trading signals.
Plotting and Alerts:
Plots:
Normalized Relative Unrealized Profit (Blue Line): Plotted in blue, this line shows the scaled measure of unrealized profit. Positive values indicate potential gains, while negative values suggest potential losses.
Normalized MVRV Ratio (Red Line): Plotted in red, this line represents the scaled MVRV Ratio. Higher values suggest that the asset’s market value significantly exceeds its realized value, indicating potential overvaluation, while lower values suggest potential undervaluation.
Histogram (Green Bars): Plotted in green, this histogram displays the difference between the normalized Relative Unrealized Profit and the normalized MVRV Ratio. Positive bars indicate that the asset’s profitability is exceeding its market valuation, while negative bars suggest the opposite.
Alerts:
High Histogram Alert: Activated when the histogram value exceeds 50. This condition signals a strong positive divergence, indicating that the asset's profitability is outperforming its market valuation. It may suggest a buying opportunity or indicate that the asset is undervalued relative to its potential profitability.
Low Histogram Alert: Triggered when the histogram value falls below -50. This condition signals a strong negative divergence, indicating that the asset's profitability is lagging behind its market valuation. It may suggest a selling opportunity or indicate that the asset is overvalued relative to its profitability.
How to Use the Indicator:
Setup: Customize the SMA Length, Volume Indicator, and Realized Price Length based on your trading strategy and asset volatility. These parameters allow you to tailor the indicator to different market conditions and asset types.
Interpretation:
Blue Line (Normalized Relative Unrealized Profit): Monitor this line to gauge the profitability of holding the asset. Significant positive values suggest that the asset is currently in a profitable position relative to its purchase price.
Red Line (Normalized MVRV Ratio): Use this line to assess whether the asset is trading at a premium or discount relative to its cost basis. Higher values may indicate overvaluation, while lower values suggest undervaluation.
Green Bars (Histogram): Observe the histogram for deviations between RUP and MVRV Ratio. Large positive bars indicate that the asset's profitability is strong relative to its valuation, signaling potential buying opportunities. Large negative bars suggest that the asset's profitability is weak relative to its valuation, signaling potential selling opportunities.
Trading Strategy:
Bullish Conditions: When the histogram shows large positive values, it suggests that the asset’s profitability is strong compared to its valuation. Consider this as a potential buying signal, especially if the histogram remains consistently positive.
Bearish Conditions: When the histogram displays large negative values, it indicates that the asset’s profitability is weak compared to its valuation. This may signal a potential selling opportunity or caution, particularly if the histogram remains consistently negative.
Why This Indicator is Effective:
Integrated Metrics: Combining Relative Unrealized Profit and MVRV Ratio provides a comprehensive view of asset performance. This integration allows traders to evaluate both profitability and market valuation in one cohesive tool.

Crypto Wallets Profitability & Performance [LuxAlgo]The Crypto Wallets Profitability & Performance indicator provides a comprehensive view of the financial status of cryptocurrency wallets by leveraging on-chain data from IntoTheBlock. It measures the percentage of wallets profiting, losing, or breaking even based on current market prices.
Additionally, it offers performance metrics across different timeframes, enabling traders to better assess market conditions.
This information can be crucial for understanding market sentiment and making informed trading decisions.
🔶 USAGE
🔹 Wallets Profitability
This indicator is designed to help traders and analysts evaluate the profitability of cryptocurrency wallets in real-time. It aggregates data gathered from the blockchain on the number of wallets that are in profit, loss, or breaking even and presents it visually on the chart.
Breaking even line demonstrates how realized gains and losses have changed, while the profit and the loss monitor unrealized gains and losses.
The signal line helps traders by providing a smoothed average and highlighting areas relative to profiting and losing levels. This makes it easier to identify and confirm trading momentum, assess strength, and filter out market noise.
🔹 Profitability Meter
The Profitability Meter is an alternative display that visually represents the percentage of wallets that are profiting, losing, or breaking even.
🔹 Performance
The script provides a view of the financial health of cryptocurrency wallets, showing the percentage of wallets in profit, loss, or breaking even. By combining these metrics with performance data across various timeframes, traders can gain valuable insights into overall wallet performance, assess trend strength, and identify potential market reversals.
🔹 Dashboard
The dashboard presents a consolidated view of key statistics. It allows traders to quickly assess the overall financial health of wallets, monitor trend strength, and gauge market conditions.
🔶 DETAILS
🔹 The Chart Occupation Option
The chart occupation option adjusts the occupation percentage of the chart to balance the visibility of the indicator.
🔹 The Height in Performance Options
Crypto markets often experience significant volatility, leading to rapid and substantial gains or losses. Hence, plotting performance graphs on top of the chart alongside other indicators can result in a cluttered display. The height option allows you to adjust the plotting for balanced visibility, ensuring a clearer and more organized chart.
🔶 SETTINGS
The script offers a range of customizable settings to tailor the analysis to your trading needs.
Chart Occupation %: Adjust the occupation percentage of the chart to balance the visibility of the indicator.
🔹 Profiting Wallets
Profiting Percentage: Toggle to display the percentage of wallets in profit.
Smoothing: Adjust the smoothing period for the profiting percentage line.
Signal Line: Choose a signal line type (SMA, EMA, RMA, or None) to overlay on the profiting percentage.
🔹 Losing Wallets
Losing Percentage: Toggle to display the percentage of wallets in loss.
Smoothing: Adjust the smoothing period for the losing percentage line.
Signal Line: Choose a signal line type (SMA, EMA, RMA, or None) to overlay on the losing percentage.
🔹 Breaking Even Wallets
Breaking-Even Percentage: Toggle to display the percentage of wallets breaking even.
Smoothing: Adjust the smoothing period for the breaking-even percentage line.
🔹 Profitability Meter
Profitability Meter: Enable or disable the meter display, set its width, and adjust the offset.
🔹 Performance
Performance Metrics: Choose the timeframe for performance metrics (Day to Date, Week to Date, etc.).
Height: Adjust the height of the chart visuals to balance the visibility of the indicator.
🔹 Dashboard
Block Profitability Stats: Toggle the display of profitability stats.
Performance Stats: Toggle the display of performance stats.
Dashboard Size and Position: Customize the size and position of the performance dashboard on the chart.
🔶 RELATED SCRIPTS
Market-Sentiment-Technicals
Multi-Chart-Widget

Replica of TradingView's Backtesting Engine with ArraysHello everyone,
Here is a perfectly replicated TradingView backtesting engine condensed into a single library function calculated with arrays. It includes TradingView's calculations for Net profit, Total Trades, Percent of Trades Profitable, Profit Factor, Max Drawdown (absolute and percent), and Average Trade (absolute and percent). Here's how TradingView defines each aspect of its backtesting system:
Net Profit: The overall profit or loss achieved.
Total Trades: The total number of closed trades, winning and losing.
Percent Profitable: The percentage of winning trades, the number of winning trades divided by the total number of closed trades.
Profit Factor: The amount of money the strategy made for every unit of money it lost, gross profits divided by gross losses.
Max Drawdown: The greatest loss drawdown, i.e., the greatest possible loss the strategy had compared to its highest profits.
Average Trade: The sum of money gained or lost by the average trade, Net Profit divided by the overall number of closed trades.
Here's how each variable is defined in the library function:
_backtest(bool _enter, bool _exit, float _startQty, float _tradeQty)
bool _enter: When the strategy should enter a trade (entry condition)
bool _exit: When the strategy should exit a trade (exit condition)
float _startQty: The starting capital in the account (for BTCUSD, it is the amount of USD the account starts with)
float _tradeQty: The amount of capital traded (if set to 1000 on BTCUSD, it will trade 1000 USD on each trade)
Currently, this library only works with long strategies, and I've included a commented out section under DEMO STRATEGY where you can replicate my results with TradingView's backtesting engine. There's tons I could do with this beyond what is shown, but this was a project I worked on back in June of 2022 before getting burned out. Feel free to comment with any suggestions or bugs, and I'll try to add or fix them all soon. Here's my list of thing to add to the library currently (may not all be added):
Add commission calculations.
Add support for shorting
Add a graph that resembles TradingView's overview graph.
Clean and optimize code.
Clean up in a way that makes it easy to add other TradingView calculations (such as Sharpe and Sortino ratio).
Separate all variables, so they become accessible outside of calculations (such as gross profit, gross loss, number of winning trades, number of losing trades, etc.).
Thanks for reading,
OztheWoz

Yearly Profit BackgroundDescription:
The Yearly Profit Background indicator is a powerful tool designed to help traders quickly visualize the profitability of each calendar year on their charts. By analyzing the annual performance of an asset, this indicator colors the background of each completed year green if the year was profitable (close > open) or red if it resulted in a loss (close < open). This visual representation allows traders to identify long-term trends and historical performance at a glance.
Key Features:
Annual Profit Calculation: Automatically calculates the yearly performance based on the opening price of January 1st and the closing price of December 31st.
Visual Background Coloring: Highlights each completed year with a green (profit) or red (loss) background, making it easy to spot trends.
Customizable Transparency: The background colors are set at 90% transparency, ensuring they don’t obstruct your chart analysis.
Optional Price Plots: Displays the annual opening (blue line) and closing (orange line) prices for additional context.
How to Use:
Add the indicator to your chart.
Observe the background colors for each completed year:
Green: The year was profitable.
Red: The year resulted in a loss.
Use the optional price plots to analyze annual opening and closing levels.
Ideal For:
Long-term investors analyzing historical performance.
Traders looking to identify multi-year trends.
Anyone interested in visualizing annual market cycles.
Why Use This Indicator?
Understanding the annual performance of an asset is crucial for making informed trading decisions. The Yearly Profit Background indicator simplifies this process by providing a clear, visual representation of yearly profitability, helping you spot patterns and trends that might otherwise go unnoticed.

RSI ProfitGuard [CHE]The RSI ProfitGuard Indicator is a comprehensive tool designed to assist traders in making informed decisions by integrating the Relative Strength Index (RSI) with automated Take Profit (TP) and Stop Loss (SL) levels. This indicator enhances trading strategies by providing clear entry signals and risk management parameters.
Key Features
RSIBased Signals: Utilizes RSI crossovers and crossunders to generate trade signals.
Automated TP and SL: Automatically calculates and plots Take Profit and Stop Loss levels based on userdefined methods.
Customizable Trade Types: Supports Long trades, Short trades, or both simultaneously.
Flexible Calculation Methods: Choose between Percentagebased or ATRbased methods for determining TP and SL levels.
Visual Enhancements: Highlights overbought and oversold RSI regions with background colors and marks trade entries with arrows.
Alerts: Provides realtime alerts when TP or SL levels are reached, ensuring timely trade management.
How It Works
1. RSI Calculation: The indicator calculates the RSI value based on the specified length.
2. Trade Signals:
Long Entry: Triggered when RSI crosses above the defined crossover threshold.
Short Entry: Triggered when RSI crosses below the defined crossunder threshold.
3. TP/SL Level Determination:
Percentage Method: Sets TP and SL as a percentage above and below the entry price.
ATR Method: Sets TP and SL based on the Average True Range (ATR), allowing for dynamic adjustments based on market volatility.
4. Visualization: Draws lines and labels on the chart to indicate TP, SL, and entry points.
5. Trade Management: Monitors price movements to determine if TP or SL levels are hit, automatically managing the trade state.
Customization Options
Trade Type Selection: Choose to execute Long trades, Short trades, or both.
RSI Settings:
RSI Length: Defines the period for RSI calculation (default is 14).
Crossover Threshold: RSI level above which a Long entry is signaled (default is 65).
Crossunder Threshold: RSI level below which a Short entry is signaled (default is 35).
Delay Settings: Sets the minimum number of bars between consecutive trade signals to avoid overtrading.
TP/SL Settings:
Method Selection: Choose between Percentage or ATRbased calculations.
Percentage Values: Define the percentage for TP and SL levels.
ATR Settings: Define ATR length and multipliers for TP and SL when using the ATR method.
Visual Settings:
Line Colors and Styles: Customize the appearance of TP, SL, crossover, and crossunder lines.
Transparency: Adjust the transparency of lines for better chart visibility.
Label Offset: Position labels at a specified number of bars to the right for clarity.
Using the Indicator
1. Add to Chart: Apply the RSI ProfitGuard Indicator to your TradingView chart.
2. Configure Settings: Adjust the parameters according to your trading strategy and risk tolerance.
3. Interpret Signals:
Long Entries: Look for green upward arrows indicating potential buy opportunities.
Short Entries: Look for red downward arrows indicating potential sell opportunities.
4. Monitor TP and SL Levels: Observe the plotted lines and labels to manage your trades effectively.
5. Set Up Alerts: Enable alerts to receive notifications when TP or SL levels are reached, ensuring you can act promptly.
Benefits
Enhanced DecisionMaking: Combines RSI signals with clear risk management levels.
Time Efficiency: Automates the calculation and plotting of TP and SL, saving time and reducing manual errors.
Flexibility: Adapts to various trading styles and market conditions through customizable settings.
Risk Management: Helps in defining and adhering to risk parameters, essential for longterm trading success.
Conclusion
The RSI ProfitGuard Indicator is an invaluable tool for traders seeking to integrate technical analysis with automated risk management. Its customizable features and realtime alerts provide a robust framework for executing and managing trades with confidence.
Disclaimer
The content provided with our RSI ProfitGuard Indicator, including all code, scripts, lessons, and materials, is strictly for educational and informational purposes only. It is not intended as, and should not be interpreted as, financial advice, a recommendation to buy or sell, or an offer of any financial product or service.
Key Points:
Educational Purpose:
All strategies, tools, and examples included within the RSI ProfitGuard Indicator are provided solely for illustrative purposes. They are designed to demonstrate coding techniques and the functionality of Pine Script within a trading context.
No Financial Advice:
The RSI ProfitGuard Indicator does not constitute financial advice. Users should not rely on it as a basis for making investment or trading decisions.
Hypothetical Results:
Any results or performance metrics derived from using the RSI ProfitGuard Indicator are purely hypothetical. Past performance is not indicative of future results, and there is no guarantee of profitability.
Risk Disclosure:
Trading and investing involve significant risks, including the potential loss of principal. The RSI ProfitGuard Indicator is not suitable for all persons, and users should be aware of the inherent risks involved in trading.
Professional Consultation:
Before making any trading decisions, it is strongly recommended to consult with a qualified financial professional to fully understand the risks and ensure that such decisions align with your financial situation and goals.
User Responsibility:
By using the RSI ProfitGuard Indicator, you acknowledge and agree that all trading decisions are made solely at your own discretion and risk. The developers and providers of the RSI ProfitGuard Indicator assume no responsibility or liability for any losses or damages resulting from its use.
Additional Notes:
No Guarantees:
There are no guarantees regarding the accuracy, reliability, or completeness of the RSI ProfitGuard Indicator. Users utilize the tool at their own risk.
No Endorsement:
Any mention of third-party products, services, or strategies within the RSI ProfitGuard Indicator does not constitute an endorsement or recommendation.
Updates and Modifications:
The RSI ProfitGuard Indicator may be updated or modified over time. Users are responsible for staying informed about any changes and understanding how they may impact the use of the tool.
Summary
This disclaimer clearly states that the RSI ProfitGuard Indicator is intended for educational purposes and should not be used as financial advice. It highlights the risks associated with trading, the hypothetical nature of any results, and the importance of consulting with a financial professional. Additionally, it emphasizes that users are solely responsible for their trading decisions and any outcomes that result from using the indicator.
Tips for Implementation:
Visibility:
Ensure that this disclaimer is prominently displayed wherever the RSI ProfitGuard Indicator is offered, such as on your website, within the TradingView description, or in any accompanying documentation.
Clarity:
Use clear and concise language to make sure that all users understand the limitations and responsibilities associated with using the indicator.
Legal Review:
Consider having the disclaimer reviewed by a legal professional to ensure that it meets all necessary legal requirements and adequately protects your interests.
Regular Updates:
Periodically review and update the disclaimer to reflect any changes in the indicator's functionality or in relevant laws and regulations.

Long Term Profitable Swing | AbbasA Story of a Profitable Swing Trading Strategy
Imagine you're sailing across the ocean, looking for the perfect wave to ride. Swing trading is quite similar—you're navigating the stock market, searching for the ideal moments to enter and exit trades. This strategy, created by Abbas, helps you find those waves and ride them effectively to profitable outcomes.
🌊 Finding the Perfect Wave (Entry)
Our journey begins with two simple signs that tell us a great trading opportunity is forming:
- Moving Averages: We use two lines that follow price trends—the faster one (EMA 16) reacts quickly to recent price moves, and the slower one (EMA 30) gives us a longer-term perspective. When the faster line crosses above the slower line, it's like a clear signal saying, "Hey! The wave is rising, and prices might move higher!"
- RSI Momentum: Next, we check a tool called the RSI, which measures momentum (how strongly prices are moving). If the RSI number is above 50, it means there's enough strength behind this rising wave to carry us forward.
When both signals appear together, that's our green light. It's time to jump on our surfboard and start riding this promising wave.
⚓ Safely Riding the Wave (Risk Management)
While we're riding this wave, we want to ensure we're safe from sudden surprises. To do this, we use something called the Average True Range (ATR), which measures how volatile (or bumpy) the price movements are:
- Stop-Loss: To avoid falling too hard, we set a safety line (stop-loss) 8 times the ATR below our entry price. This helps ensure we exit if the wave suddenly turns against us, protecting us from heavy losses.
- Take Profit: We also set a goal to exit the trade at 11 times the ATR above our entry. This way, we capture significant profits when the wave reaches a nice high point.
🌟 Multiple Rides, Bigger Adventures
This strategy allows us to take multiple positions simultaneously—like riding several waves at once, up to 5. Each trade we make uses only 10% of our trading capital, keeping risks manageable and giving us multiple opportunities to win big.
🗺️ Easy to Follow Settings
Here are the basic settings we use:
- Fast EMA**: 16
- Slow EMA**: 30
- RSI Length**: 9
- RSI Threshold**: 50
- ATR Length**: 21
- ATR Stop-Loss Multiplier**: 8
- ATR Take-Profit Multiplier**: 11
These settings are flexible—you can adjust them to better suit different markets or your personal trading style.
🎉 Riding the Waves of Success
This simple yet powerful swing trading approach helps you confidently enter trades, clearly know when to exit, and effectively manage your risk. It’s a reliable way to ride market waves, capture profits, and minimize losses.
Happy trading, and may you find many profitable waves to ride! 🌊✨
Please test, and take into account that it depends on taking multiple longs within the swing, and you only get to invest 25/30% of your equity.
