ATR Stop-Loss with Fibonacci Take-Profit [jpkxyz]ATR Stop-Loss with Fibonacci Take-Profit Indicator
This comprehensive indicator combines Average True Range (ATR) volatility analysis with Fibonacci extensions to create dynamic stop-loss and take-profit levels. It's designed to help traders set precise risk management levels and profit targets based on market volatility and mathematical ratios.
Two Operating Modes
Default Mode (Rolling Levels)
In default mode, the indicator continuously plots evolving stop-loss and take-profit levels based on real-time price action. These levels update dynamically as new bars form, creating rolling horizontal lines across the chart. I use this mode primarily to plot the rolling ATR-Level which I use to trail my Stop-Loss into profit.
Characteristics:
Levels recalculate with each new bar
All selected Fibonacci levels display simultaneously
Uses plot() functions with trackprice=true for price tracking
Custom Anchor Mode (Fixed Levels)
This is the primary mode for precision trading. You select a specific timestamp (typically your entry bar), and the indicator locks all calculations to that exact moment, creating fixed horizontal lines that represent your actual trade levels.
Characteristics:
Entry line (blue) marks your anchor point
Stop-loss calculated using ATR from the anchor bar
Fibonacci levels projected from entry-to-stop distance
Lines terminate when price breaks through them
Includes comprehensive alert system
Core Calculation Logic
ATR Stop-Loss Calculation:
Stop Loss = Entry Price ± (ATR × Multiplier)
Long positions: SL = Entry - (ATR × Multiplier)
Short positions: SL = Entry + (ATR × Multiplier)
ATR uses your chosen smoothing method (RMA, SMA, EMA, or WMA)
Default multiplier is 1.5, adjustable to your risk tolerance
Fibonacci Take-Profit Projection:
The distance from entry to stop-loss becomes the base unit (1.0) for Fibonacci extensions:
TP Level = Entry + (Entry-to-SL Distance × Fibonacci Ratio)
Available Fibonacci Levels:
Conservative: 0.618, 1.0, 1.618
Extended: 2.618, 3.618, 4.618
Complete range: 0.0 to 4.764 (23 levels total)
Multi-Timeframe Functionality
One of the indicator's most powerful features is timeframe flexibility. You can analyze on one timeframe while using stop-loss and take-profit calculations from another.
Best Practices:
Identify your entry point on execution timeframe
Enable "Custom Anchor" mode
Set anchor timestamp to your entry bar
Select appropriate analysis timeframe
Choose relevant Fibonacci levels
Enable alerts for automated notifications
Example Scenario:
Analyse trend on 4-hour chart
Execute entry on 5-minute chart for precision
Set custom anchor to your 5-minute entry bar
Configure timeframe setting to "4h" for swing-level targets
Select appropriate Fibonacci Extension levels
Result: Precise entry with larger timeframe risk management
Visual Intelligence System
Line Behaviour in Custom Anchor Mode:
Active levels: Lines extend to the right edge
Hit levels: Lines terminate at the breaking bar
Entry line: Always visible in blue
Stop-loss: Red line, terminates when hit
Take-profits: Green lines (1.618 level in gold for emphasis)
Customisation Options:
Line width (1-4 pixels)
Show/hide individual Fibonacci levels
ATR length and smoothing method
ATR multiplier for stop-loss distance
Cerca negli script per "profit"

SMA Strategy Builder: Create & Prove Profitability📄 Pine Script Strategy Description (For Publishing on TradingView)
🎯 Strategy Title:
SMA Strategy Builder: Create & Prove Profitability
✨ Description:
This tool is designed for traders who want to build, customize, and prove their own SMA-based trading strategies. The strategy tracks capital growth in real-time, providing clear evidence of profitability after each trade. Users can adjust key parameters such as SMA period, take profit levels, and initial capital, making it a flexible solution for backtesting and strategy validation.
🔍 Key Features:
✅ SMA-Based Logic:
Core trading logic revolves around the Simple Moving Average (SMA).
SMA period is fully adjustable to suit various trading styles.
🎯 Customizable Take Profit (TP):
User-defined TP percentages per position.
TP line displayed as a Step Line with Breaks for clear segmentation.
Visual 🎯TP label for quick identification of profit targets.
💵 Capital Tracking (Proof of Profitability):
Initial capital is user-defined.
Capital balance updates after each closed trade.
Shows both absolute profit/loss and percentage changes for every position.
Darker green profit labels for better readability and dark red for losses.
📈 Capital Curve (Performance Visualization):
Capital growth curve available (hidden by default, can be enabled via settings).
📏 Dynamic Label Positioning:
Label positions adjust dynamically based on the price range.
Ensures consistent visibility across low and high-priced assets.
⚡ How It Works:
Long Entry:
Triggered when the price crosses above the SMA.
TP level is calculated as a user-defined percentage above the entry price.
Short Entry:
Triggered when the price crosses below the SMA.
TP level is calculated as a user-defined percentage below the entry price.
TP Execution:
Positions close immediately once the TP level is reached (no candle close confirmation needed).
🔔 Alerts:
🟩 Long Signal Alert: When the price crosses above the SMA.
🟥 Short Signal Alert: When the price crosses below the SMA.
🎯 TP Alert: When the TP target is reached.
⚙️ Customization Options:
📅 SMA Period: Choose the moving average period that best fits your strategy.
🎯 Take Profit (%): Adjust TP percentages for flexible risk management.
💵 Initial Capital: Set the starting capital for realistic backtesting.
📈 Capital Curve Toggle: Enable or disable the capital curve to track overall performance.
🌟 Why Use This Tool?
🔧 Flexible Strategy Creation: Adjust core parameters and create tailored SMA-based strategies.
📈 Performance Proof: Capital tracking acts as real proof of profitability after each trade.
🎯 Immediate TP Execution: No waiting for candle closures; profits lock in as soon as targets are hit.
💹 Comprehensive Performance Insights: Percentage-based and absolute capital tracking with dynamic visualization.
🏦 Clean Visual Indicators: Strategy insights made clear with dynamic labeling and adjustable visuals.
⚠️ Disclaimer:
This script is provided for educational and informational purposes only. Trading financial instruments carries risk, and past performance does not guarantee future results. Always perform your own due diligence before making any trading decisions.

High-Low Breakout Strategy with ATR traling Stop LossThis script is a TradingView Pine Script strategy that implements a High-Low Breakout Strategy with ATR Trailing Stop.created by SK WEALTH GURU, Here’s a breakdown of its key components:
Features and Functionality
Custom Timeframe and High-Low Detection
Allows users to select a custom timeframe (default: 30 minutes) to detect high and low levels.
Tracks the high and low within a user-specified period (e.g., first 30 minutes of the session).
Draws horizontal lines for high and low, persisting for a specified number of days.
Trade Entry Conditions
Long Entry: If the closing price crosses above the recorded high.
Short Entry: If the closing price crosses below the recorded low.
The user can choose to trade Long, Short, or Both.
ATR-Based Trailing Stop & Risk Management
Uses Average True Range (ATR) with a multiplier (default: 3.5) to determine a dynamic trailing stop-loss.
Trades reset daily, ensuring a fresh start each day.
Trade Execution and Partial Profit Taking
Stop-loss: Default at 1% of entry price.
Partial profit: Books 50% of the position at 3% profit.
Max 2 trades per day: If the first trade hits stop-loss, the strategy allows one re-entry.
Intraday Exit Condition
All positions close at 3:15 PM to ensure no overnight risk.

HMA Buy Sell Signals - Profit ManagerNote : Settings should be adjusted according to the selected time frame. Try to find the best setting according to the profitability rate
Overall Functionality
This script combines several trading tools to create a comprehensive system for trend analysis, trade execution, and performance tracking. Users can identify market trends using specific moving averages and RSI indicators while managing profit and loss levels automatically.
Trend Detection and Trade Signals
Hull Moving Averages (HMA):
Two HMAs (a faster one and a slower one) are used to determine the market trend.
A buy signal is generated when the faster HMA crosses above the slower HMA.
Conversely, a sell signal is triggered when the faster HMA crosses below the slower one.
Visual Feedback:
Trend lines on the chart change color to reflect the trend direction (e.g., green for upward trends and red for downward trends).
Trade Levels and Management
Entry, Take-Profit, and Stop-Loss Levels:
When the trend shifts upwards, the script calculates entry, take-profit, and stop-loss levels based on the opening price.
Similarly, for downward trends, these levels are determined for short trades.
Commission Tracking:
Each trade includes a commission cost, which is factored into net profit and loss calculations.
Dynamic Labels:
Entry, take-profit, and stop-loss levels are visually marked on the chart for easier tracking.
Performance Tracking
Profit and Loss Tracking:
The script keeps a running total of profits, losses, and commissions for both long and short trades.
It also calculates the net profit after all costs are considered.
Performance Table:
A table is displayed on the chart summarizing:
The number of trades.
Total profit and loss for long and short positions.
Commission costs.
Net profit.
Fractal Support and Resistance
Dynamic Lines:
The script identifies the most recent significant highs and lows using fractals.
It draws support and resistance lines that automatically update as new fractals form.
Simplified Visuals:
The chart always shows the last two support and resistance lines, keeping the visualization clean and focused.
RSI-Based Signals
Overbought and Oversold Levels:
RSI is used to identify overbought (above 80) and oversold (below 20) conditions.
The script generates buy signals at oversold levels and sell signals at overbought levels.
Chart Indicators:
Arrows and labels appear on the chart to highlight these RSI-based opportunities.
Customization
The script allows users to customize key parameters such as:
Moving average lengths for trend detection.
Take-profit and stop-loss percentages.
Timeframes for backtesting.
Starting capital and commission rates.
Conclusion
This script is a versatile tool for traders, combining trend detection, automated trade management, and visual feedback. It simplifies decision-making by providing clear signals and tracking performance metrics, making it suitable for both beginners and experienced traders.
* The most recently drawn fractals represent potential support and resistance levels. If the price aligns with these levels at the time of entering a trade, it may indicate a likelihood of reversal. In such cases, it’s advisable to either avoid entering the trade altogether or proceed with increased caution.

SMB MagicSMB Magic
Overview: SMB Magic is a powerful technical strategy designed to capture breakout opportunities based on price movements, volume spikes, and trend-following logic. This strategy works exclusively on the XAU/USD symbol and is optimized for the 15-minute time frame. By incorporating multiple factors, this strategy identifies high-probability trades with a focus on risk management.
Key Features:
Breakout Confirmation:
This strategy looks for price breakouts above the previous high or below the previous low, with a significant volume increase. A breakout is considered valid when it is supported by strong volume, confirming the strength of the price move.
Price Movement Filter:
The strategy ensures that only significant price movements are considered for trades, helping to avoid low-volatility noise. This filter targets larger price swings to maximize potential profits.
Exponential Moving Average (EMA):
A long-term trend filter is applied to ensure that buy trades occur only when the price is above the moving average, and sell trades only when the price is below it.
Fibonacci Levels:
Custom Fibonacci retracement levels are drawn based on recent price action. These levels act as dynamic support and resistance zones and help determine the exit points for trades.
Take Profit/Stop Loss:
The strategy incorporates predefined take profit and stop loss levels, designed to manage risk effectively. These levels are automatically applied to trades and are adjusted based on the market's volatility.
Volume Confirmation:
A volume multiplier confirms the strength of the breakout. A trade is only considered when the volume exceeds a certain threshold, ensuring that the breakout is supported by sufficient market participation.
How It Works:
Entry Signals:
Buy Signal: A breakout above the previous high, accompanied by significant volume and price movement, occurs when the price is above the trend-following filter (e.g., EMA).
Sell Signal: A breakout below the previous low, accompanied by significant volume and price movement, occurs when the price is below the trend-following filter.
Exit Strategy:
Each position (long or short) has predefined take-profit and stop-loss levels, which are designed to protect capital and lock in profits at key points in the market.
Fibonacci Levels:
Fibonacci levels are drawn to identify potential areas of support or resistance, which can be used to guide exits and stop-loss placements.
Important Notes:
Timeframe Restriction: This strategy is designed specifically for the 15-minute time frame.
Symbol Restriction: The strategy works exclusively on the XAU/USD (Gold) symbol and is not recommended for use with other instruments.
Best Performance in Trending Markets: It works best in trending conditions where breakouts occur frequently.
Disclaimer:
Risk Warning: Trading involves risk, and past performance is not indicative of future results. Always conduct your own research and make informed decisions before trading.

Post-Open Long Strategy with ATR-based Stop Loss and Take ProfitThe "Post-Open Long Strategy with ATR-Based Stop Loss and Take Profit" is designed to identify buying opportunities after the German and US markets open. It combines various technical indicators to filter entry signals, focusing on breakout moments following price lateralization periods.
Key Components and Their Interaction:
Bollinger Bands (BB):
Description: Uses BB with a 14-period length and standard deviation multiplier of 1.5, creating narrower bands for lower timeframes.
Role in the Strategy: Identifies low volatility phases (lateralization). The lateralization condition is met when the price is near the simple moving average of the BB, suggesting an imminent increase in volatility.
Exponential Moving Averages (EMA):
10-period EMA: Quickly detects short-term trend direction.
200-period EMA: Filters long-term trends, ensuring entries occur in a bullish market.
Interaction: Positions are entered only if the price is above both EMAs, indicating a consolidated positive trend.
Relative Strength Index (RSI):
Description: 7-period RSI with a threshold above 30.
Role in the Strategy: Confirms the market is not oversold, supporting the validity of the buy signal.
Average Directional Index (ADX):
Description: 7-period ADX with 7-period smoothing and a threshold above 10.
Role in the Strategy: Assesses trend strength. An ADX above 10 indicates sufficient momentum to justify entry.
Average True Range (ATR) for Dynamic Stop Loss and Take Profit:
Description: 14-period ATR with multipliers of 2.0 for Stop Loss and 4.0 for Take Profit.
Role in the Strategy: Adjusts exit levels based on current volatility, enhancing risk management.
Resistance Identification and Breakout:
Description: Analyzes the highs of the last 20 candles to identify resistance levels with at least two touches.
Role in the Strategy: A breakout above this level signals a potential continuation of the bullish trend.
Time Filters and Market Conditions:
Trading Hours: Operates only during the opening of the German market (8:00 - 12:00) and US market (15:30 - 19:00).
Panic Candle: The current candle must close negative, leveraging potential emotional reactions in the market.
Avoiding Entry During Pullbacks:
Description: Checks that the two previous candles are not both bearish.
Role in the Strategy: Avoids entering during a potential pullback, improving trade success probability.
Post-Open Long Strategy with ATR-Based Stop Loss and Take Profit
The "Post-Open Long Strategy with ATR-Based Stop Loss and Take Profit" is designed to identify buying opportunities after the German and US markets open. It combines various technical indicators to filter entry signals, focusing on breakout moments following price lateralization periods.
Key Components and Their Interaction:
Bollinger Bands (BB):
Description: Uses BB with a 14-period length and standard deviation multiplier of 1.5, creating narrower bands for lower timeframes.
Role in the Strategy: Identifies low volatility phases (lateralization). The lateralization condition is met when the price is near the simple moving average of the BB, suggesting an imminent increase in volatility.
Exponential Moving Averages (EMA):
10-period EMA: Quickly detects short-term trend direction.
200-period EMA: Filters long-term trends, ensuring entries occur in a bullish market.
Interaction: Positions are entered only if the price is above both EMAs, indicating a consolidated positive trend.
Relative Strength Index (RSI):
Description: 7-period RSI with a threshold above 30.
Role in the Strategy: Confirms the market is not oversold, supporting the validity of the buy signal.
Average Directional Index (ADX):
Description: 7-period ADX with 7-period smoothing and a threshold above 10.
Role in the Strategy: Assesses trend strength. An ADX above 10 indicates sufficient momentum to justify entry.
Average True Range (ATR) for Dynamic Stop Loss and Take Profit:
Description: 14-period ATR with multipliers of 2.0 for Stop Loss and 4.0 for Take Profit.
Role in the Strategy: Adjusts exit levels based on current volatility, enhancing risk management.
Resistance Identification and Breakout:
Description: Analyzes the highs of the last 20 candles to identify resistance levels with at least two touches.
Role in the Strategy: A breakout above this level signals a potential continuation of the bullish trend.
Time Filters and Market Conditions:
Trading Hours: Operates only during the opening of the German market (8:00 - 12:00) and US market (15:30 - 19:00).
Panic Candle: The current candle must close negative, leveraging potential emotional reactions in the market.
Avoiding Entry During Pullbacks:
Description: Checks that the two previous candles are not both bearish.
Role in the Strategy: Avoids entering during a potential pullback, improving trade success probability.
Entry and Exit Conditions:
Long Entry:
The price breaks above the identified resistance.
The market is in a lateralization phase with low volatility.
The price is above the 10 and 200-period EMAs.
RSI is above 30, and ADX is above 10.
No short-term downtrend is detected.
The last two candles are not both bearish.
The current candle is a "panic candle" (negative close).
Order Execution: The order is executed at the close of the candle that meets all conditions.
Exit from Position:
Dynamic Stop Loss: Set at 2 times the ATR below the entry price.
Dynamic Take Profit: Set at 4 times the ATR above the entry price.
The position is automatically closed upon reaching the Stop Loss or Take Profit.
How to Use the Strategy:
Application on Volatile Instruments:
Ideal for financial instruments that show significant volatility during the target market opening hours, such as indices or major forex pairs.
Recommended Timeframes:
Intraday timeframes, such as 5 or 15 minutes, to capture significant post-open moves.
Parameter Customization:
The default parameters are optimized but can be adjusted based on individual preferences and the instrument analyzed.
Backtesting and Optimization:
Backtesting is recommended to evaluate performance and make adjustments if necessary.
Risk Management:
Ensure position sizing respects risk management rules, avoiding risking more than 1-2% of capital per trade.
Originality and Benefits of the Strategy:
Unique Combination of Indicators: Integrates various technical metrics to filter signals, reducing false positives.
Volatility Adaptability: The use of ATR for Stop Loss and Take Profit allows the strategy to adapt to real-time market conditions.
Focus on Post-Lateralization Breakout: Aims to capitalize on significant moves following consolidation periods, often associated with strong directional trends.
Important Notes:
Commissions and Slippage: Include commissions and slippage in settings for more realistic simulations.
Capital Size: Use a realistic trading capital for the average user.
Number of Trades: Ensure backtesting covers a sufficient number of trades to validate the strategy (ideally more than 100 trades).
Warning: Past results do not guarantee future performance. The strategy should be used as part of a comprehensive trading approach.
With this strategy, traders can identify and exploit specific market opportunities supported by a robust set of technical indicators and filters, potentially enhancing their trading decisions during key times of the day.

SUPPORT RESISTANCE STRATEGY [5MIN TF]A SUPPORT RESISTANCE BREAKOUT STRATEGY for 5 minute Time-Frame , that has the time condition for Indian Markets
The Timing can be changed to fit other markets, scroll down to "TIME CONDITION" to know more.
The commission is also included in the strategy .
The basic idea is when ,
1) Price crosses above Resistance Level ,indicated by Red Line, is a Long condition.
2) Price crosses below Support Level ,indicated by Green Line , is a Short condition.
3) Candle high crosses above ema1, is a part of the Long condition .
4) Candle low crosses below ema1, is a part of the Short condition .
5) Volume Threshold is an added confirmation for long/short positions.
6) Maximum Risk per trade for the intraday trade can be changed .
7) Default qty size is set to 50 contracts , which can be changed under settings → properties → order size.
8) ATR is used for trailing after entry, as mentioned in the inputs below.
// ═════════════════════════//
// ————————> INPUTS <————————— //
// ═════════════════════════//
→ L_Bars ———————————> Length of Resistance / Support Levels.
→ R_Bars ———————————> Length of Resistance / Support Levels.
→ Volume Break ———————> Volume Breakout from range to confirm Long/Short position.
→ Price Cross Ema —————> Added condition as explained above (3) and (4).
→ ATR LONG —————————> ATR stoploss trail for Long positions.
→ ATR SHORT ————————> ATR stoploss trail for Short positions.
→ RISK ————————————> Maximum Risk per trade intraday.
The strategy was back-tested on TCS ,the input values and the results are mentioned under "BACKTEST RESULTS" below.
// ═════════════════════════ //
// ————————> PROPERTIES<——————— //
// ═════════════════════════ //
Default_qty_size ————> 50 contracts , which can be changed under
Settings
↓
Properties
↓
Order size
// ═══════════════════════════════//
// ————————> TIME CONDITION <————————— //
// ═══════════════════════════════//
The time can be changed in the script , Add it → click on ' { } ' → Pine editor→ making it a copy [right top corner} → Edit the line 27.
The Indian Markets open at 9:15am and closes at 3:30pm.
The 'time_cond' specifies the time at which Entries should happen .
"Close All" function closes all the trades at 3pm , at the open of the next candle.
To change the time to close all trades , Go to Pine Editor → Edit the line 92 .
All open trades get closed at 3pm , because some brokers don't allow you to place fresh intraday orders after 3pm .
// ═══════════════════════════════════════════════ //
// ————————> BACKTEST RESULTS ( 100 CLOSED TRADES )<————————— //
// ═══════════════════════════════════════════════ //
INPUTS can be changed for better Back-Test results.
The strategy applied to NSE:TCS ( 5 min Time-Frame and contract size 50) gives us 60% profitability , as shown below
It was tested for a period a 6 months with a Profit Factor of 1.8 ,net Profit of 30,000 Rs profit .
Sharpe Ratio : 0.49
Sortino Ratio : 1.4
The graph has a Linear Curve with Consistent Profits.
The INPUTS are as follows,
1) L_Bars —————————> 4
2) R_Bars —————————> 4
3) Volume Break ————> 5
4) Price Cross Ema ——> 100
5) ATR LONG ——————> 2.4
6) ATR SHORT —————> 2.6
7) RISK —————————> 2000
8) Default qty size ——> 50
NSE:TCS
Save it to favorites.
Apply it to your charts Now !!
Thank You ☺ NSE:TCS

Multi-Filter Profit MaximizerDescription : This script is a trend-following system designed to maximize profits by capturing extended trends while filtering out market noise. It integrates four core components:
SuperTrend (Customized): Acts as a dynamic trailing stop and trend baseline.
ADX Filter: Ensures signals only occur during active volatility to avoid choppy markets.
CVD (Cumulative Volume Delta): Validates the price movement with actual volume flow.
Stochastic Momentum: Pinpoints high-probability entry entries within the trend.
--------------------------------------------------------------------------------------------------------------
How to Use This Indicator (Profit Maximization Manual)
This indicator is designed to prioritize **“win rate” and “price range”** over the number of entries.
Market Environment Recognition (Background & Lines):
Green background & green line: An uptrend. Focus solely on long positions.
Red background & red line: A downtrend. Focus solely on short positions.
EMA 200 (Orange Line): The iron rule is to go long if the candlestick is above this line, and short if it's below.
Entry (BUY / SELL Signals):
Enter when the BUY or SELL label appears.
This is the moment when the “trend direction,” “momentum via ADX,” “fund flow via CVD,” and “timing via Stochastic” all align perfectly.
Profit Maximization Exit (Most Critical):
Stop Loss (SL): Exit immediately if the candle body breaks below the green (or red) SuperTrend line right after entry. No hesitation.
Take Profit (TP):
Method A (Trend Riding): Hold until the SuperTrend line changes color. If a major trend emerges, this can yield tremendous profits.
Method B (Conservative Approach): Take half the profit at roughly a 1:2 risk-reward ratio, then hold the remainder aligned with the SuperTrend.
Why This is “The Best”
Many indicators get whipped back and forth in range-bound markets, spitting out profits. It's coded to generate absolutely no signals when ADX < 20 (weak market). Furthermore, using SuperTrend as the stop-loss line forces a structure that comes closest to the Holy Grail of trading: **“Small losses, unlimited profits as long as the trend continues.”**

Take Profit CalculatorRelease Notes: Take Profit Calculator v1.0
Introduction
Introducing the Real-Time Take Profit Calculator, a dynamic tool for TradingView designed to instantly calculate and display your target exit price. This indicator eliminates the need for manual calculations, allowing scalpers and day traders to see their profit targets directly on the chart as the market moves.
Key Features
Dynamic Target Calculation: The take-profit line is not static. It recalculates on every tick, moving with the current price to show you the exact target based on a real-time entry point.
Full Trade Customization:
Margin: Set the amount of capital (in USDT) you are allocating to the trade.
Leverage: Input your desired leverage to accurately calculate the total position size.
Desired Profit: Specify your target profit in USDT, and the indicator will calculate the corresponding price level.
Long & Short Support: Easily switch between "Long" and "Short" trade directions. The indicator will adjust the calculation and the visual style accordingly.
Customizable Display:
Change the color and width of the take-profit line for both long and short scenarios.
Toggle a price label on or off for a cleaner chart view.
How to Use
Add to Chart: Apply the "Take Profit Calculator" indicator to your chart.
Open Settings: Double-click the indicator name or the line itself to open the settings panel.
Enter Your Parameters: Under "Trade Parameters," fill in your Margin, Leverage, and Desired Profit.
Select Direction: Choose either "Long" or "Short" from the Trade Direction dropdown.
Analyze: The horizontal line on your chart now represents the exact price you need to reach
Marcel's Dynamic Profit / Loss Calculator for GoldOverview
This Dynamic Risk / Reward Tool for Gold is designed to help traders efficiently plan and manage their trades in the volatile gold market. This script provides a clear visualisation of trade levels (Entry, Stop Loss, Take Profit) while dynamically calculating potential profit and loss. It ensures gold traders can assess their positions with precision, saving time and improving risk management.
Key Features
1. Trade Level Visualisation:
Plots Entry (Blue), Stop Loss (Red), and Take Profit (Green) lines directly on the chart.
Helps you visualise and confirm trade setups quickly which is good for scalping and day trades.
2. Dynamic Risk and Reward Calculations:
Calculates potential profit and loss in real time based on user-defined inputs such as position size, leverage, and account equity.
Displays a summary panel showing risk/reward metrics directly on the chart.
3. Customisable Settings:
Allows you to adjust key parameters like account equity, position size, leverage, and specific price levels for Entry, Stop Loss, and Take Profit.
Defaults are dynamically generated for convenience but remain fully adjustable for flexibility.
How It Works
The script uses gold-specific conventions (e.g., 1 lot = 100 ounces, 1 pip = 0.01 price change) to calculate accurate risk and reward metrics.
It dynamically positions Stop Loss and Take Profit levels relative to the entry price, based on user-defined or default offsets.
A real-time summary panel is displayed in the bottom-right corner of the chart, showing:
Potential Profit: The monetary value if the Take Profit is hit.
Potential Lo
ss: The monetary value if the Stop Loss is hit.
How to Use It
1. Add the script to your chart on a gold trading pair (e.g., XAUUSD).
2. Input your:
Account equity.
Leverage.
Position size (in lots).
Desired En
try Price (default: current close price).
3. Adjust the Stop Loss and Take Profit levels to your strategy, or let the script use default offsets of:
500 pips below the Entry for Stop Loss.
1000 pips above the Entry for Take Profit.
4. Review the plotted levels and the summary panel to confirm your trade aligns with your risk/reward goals.
Why Use This Tool?
Clarity and Precision:
Provides clear trade visuals and financial metrics for confident decision-making.
Time-Saving:
Automates the calculations needed to evaluate trade risk and reward.
Improved Risk Management:
Ensures you never trade without knowing your exact potential loss and gain.
This script is particularly useful for both novice and experienced traders looking to enhance their risk management and trading discipline in the Gold market. Enjoy clearer trades at speed.

VIDYA ProTrend Multi-Tier ProfitHello! This time is about a trend-following system.
VIDYA is quite an interesting indicator that adjusts dynamically to market volatility, making it more responsive to price changes compared to traditional moving averages. Balancing adaptability and precision, especially with the more aggressive short trade settings, challenged me to fine-tune the strategy for a variety of market conditions.
█ Introduction and How it is Different
The "VIDYA ProTrend Multi-Tier Profit" strategy is a trend-following system that combines the VIDYA (Variable Index Dynamic Average) indicator with Bollinger Bands and a multi-step take-profit mechanism.
Unlike traditional trend strategies, this system allows for more adaptive profit-taking, adjusting for long and short positions through distinct ATR-based and percentage-based targets. The innovation lies in its dynamic multi-tier approach to profit-taking, especially for short trades, where more aggressive percentages are applied using a multiplier. This flexibility helps adapt to various market conditions by optimizing trade management and profit allocation based on market volatility and trend strength.
BTCUSD 6hr performance
█ Strategy, How it Works: Detailed Explanation
The core of the "VIDYA ProTrend Multi-Tier Profit" strategy lies in the dual VIDYA indicators (fast and slow) that analyze price trends while accounting for market volatility. These indicators work alongside Bollinger Bands to filter trade entries and exits.
🔶 VIDYA Calculation
The VIDYA indicator is calculated using the following formula:
Smoothing factor (𝛼):
alpha = 2 / (Length + 1)
VIDYA formula:
VIDYA(t) = alpha * k * Price(t) + (1 - alpha * k) * VIDYA(t-1)
Where:
k = |Chande Momentum Oscillator (MO)| / 100
🔶 Bollinger Bands as a Volatility Filter
Bollinger Bands are calculated using a rolling mean and standard deviation of price over a specified period:
Upper Band:
BB_upper = MA + (K * stddev)
Lower Band:
BB_lower = MA - (K * stddev)
Where:
MA is the moving average,
K is the multiplier (typically 2), and
stddev is the standard deviation of price over the Bollinger Bands length.
These bands serve as volatility filters to identify potential overbought or oversold conditions, aiding in the entry and exit logic.
🔶 Slope Calculation for VIDYA
The slopes of both fast and slow VIDYAs are computed to assess the momentum and direction of the trend. The slope for a given VIDYA over its length is:
Slope = (VIDYA(t) - VIDYA(t-n)) / n
Where:
n is the length of the lookback period. Positive slope indicates bullish momentum, while negative slope signals bearish momentum.
LOCAL picture
🔶 Entry and Exit Conditions
- Long Entry: Occurs when the price moves above the slow VIDYA and the fast VIDYA is trending upward. Bollinger Bands confirm the signal when the price crosses the upper band, indicating bullish strength.
- Short Entry: Happens when the price drops below the slow VIDYA and the fast VIDYA trends downward. The signal is confirmed when the price crosses the lower Bollinger Band, showing bearish momentum.
- Exit: Based on VIDYA slopes flattening or reversing, or when the price hits specific ATR or percentage-based profit targets.
🔶 Multi-Step Take Profit Mechanism
The strategy incorporates three levels of take profit for both long and short trades:
- ATR-based Take Profit: Each step applies a multiple of the ATR (Average True Range) to the entry price to define the exit point.
The first level of take profit (long):
TP_ATR1_long = Entry Price + (2.618 * ATR)
etc.
█ Trade Direction
The strategy offers flexibility in defining the trading direction:
- Long: Only long trades are considered based on the criteria for upward trends.
- Short: Only short trades are initiated in bearish trends.
- Both: The strategy can take both long and short trades depending on the market conditions.
█ Usage
To use the strategy effectively:
- Adjust the VIDYA lengths (fast and slow) based on your preference for trend sensitivity.
- Use Bollinger Bands as a filter for identifying potential breakout or reversal scenarios.
- Enable the multi-step take profit feature to manage positions dynamically, allowing for partial exits as the price reaches specified ATR or percentage levels.
- Leverage the short trade multiplier for more aggressive take profit levels in bearish markets.
This strategy can be applied to different asset classes, including equities, forex, and cryptocurrencies. Adjust the input parameters to suit the volatility and characteristics of the asset being traded.
█ Default Settings
The default settings for this strategy have been designed for moderate to trending markets:
- Fast VIDYA Length (10): A shorter length for quick responsiveness to price changes. Increasing this length will reduce noise but may delay signals.
- Slow VIDYA Length (30): The slow VIDYA is set longer to capture broader market trends. Shortening this value will make the system more reactive to smaller price swings.
- Minimum Slope Threshold (0.05): This threshold helps filter out weak trends. Lowering the threshold will result in more trades, while raising it will restrict trades to stronger trends.
Multi-Step Take Profit Settings
- ATR Multipliers (2.618, 5.0, 10.0): These values define how far the price should move before taking profit. Larger multipliers widen the profit-taking levels, aiming for larger trend moves. In higher volatility markets, these values might be adjusted downwards.
- Percentage Levels (3%, 8%, 17%): These percentage levels define how much the price must move before taking profit. Increasing the percentages will capture larger moves, while smaller percentages offer quicker exits.
- Short TP Multiplier (1.5): This multiplier applies more aggressive take profit levels for short trades. Adjust this value based on the aggressiveness of your short trade management.
Each of these settings directly impacts the performance and risk profile of the strategy. Shorter VIDYA lengths and lower slope thresholds will generate more trades but may result in more whipsaws. Higher ATR multipliers or percentage levels can delay profit-taking, aiming for larger trends but risking partial gains if the trend reverses too early.

Trailing Take Profit - Close Based📝 Description
This script demonstrates a new approach to the trailing take profit.
Trailing Take Profit is a price-following technique. When used, instead of setting a limit order for the take profit target exiting from your position at the specified price, a stop order is conditionally set when the take profit target is reached. Then, the stop price (a.k.a trailing price), is placed below the take profit target at a distance defined by the user percentagewise. On regular time intervals, the stop price gets updated by following the "Trail Barrier" price (high by default) upwards. When the current price hits the stop price you exit the trade. Check the chart for more details.
This script demonstrates how to implement the close-based Trailing Take Profit logic for long positions, but it can also be applied for short positions if the logic is "reversed".
📢 NOTE
To generate some entries and showcase the "Trailing Take Profit" technique, this script uses the crossing of two moving averages. Please keep in mind that you should not relate the Backtesting results you see in the "Strategy Tester" tab with the success of the technique itself.
This is not a complete strategy per se, and the backtest results are affected by many parameters that are outside of the scope of this publication. If you choose to use this new approach of the "Trailing Take Profit" in your logic you have to make sure that you are backtesting the whole strategy.
⚔️ Comparison
In contrast to my older "Trailing Take Profit" publication where the trailing take profit implementation was tick-based, this new approach is close-based, meaning that the update of the stop price occurs at the bar close instead of every tick.
While comparing the real-time results of the two implementations is like comparing apples to oranges, because they have different dynamic behavior, the new approach offers better consistency between the backtesting results and the real-time results.
By updating the stop price on every bar close, you do not rely on the backtester assumptions anymore (check the Reasoning section below for more info).
The new approach resembles the conditional "Trailing Exit" technique, where the condition is true when the current price crosses over the take profit target. Then, the stop order is placed at the trailing price and it gets updated on every bar close to "follow" the barrier price (high). On the other hand, the older tick-based approach had more "tight" dynamics since the trailing price gets updated on every tick leaving less room for price fluctuations by making it more probable to reach the trailing price.
🤔 Reasoning
This new close-based approach addresses several practical issues the older tick-based approach had. Those issues arise mainly from the technicalities of the TV Backtester. More specifically, due to the assumptions the Broker Emulator makes for the price action of the history bars, the backtesting results in the TV Backtester are exaggerated, and depending on the timeframe, the backtesting results look way better than they are in reality.
The effect above, and the inability to reason about the performance of a strategy separated people into two groups. Those who never use this feature, because they couldn't know for sure the actual effect it might have in their strategy, (even if it turned out to be more profitable) and those who abused this type of "repainting" behavior to show off, and hijack some boosts from the community by boasting about the "fake" results of their strategies.
Even if there are ways to evaluate the effectiveness of the tick-based approach that is applied in an existing strategy (this is out of the topic of this publication), it requires extra effort to do the analysis. Using this closed-based approach we can have more predictable results, without surprises.
⚠️ Caveats
Since this approach updates the trailing price on bar close, you must wait for at least one bar to close after the price crosses over the take profit target.

Crypto Realized Profits/Losses Extremes [AlgoAlpha]🌟🚀 Introducing the Crypto Realized Profits/Losses Extremes Indicator by AlgoAlpha 🚀🌟
Unlock the potential of cryptocurrency markets with our cutting-edge On-Chain Pine Script™ indicator, designed to highlight extreme realized profit and loss zones! 🎯📈
Key Features:
✨ Realized Profits/Losses Calculation: Uses real-time data from the blockchain to monitor profit and loss realization events.
📊 Multi-Crypto Compatibility: The Indicator is compatible on other Crypto tickers besides Bitcoin.
⚙️ Customizable Sensitivity: Adjust the look-back period, normalization period, and deviation thresholds to tailor the indicator to your trading style.
🎨 Visual Enhancements: Choose from a variety of colors for up and down trends, and toggle extreme profit/loss overlay for easy viewing.
🔔 Integrated Alerts: Set up alerts for high and extreme profit or loss conditions, helping you stay ahead of significant market movements.
🔍 How to Use:
🛠 Add the Indicator: Add the indicator to favorites. Customize settings like period lengths and deviation thresholds according to your needs.
📊 Market Analysis: Monitor the main oscillator and the bands to understand current profit and loss extremes in the market. When the oscillator is at the upper band, this means that the market is doing really well and traders/investors will be likely to take profit and cause a reversal. The opposite is true when the oscillator reaches the lower band. The main oscillator can also be used for trend analysis.
🔔 Set Alerts: Configure alerts to notify you when the market enters a zone of high profit or loss, or during trend changes, enabling timely decisions without constant monitoring.
How It Works:
The indicator calculates a normalized area under the RSI curve applied on on-chain data regarding the number of wallets in profit. It employs a custom "src" variable that aggregates data from the blockchain about profit and loss addresses, adapting to intraday or longer timeframes as needed. The main oscillator plots this normalized area, while the upper and lower bands are plotted based on a deviation metric to identify extreme conditions. Colored fills between these bands visually denote these zones. For interaction, the indicator plots bubbles for extreme profits or losses and provides optional bar coloring to reflect the current market trend.
🚀💹 Enjoy a comprehensive, customizable, and visually engaging tool that helps you stay ahead in the fast-paced crypto market!

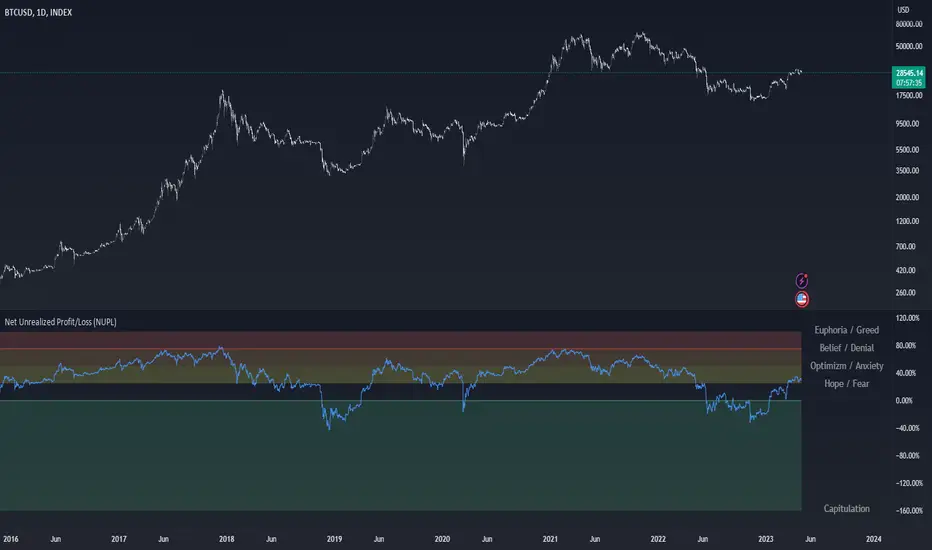
Net Unrealized Profit/Loss (NUPL)Indicator Overview
This indicator is derived from Market Value and Realized Value, which can be defined as:
Market Value: The current price of Bitcoin multiplied by the number of coins in circulation. This is like market cap in traditional markets i.e. share price multiplied by number of shares.
Realized Value: Rather than taking the current price of Bitcoin, Realized Value takes the price of each Bitcoin when it was last moved i.e. the last time it was sent from one wallet to another wallet. It then adds up all those individual prices and takes an average of them. It then multiplies that average price by the total number of coins in circulation.
By subtracting Realized Value from Market Value we calculate Unrealized Profit/Loss.
Unrealized Profit/Loss estimates the total paper profits/losses in Bitcoin held by investors. This is interesting to know but of greater value is identifying how this changes relatively over time.
To do this we can divide Unrealized Profit/Loss by Market Cap. This creates Net Unrealized Profit/Loss, sometimes referred to as NUPL, which is very useful to track investor sentiment over time for Bitcoin.
Relative Unrealised Profit/Loss is another name used for this analysis.
How To View The Chart
The key principle of this tool is in the ratio between market cap and Bitcoin investors taking profit.
When market cap rises much faster than profit taking we see that the market is overheating, one could say due to investor greed (red band). For the strategic investor such times have historically been favourable to take profit.
We can break down different percentages of Bitcoin Relative Unrealized Profit/Loss to determine what stage of the market we are in. This can be advantageous for the long term strategic investor.
Created By
Tamas Blummer, Tuur Demeester and Michiel Lescrauwaet
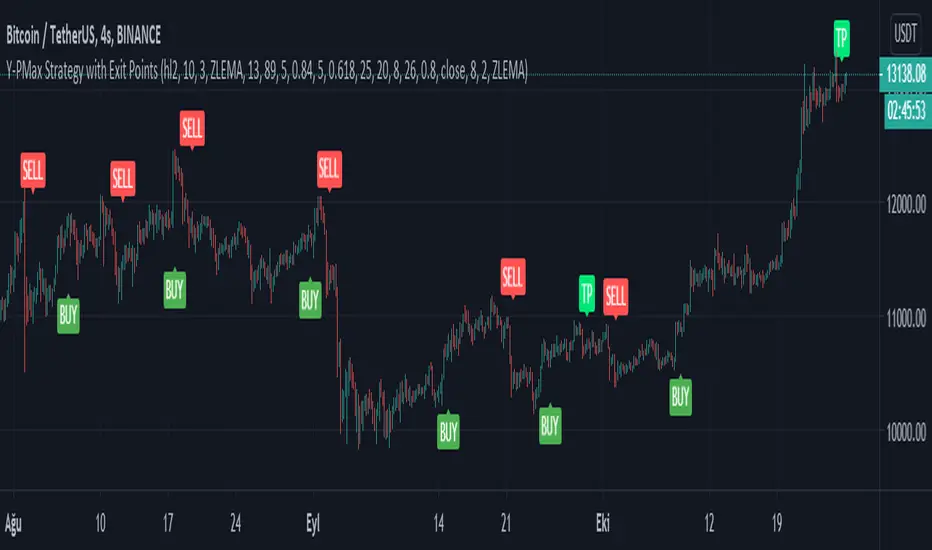
Y-Profit Maximizer Strategy with Exit PointsThis script based on KivancOzbilgic 's PMax indicator. I modified a bit. Added Filters, Exit (TP) Levels and few indicator in it. This script opening only Long Positions.
I have used this indicators in this strategy:
-Moving Stop Loss (Most) by ceyhun
-PMax Explorer STRATEGY & SCREENER
-Bollinger Bands on Macd
-Tillson T3 Moving Average by KIVANÇ fr3762
I am open to suggestions for improve this script.
PS: Script is in Turkish Language.
RSI on VWAP Upgraded strategyFirst of all, the idea of apply RSI to VWAP was inspired by XaviZ; at least, that where I first saw that.
I simply applied the idea and searched for apply this on lower timeframe (M15) to increase the number of positions and improve the profit factor.
The conditions to enter are the same :
long : enter on RSI crossover oversold level
short : enter on RSI crossunder oversell level
To close position, I found a little change to apply :
long : close position when RSI(VWAP) went in overbought zone and crossunder the overbought level OR after being at least x bars in the overbought zone (parameter is 28 by default) => when the first condition happens
short : close position when RSI(VWAP) went in oversold zone and crossover the oversold level OR after being at least x bars in the oversell zone (parameter is 28 by default) => when the first condition happens
With this change, I got better results specially on BTCUSDTPERP (M15) where I reach a 6.8 profit factor with 119 trades closed. Not BAD !
The defaults parameters are the best found for BTCUSDTPERP (M15), but the strategy works fine for other pairs if you take time to find the rights combinations.
In this strategy you can change (with defaults in () ):
RSI length (28)
RSI overbought level (85)
RSI oversell level (30)
Number of bars before leaving as explain above (28)
The choice to take longs only, shorts only or both
The number of coin/token by position
The start date for backtesting
Please note that the script use a pyramiding parameter of 3 (can be changed in the first line of the script); that means that you can take up to 3 positions before closing. It lets you improve average enter price but increase the risk. 3 is the best I found to improve profit factor without expose myself too much.
This script would be better if automated because of the conditions of buy and sell.
It's only for educative purpose, not an advice to invest.
All my free scripts here : fr.tradingview.com
Leave a message and don't forget to follow me ;) !

Two Take Profits and Two Stop LossThis script is for research purposes only. I am not a financial advisor.
Entry Condition
This strategy is based on two take profit targets, two stop loss, and scaling out strategy. The entry rule is very simple. Whenever the EMA crossover WMA, the long trade is taken and vice versa.
Take Profit and Stop Loss
The first take profit is set at 20 pips above the long entry and the second take profit is set at 40 pips above the long entry. Meanwhile, the first stop loss is set at 20 pips below the long entry and the second stop loss is set at the long entry.
Money Management
When the first take profit is achieved, half of the position is closed and the first stop loss is moved to the entry-level. The rest of the position is open to achieve either second take profit or second stop loss.
There are three outcomes when using this strategy. Let's say you enter the trade with 200 lot size and you are risking 2% of your equity.
1. The first outcome is when the price hits stop loss, you lose the entire 2%.
2. The second outcome is when the price hits the first take profit and you close half of your position. Meaning that you have gained 1%. Then you let the trade running and eventually it hits the second stop loss. Remember your first stop loss has changed to the second stop loss when the first take profit is achieved. The total loss is 0% because the price is at your entry-level. You have gained the earlier 1% and then lost 0%. At this point, you are at 1% gained.
3. The third outcome is similar to the second out but instead of hitting the second stop loss, the trade is running to your favor and hits the second take profit.
Therefore, you gained 1% from the first take profit and you gained another 2% for the second take profit. Your total gained is 3%
Summary
The reason behind this strategy is to minimize risk. with normal strategy, you only have two outcomes which are either win or loss. With this strategy, you have three outcomes which win 3%, win 1%, or loss 2%.
This is my similar strategy but with single stop loss

Renko Strategy Open_CloseSimple Renko strategy, very profitable. Thanks to vacalo69 for the idea.
Rules when the strategy opens order at market as follows:
- Buy when previous brick (-1) was bearish and previous brick (-2) was bearish too and actual brick close is bullish
- Sell when previous brick (-1) was bullish and previous brick (-2) was bullish too and actual brick close is bearish
Rules when the strategy send stop order are the same but this time a stop buy or stop sell is placed (better overall results).
Note that strategy open an order only after that condition is met, at the beginning of next candle, so the actual close is not the actual price.
Only input is the brick size multiplier for stop loss and take profit: SL and TP are placed at (brick size)x(multiplier) Or put it very high if you want startegy to close order on opposite signal.
Adjust brick size considering:
- Strategy works well if there are three or more consecutive bricks of same "color"
- Expected Profit
- Drawdown
- Time on trade
This strategy uses Renko charts with TRADITIONAL bricks, so no repaint.
Study with alerts, MT4 expert advisor and jforex automatic strategy are available at request.
Please use comment section for any feedback.

Futures Dollar Profit Target VisualizerFutures Profit Target Visualizer
A simple visual tool that shows exactly where price needs to go to hit your dollar profit target (and stop loss) — ideal for prop traders managing daily drawdown limits.
━━━━━━━━━━━━━━━━━━━━━━━━━━━━━━━━━━━━━━
HOW IT WORKS
Enter your target profit in dollars, and the indicator draws lines showing:
• Green line — Your take profit level
• Red line — Your stop loss level
• Blue line — Your entry (current price)
It auto-detects the futures contract you're viewing (NQ, ES, MNQ, MES, etc.) and calculates the correct point value automatically.
━━━━━━━━━━━━━━━━━━━━━━━━━━━━━━━━━━━━━━
WHY IT'S USEFUL FOR PROP TRADERS
If your prop firm allows a $500 daily drawdown and you want to risk $100 per trade with a 1:1 R:R, just enter:
• Target Profit: $100
• Risk:Reward: 1
The indicator instantly shows you the exact price levels — no mental math needed.
━━━━━━━━━━━━━━━━━━━━━━━━━━━━━━━━━━━━━━
KEY FEATURES
• Auto-detects contract type (NQ, ES, MNQ, MES, CL, GC, and more)
• Separate inputs for Mini and Micro contract quantities — switch between charts and it automatically uses the right position size
• Supports Long and Short trades
• Adjustable Risk:Reward ratio
• Labels show price, dollar amount, and points to target
• Lines are offset to the right so they don't affect chart auto-scaling
━━━━━━━━━━━━━━━━━━━━━━━━━━━━━━━━━━━━━━
SETTINGS
Profit Settings:
• Target Profit ($) — Your desired profit in dollars
• Risk:Reward Ratio — e.g., 1 = equal risk/reward, 2 = target is 2x your stop
• Mini Contracts — Position size when viewing mini contracts (NQ, ES, etc.)
• Micro Contracts — Position size when viewing micro contracts (MNQ, MES, etc.)
Trade Settings:
• Trade Direction — Long or Short
• Entry Price — Leave at 0 to use current price, or set a specific entry
Display:
• Show Price Labels — Toggle the price/profit labels
• Show Fill — Toggle the shaded zones between entry and target/stop
• Line Offset — Push lines further right (helps avoid auto-scale issues)
• Line Length — How long the lines extend
• Colors — Customize target, stop, and entry line colors
━━━━━━━━━━━━━━━━━━━━━━━━━━━━━━━━━━━━━━
SUPPORTED CONTRACTS
Equity Index: NQ, ES, YM, RTY + Micros (MNQ, MES, MYM, M2K)
Energy: CL, MCL, NG
Metals: GC, MGC, SI, SIL
Treasuries: ZB, ZN, ZF, ZT
Currencies: 6E, 6J, 6B, 6A, 6C
Ags: ZC, ZS, ZW
If your contract isn't listed, use "Custom" and enter the tick value manually.
━━━━━━━━━━━━━━━━━━━━━━━━━━━━━━━━━━━━━━
EXAMPLE
You trade MNQ with 5 contracts and want to make $100:
• Set Micro Contracts: 5
• Set Target Profit: $100
• MNQ = $2/point × 5 contracts = $10/point
• Indicator shows target 10 points above entry
Switch to NQ with 1 contract:
• Set Mini Contracts: 1
• Same $100 target
• NQ = $20/point × 1 contract = $20/point
• Indicator shows target 5 points above entry
No need to change settings when switching charts — it adjusts automatically.

Mean Reversion Pro Strategy [tradeviZion]Mean Reversion Pro Strategy : User Guide
A mean reversion trading strategy for daily timeframe trading.
Introduction
Mean Reversion Pro Strategy is a technical trading system that operates on the daily timeframe. The strategy uses a dual Simple Moving Average (SMA) system combined with price range analysis to identify potential trading opportunities. It can be used on major indices and other markets with sufficient liquidity.
The strategy includes:
Trading System
Fast SMA for entry/exit points (5, 10, 15, 20 periods)
Slow SMA for trend reference (100, 200 periods)
Price range analysis (20% threshold)
Position management rules
Visual Elements
Gradient color indicators
Three themes (Dark/Light/Custom)
ATR-based visuals
Signal zones
Status Table
Current position information
Basic performance metrics
Strategy parameters
Optional messages
📊 Strategy Settings
Main Settings
Trading Mode
Options: Long Only, Short Only, Both
Default: Long Only
Position Size: 10% of equity
Starting Capital: $20,000
Moving Averages
Fast SMA: 5, 10, 15, or 20 periods
Slow SMA: 100 or 200 periods
Default: Fast=5, Slow=100
🎯 Entry and Exit Rules
Long Entry Conditions
All conditions must be met:
Price below Fast SMA
Price below 20% of current bar's range
Price above Slow SMA
No existing position
Short Entry Conditions
All conditions must be met:
Price above Fast SMA
Price above 80% of current bar's range
Price below Slow SMA
No existing position
Exit Rules
Long Positions
Exit when price crosses above Fast SMA
No fixed take-profit levels
No stop-loss (mean reversion approach)
Short Positions
Exit when price crosses below Fast SMA
No fixed take-profit levels
No stop-loss (mean reversion approach)
💼 Risk Management
Position Sizing
Default: 10% of equity per trade
Initial capital: $20,000
Commission: 0.01%
Slippage: 2 points
Maximum one position at a time
Risk Control
Use daily timeframe only
Avoid trading during major news events
Consider market conditions
Monitor overall exposure
📊 Performance Dashboard
The strategy includes a comprehensive status table displaying:
Strategy Parameters
Current SMA settings
Trading direction
Fast/Slow SMA ratio
Current Status
Active position (Flat/Long/Short)
Current price with color coding
Position status indicators
Performance Metrics
Net Profit (USD and %)
Win Rate with color grading
Profit Factor with thresholds
Maximum Drawdown percentage
Average Trade value
📱 Alert Settings
Entry Alerts
Long Entry (Buy Signal)
Short Entry (Sell Signal)
Exit Alerts
Long Exit (Take Profit)
Short Exit (Take Profit)
Alert Message Format
Strategy name
Signal type and direction
Current price
Fast SMA value
Slow SMA value
💡 Usage Tips
Consider starting with Long Only mode
Begin with default settings
Keep track of your trades
Review results regularly
Adjust settings as needed
Follow your trading plan
⚠️ Disclaimer
This strategy is for educational and informational purposes only. It is not financial advice. Always:
Conduct your own research
Test thoroughly before live trading
Use proper risk management
Consider your trading goals
Monitor market conditions
Never risk more than you can afford to lose
📋 Release Notes
14 January 2025
Added New Fast & Slow SMA Options:
Fibonacci-based periods: 8, 13, 21, 144, 233, 377
Additional period: 50
Complete Fast SMA options now: 5, 8, 10, 13, 15, 20, 21, 34, 50
Complete Slow SMA options now: 100, 144, 200, 233, 377
Bug Fixes:
Fixed Maximum Drawdown calculation in the performance table
Now using strategy.max_drawdown_percent for accurate DD reporting
Previous version showed incorrect DD values
Performance metrics now accurately reflect trading results
Performance Note:
Strategy tested with Fast/Slow SMA 13/377
Test conducted with 10% equity risk allocation
Daily Timeframe
For Beginners - How to Modify SMA Levels:
Find this line in the code:
fastLength = input.int(title="Fast SMA Length", defval=5, options= )
To add a new Fast SMA period: Add the number to the options list, e.g.,
To remove a Fast SMA period: Remove the number from the options list
For Slow SMA, find:
slowLength = input.int(title="Slow SMA Length", defval=100, options= )
Modify the options list the same way
⚠️ Note: Keep the periods that make sense for your trading timeframe
💡 Tip: Test any new combinations thoroughly before live trading
"Trade with Discipline, Manage Risk, Stay Consistent" - tradeviZion

EMA Crossover Strategy with Take Profit and Candle HighlightingStrategy Overview:
This strategy is based on the Exponential Moving Averages (EMA), specifically the EMA 20 and EMA 50. It takes advantage of EMA crossovers to identify potential trend reversals and uses multiple take-profit levels and a stop-loss for risk management.
Key Components:
EMA Crossover Signals:
Buy Signal (Uptrend): A buy signal is generated when the EMA 20 crosses above the EMA 50, signaling the start of a potential uptrend.
Sell Signal (Downtrend): A sell signal is generated when the EMA 20 crosses below the EMA 50, signaling the start of a potential downtrend.
Take Profit Levels:
Once a buy or sell signal is triggered, the strategy calculates multiple take-profit levels based on the range of the previous candle. The user can define multipliers for each take-profit level.
Take Profit 1 (TP1): 50% of the previous candle's range above or below the entry price.
Take Profit 2 (TP2): 100% of the previous candle's range above or below the entry price.
Take Profit 3 (TP3): 150% of the previous candle's range above or below the entry price.
Take Profit 4 (TP4): 200% of the previous candle's range above or below the entry price.
These levels are adjusted dynamically based on the previous candle's high and low, so they adapt to changing market conditions.
Stop Loss:
A stop-loss is set to manage risk. The default stop-loss is 3% from the entry price, but this can be adjusted in the settings. The stop-loss is triggered if the price moves against the position by this amount.
Trend Direction Highlighting:
The strategy highlights the bars (candles) with colors:
Green bars indicate an uptrend (when EMA 20 crosses above EMA 50).
Red bars indicate a downtrend (when EMA 20 crosses below EMA 50).
These visual cues help users easily identify the market direction.
Strategy Entries and Exits:
Entries: The strategy enters a long (buy) position when the EMA 20 crosses above the EMA 50 and a short (sell) position when the EMA 20 crosses below the EMA 50.
Exits: The strategy exits the positions at any of the defined take-profit levels or the stop-loss. Multiple exit levels provide opportunities to take profit progressively as the price moves in the favorable direction.
Entry and Exit Conditions in Detail:
Buy Entry Condition (Uptrend):
A buy position is opened when EMA 20 crosses above EMA 50, signaling the start of an uptrend.
The strategy calculates take-profit levels above the entry price based on the previous bar's range (high-low) and the multipliers for TP1, TP2, TP3, and TP4.
Sell Entry Condition (Downtrend):
A sell position is opened when EMA 20 crosses below EMA 50, signaling the start of a downtrend.
The strategy calculates take-profit levels below the entry price, similarly based on the previous bar's range.
Exit Conditions:
Take Profit: The strategy attempts to exit the position at one of the take-profit levels (TP1, TP2, TP3, or TP4). If the price reaches any of these levels, the position is closed.
Stop Loss: The strategy also has a stop-loss set at a default value (3% below the entry for long trades, and 3% above for short trades). The stop-loss helps to protect the position from significant losses.
Backtesting and Performance Metrics:
The strategy can be backtested using TradingView's Strategy Tester. The results will show how the strategy would have performed historically, including key metrics like:
Net Profit
Max Drawdown
Win Rate
Profit Factor
Average Trade Duration
These performance metrics can help users assess the strategy's effectiveness over historical periods and optimize the input parameters (e.g., multipliers, stop-loss level).
Customization:
The strategy allows for the adjustment of several key input values via the settings panel:
Take Profit Multipliers: Users can customize the multipliers for each take-profit level (TP1, TP2, TP3, TP4).
Stop Loss Percentage: The user can also adjust the stop-loss percentage to a custom value.
EMA Periods: The default periods for the EMA 50 and EMA 20 are fixed, but they can be adjusted for different market conditions.
Pros of the Strategy:
EMA Crossover Strategy: A classic and well-known strategy used by traders to identify the start of new trends.
Multiple Take Profit Levels: By taking profits progressively at different levels, the strategy locks in gains as the price moves in favor of the position.
Clear Trend Identification: The use of green and red bars makes it visually easier to follow the market's direction.
Risk Management: The stop-loss and take-profit features help to manage risk and optimize profit-taking.
Cons of the Strategy:
Lagging Indicators: The strategy relies on EMAs, which are lagging indicators. This means that the strategy might enter trades after the trend has already started, leading to missed opportunities or less-than-ideal entry prices.
No Confirmation Indicators: The strategy purely depends on the crossover of two EMAs and does not use other confirming indicators (e.g., RSI, MACD), which might lead to false signals in volatile markets.
How to Use in Real-Time Trading:
Use for Backtesting: Initially, use this strategy in backtest mode to understand how it would have performed historically with your preferred settings.
Paper Trading: Once comfortable, you can use paper trading to test the strategy in real-time market conditions without risking real money.
Live Trading: After testing and optimizing the strategy, you can consider using it for live trading with proper risk management in place (e.g., starting with a small position size and adjusting parameters as needed).
Summary:
This strategy is designed to identify trend reversals using EMA crossovers, with customizable take-profit levels and a stop-loss to manage risk. It's well-suited for traders looking for a systematic way to enter and exit trades based on clear market signals, while also providing flexibility to adjust for different risk profiles and trading styles.

Innocent Heikin Ashi Ethereum StrategyHello there, im back!
If you are familiar with my previous scripts, this one will seem like the future's nostalgia!
Functionality:
As you can see, all candles are randomly colored. This has no deeper meaning, it should remind you to switch to Heikin Ashi. The Strategy works on standard candle stick charts, but should be used with Heikin Ashi to see the actual results. (Regular OHLC calculations are included.)
Same as in my previous scripts we import our PVSRA Data from @TradersReality open source Indicator.
With this data and the help of moving averages, we have got an edge in the market.
Signal Logic:
When a "violently green" candle appears (high buy volume + tick speed) above the 50 EMA indicates a change in trend and sudden higher prices. Depending on OHLC of the candle itself and volume, Take Profit and Stop Loss is calculated. (The price margin is the only adjustable setting). Additionally, to make this script as simple and easily useable as possible, all other adjustable variables have been already set to the best suitable value and the chart was kept plain, except for the actual entries and exits.
Basic Settings and Adjustables:
Main Input 1: TP and SL combined price range. (Double, Triple R:R equally.)
Trade Inputs: All standard trade size and contract settings for testing available.
Special Settings:
Checkbox 1: Calculate Signal in Heikin Ashi chart, including regular candle OHLC („Open, High, Low, Close“)
Checkbox 2/3: Calculate by order fill or every tick.
Checkbox 4: Possible to fill orders on bar close.
Timeframe and practical usage:
Made for the 5 Minute to 1 hour timeframe.
Literally ONLY works on Ethereum and more or less on Bitcoin.
EVERY other asset has absolute 0% profitability.
Have fun and share with your friends!
Thanks for using!
Example Chart:

Total Value and Profit for Multiple StocksThis Pine Script code example can be useful for traders and investors who want to monitor and analyze multiple stocks simultaneously on the TradingView platform. Here's a description of how the code can be used and what it is useful for:
1. **Monitoring Multiple Stocks:** The code allows users to input data for up to 10 different stocks, including stock symbols, purchase prices per share, and the number of shares they own. This makes it easy to monitor their portfolio of multiple stocks in one place.
2. **Total Value and Profit:** For each of the entered stocks, the code calculates the total value of the holdings (number of shares multiplied by the current price) and displays it as a label on the chart. It also calculates the profit (or loss) by subtracting the purchase price from the current price per share and multiplying it by the number of shares. This provides traders with a quick overview of how much money they have invested and how much they have earned or lost.
3. **Monitoring Daily Movements:** The code also displays information about the day's price movements, including the lowest and highest prices for the current trading session. It also calculates the price difference since the last closing, providing insight into how the stocks are performing compared to the previous trading day.
4. **Color Coding for Profit/Loss:** The labels displayed on the chart are color-coded. They appear in green if there's a profit and in red if there's a loss. This makes it easy to identify how each stock in the portfolio is performing.
5. **Quick Identification:** With this code, users can quickly identify and focus on the stocks that require attention. They can see which stocks are yielding profits and which are incurring losses, as well as get an overview of the entire portfolio at a glance.
In essence, this code provides traders and investors with the ability to monitor and analyze multiple stocks simultaneously, allowing them to make informed decisions about their portfolio's performance and any adjustments that may need to be made. It also offers a visual way to assess profit or loss for each stock, which can be valuable for risk management and strategy development.
