CRYPTO TRADING BOT - 1min SCALPING LONG/SHORTHOW IT WORKS
The core concept behind the script is the determination of the current market mood in sense of creating a trendline indicator using EMA / SMA .
By using this trend indication alongside RSI / MACD value range, we are able to enter/exit the market in both directions: LONG and SHORT .
In case of confirmed false signals, we try to catch up the next good opportunity to minimise loss and to close the current trade.
If the chance for a good countertrade is given at this point, the market is going to be entered reversely.
Should the market move incredibly fast against our trade direction, we use proven Stop-loss targets, to bring our children into safety.
As many others, we could tell you now, that we used state-of-the-art machine learning algorithms
as well as highly sophisticated methods to gain our results.
As a fact, we started with an idea, using simple and common trading tools/indicators,
as a solid ground. We did not want to reinvent the wheel and it paid off.
GET A WORKING SCRIPT
The algorithm we are using has initially been created with a self-developed backtesting software.
To be able to deliver gas to our engine, we have bought a huge amount of OHLCV data for the 1min chart.
After many exhausting and frustrating weeks of our workflow-rotation (develop, fail, fix, test, repeat)
we finally got confirmation for all of our conditions/expectations, so we translated our algorithm into pine-code.
THE RESULTS
Since we have been using our Pine-Strategy alongside our backtesting software , we checked all the results provided by TradingView
and our tool to be 100% sure every outcome, every entry and every exit is exactly the same.
We did this for several months and since 2021 June we have been using it with real Alerts, coped to our binance account.
Below, you will find how the performance for the previous months looked like (every trade was made with 100% of the capital, of course using proper stop loss and take profit):
September 2020: 15.18%
October 2020: 36.17%
November 2020: 15.12%
December 2020: 48.58%
January 2021: 150.10%
February 2021: 45.96%
March 2021: 46.48%
April 2021: 4.96%
May 2021: 43.48%
June 2021: -28.99%
Juli 2021: 15.63%
August 2021 (so far): 11.57%
Accumulated Profit: 1,979.01%
To prove our results, we will link an excel sheet for every trade that was made within this timerange.
Link: docs.google.com
ABOUT US
We are two good friends, both incredibly interested in mathematics, software engineering, AI and algorithmics. After getting introduced into the crypto space
by a common friend, we started figuring out that there is a pattern behind every big or small move which happens in an asset.
This is where the passion for creating a CRYPTO TRADING BOT began. It was our goal, to create this script for the 1min Timeframe, so the software can react quickly when a
big or small move is happening - this is why it is called a SCALPING SCRIPT .
We are incredibly proud of this script and would like to share it with this amazing community - just hit us up on TradingView!
Cerca negli script per "profit"

Sola Fide [Strategy]Sola Fide High Accuracy with ATR R:R
Indicators used:
- Stochastic RSI
- Chopiness Index
- RSI
- Ichimoku Cloud
- ATR
Script has been set up in strategy format to give backtesting data.
The strategy has been made for BTC and ETH pairs against USDT on the hourly timerframe
Currently outperforming the Buy and Hold Return on both assets.
This script has been made to make it easier to automate strategies on 3commas
In the settings you will see options for BTC strategy or ETH strategy
Choose the asset you are on, copy your 3commas Bot ID and Email token and paste them into the settings box for eachever asset you are on.
To receive the alerts set up within the strategy, in your alert message box use " {{strategy.order.alert_message}}"
This will then be able to send any orders taken on the tradingview script directly to your long or short bot on 3commas
This strategy is set up with a strict set of rules on the ATR for the Take profits and Losses.
There is a repaint warning because the code uses heikin ashi candles through the security function, the given entry and exit signals do not repaint,
I have been automating this for myself with no errors.
You don't need to use more than 3x leverage...
Past results do not guarentee future results.

StocasticRSI EMAs ATR StrategyA scalping based strategy thats works well with EUR/USD 30 minute time frame.
This strategy uses stochasticRSI for trade entry. Uses two exponential moving averages for trend detection. The strategy uses Average True Range for stop loss and for two profit targets.
We only trade with the trend if the 50 period exponential moving averages is above the 200 period exponential moving averages. StocasticRSI must cross below 30 level by default for a long entry if the rend is up. Likewise with a short entry the stochasticRSI must crossover above 70 level and if the trend is down.
This script does not trail your stop loss as I have noticed it does not give me good results. Stop loss is a fix stoploss based on Average True Range and so are the profit targets.
This script has risk management, it risk a certain percent of the inputed capital amount in the setting. See settings for more details.
Green line is 50 period exponential moving averages and red line is the the 200 period exponential moving average. Blue line is stoploss for short trade and black line stop loss for buy trade.
Since this is a scalping strategy be caution with the commission and slippage. I have inputed 1 for commission and 1 for sllipage.
Many Thanks,
Honest Trader

Trailing Take ProfitThis script demonstrates how to do trailing take profit. With this approach instead of setting a limit order, when you hit the target you just follow the price upwards (for long positions) and you sell when the price drops by a small percentage. This approach will increase the profits (slightly) in every strategy! Be aware that the simulated data may produce unrealistic results.
Scalping Strategy with SL and TP activation settingsThis strategy can be used on pretty much every timeframe that gives you a satisfying performance and will give you entries with a high probability of a winning trade.
Recommended are lower timeframes, because after all this is a scalping strategy and with that your chart wont be cluttered.
How to use this script?
Currently you can setup your positions SL and TP, because the markets vary in volatility it could improve the performance of the strategy.
You will simply get your signals and can decide to act upon them.
Stop loss: Simply your stop loss order which will trigger when price moves a given % away from your entry.
TP-Activation: When price reaches your % target it will trigger a stop limit order. So if price turns against your position after reaching your target it will close your position in profit and if it runs in your favoured direction it will trigger at a later stage.
Trailing-Offset-%: After reaching your % target it will trigger the TP order with an offset. So if you set your trailing offset to 0.1%, your TP order will be set behind 0.1 %. This can be used to test if the strategy would perform as well
if you leave more room for trades to play out.
Will this script make me profitable?
No strategy is a silver bullet and it depends mostly on you.
Trading is not easy and most people fail, because their risk management skills arent solid or they cant control their emotions.
This script will give you statistically often good entries, so even if you hit a losing streak your SL will protect you from losing more than necessary until you get a winning streak.
Patience and consistency is key to be profitable in the long run.
Does the script repaint?
Although you will get a notification when setting an alarm that the indicator may repaint, no security function is used and the signals will stay on the chart, because the signal is calculated based on the last candle close and will trigger with the next candle.
I am still looking into why that notification pops up.
You are free to try the indicator for a limited time to be sure.
My experience with the strategy
The overall statistical advantage is great. The strategy can be used simply as it is, but becomes better if you already have some experience with trading. Sometimes it will give you a good entry, reaches your target and the price still goes in your preferred direction. So your trading returns and experience could be improved with confluence, but it is totally fine as it is and if used right will help you get going.
Disclaimer: This is no financial advice. This is a tool and I am not responsible for your actions.
If you are interested in the indicator feel free to dm me on TradingView.

DMT 369 DRAGRONFLY STRATSuccessful traders trade with a fixed plan and without emotion, but this a lot harder than many new traders think. Many never master this skill and suffer continual drawdowns on their accounts as they overtrade high leverage positions in volatile markets.
ĐΜŦ Autobot resolves this issue by taking the human element out of the equation, allowing full automation of trades using TradingView alerts to trigger your favourite trading bot, such as Alertatron or 3Commas.
Being a Trend Reversal Indicator based on Volatility & Average True Range, ĐΜŦ Autobot is designed to identify spots in the market that offer suitable scalp and swing trade opportunities.
Due to popular demand we have expanded our ĐΜŦ Autobot product line to include the new ĐΜŦ Autobot Dragonfly 3-6-9 Edition which combines DMT with 3-6-9 Vortex mathematics, our Titan indicator and a multi-ladder scalping strategy to ensure you maintain a preferable average entry when price action moves against your position.
Indicator View
It its default state the DMT Autobot Dragonfly indicator displays key signal information, such as:
• Support & resistance range lines
• Titan Body Small & Large Time Frame lines
• Long & Short entry positions
• Long & Short position ladders
• Profit targets
Dragonfly displays a range between resistance (upper line) and support (lower line) on the chart.
Once the price is granted support in the range the lower line will turn green. As price action develops it will make repeated attempts to test support. If support holds price will attempt to test the resistance line (red).
When resistance is broken and the price is above the upper line, the line will turn blue confirming the bullish momentum and provide a potential buy opportunity.
Price action will make attempts to test the upper line as support and will keep rising while support is granted.
Once support is lost the upper line will become red once more. As price action develops it will make repeated attempts to test resistance. If resistance holds, the price will attempt to test the support line (green).
When support is broken and the price goes below the lower line, the line will turn red confirming the bearish momentum and provide a potential selling opportunity.
Price action will make attempts to test the lower line as resistance and will keep dropping while resistance is granted.
Titan Body
The Titan Body Small & Large time frame options in the indicator add additional trendlines to the chart to provide further clarity and confirmation to the Support & Resistance range indication.
Once price is granted support by the Small Time Frame trend line the line will turn green. As price action develops it will make repeated attempts to test the Small Time Frame support. Once the price is below the Small Time Frame trend line, the line will turn red and can act as resistance in a trend reversal.
When price is granted support by the Large Time Frame trend line the line will turn cyan. As price action develops it will make repeated attempts to test the Large Time Frame support. Once the price is below the Large Time Frame trend line, the line will turn orange and can act as resistance in a trend reversal.
The Titan Body enabled and customized in the indicator’s style settings,
Alert indicators
DMT Autobot Dragonfly Edition generates signals that can be used to scalp trade a volatile asset.
Signals are enabled and customized in the indicator’s input settings Additional options can be found in the options, but it is recommended that these are left at the default, as shown below. The indicator generates many
Entry and Profit levels can be disabled or customized in the indicator’s style settings,
Tradingview Alerts
Using Tradingview alerts, DMT Autobot Dragonfly signals can be used to trigger a trading bot.
To trigger a long or short position, set the Tradingview Alert Condition to DMT 369 Dragonfly and select the long or short option.
It is recommended that long or short positions are configured to trigger Once Per Bar Close
Ladders can also be triggered using alerts. To trigger a ladder order, set the Tradingview Alert Condition to DMT 369 Dragonfly and select the appropriate Long or Short ADD option that is to be triggered by the relevant values defined in the indicator’s configuration.
It is recommended that ladder orders are configured to trigger Once Per Bar,
To trigger a take profit order, set the Tradingview Alert Condition to DMT 369 Dragonfly and select the Long or Short TP option that is to be triggered by the relevant values defined in the indicator’s configuration.
Take profit orders can be configured as Once Per Bar Close or Once Per Minute.
If you wish to trigger a take profit signal immediately when the indicator’s defined take profit value is achieved, then use the Once Per Bar option.
Selecting Once Per Bar Close to generate a take profit signal is a gamble as the candle may close far away from the defined profit target – positive or negative.
While stops can be used, they are not applicable to the recommended ladder strategy.
Ladder Strategy
The DMT Autobot Dragonfly indicator always turns an underwater position into a win by utilizing a ladder strategy.
By using the recommended defaults, the indicator will trigger ladder orders at 3%, 6% & 9% using increasing order sizes,
Order sizes increase exponentially to ensure a good average price is maintained. If you are not using DMT Autobot Dragonfly signals to trigger ladder or take profit orders, please ensure your trading bot is configured to recalculate the new ladder entry and profit target based on the new average position entry price as each ladder is filled.
If you are using DMT Autobot Dragonfly on a leveraged asset, please ensure the leverage position is configured suitably so that your position is not liquidated if the price rapidly moves against you.
If u are looking for more information or access to the script please private msg me in trading view chat thx for support

[Strategy] - EMA 10,20 59 with Profit DisplayedThis EA is still under construction !!
So for this EA is only based on the trend of the 3 EMA's
Buytrend = (ema1 and ema2 > ema3) and (ema1 and ema2 > ema3 )
We also change the Background depending on the trend.
bgcolor(Buytrend ? color.green : color.red,transp=70)
At this point I was wondering how much "profit" we would have made if this strategy was only based on the trend so I added the Labels to start/end close of that trend and then see how much profit in pip's we would have made.
Later I was wondering if I could get the total information on the trades and thats what the Label over the current candle is telling us. If that label is red we didn't made any profit and if its green we made som profit.
I also added a BuyProfit and a count buy/sells and a total Profit to see how that information clearly without opening the strategy tester.
NOTE this shows the profit in pip's
Next step is to implement a Buy/Sell Signal togheter with a Buy/SellSignalOUT signal.
Thats currently under development and you'll see some code being there already but as of now the orders are made from the trend signal not the Buy/Sell Signal.

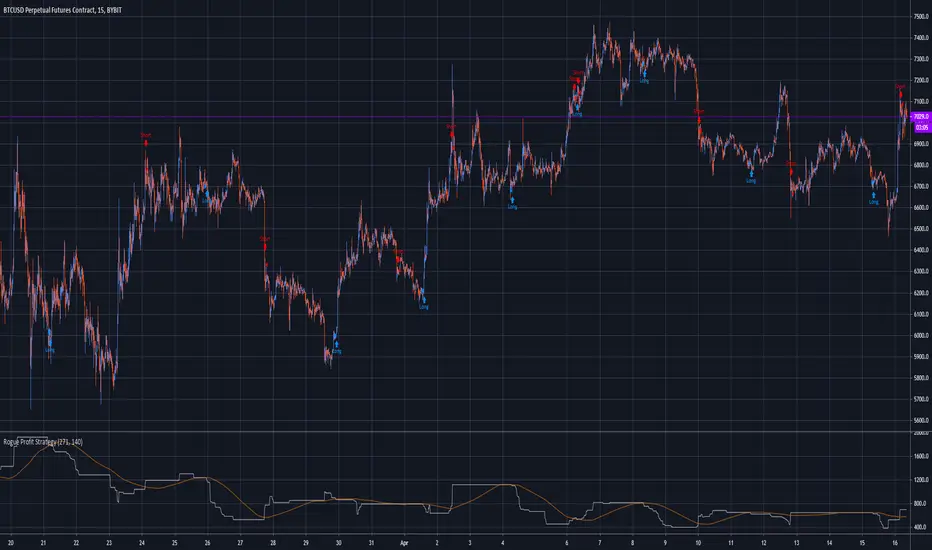
Rogue Profit StrategyThis is a complex script developed to measure specific volatility parameters and enter trades based on predetermined rules which are proprietary and will not be released, so don't ask for specific strategy settings.
The strategy keeps you in the market at all times either long or short. Parameters can be changed to better suit the asset your are trading, time frame and your particular trading style but the overall volatility rules for entering and exiting remain the same. It can be used to trade any asset but be aware the parameters you use for one asset, lets say Bitcoin, will not work with another asset like Forex. If the asset is on TradingView, you can use this indicator to trade it.
It is meant to trade pure price action candlesticks so do not use anything but a typical candlestick chart. You are going to have to put in some work and play around with the input parameters to make this strategy the most profitable for your trading style. Trading is hard but hopefully this strategy will help flatten the learning curve. This strategy is accompanied by an indicator study named "Rogue Profit Alert Indicator" that will work with setting alerts for manual or automated trading.
This strategy does NOT repaint.
This is a very powerful and profitable script that will simplify your trading and has been in development and tested for three years. Message for details on how to obtain access. Please allow up to 24 hours for a response.
Dominator Ladder StrategyThe Dominator is a technical indicator. Based on algorithm calculations, this indicator extrapolates the previous price for the next bar.
Here is how Dominator is calculated:
1. The study estimates the price projected for the next bar. The estimated price is based on the algorithm method.
2. The study extrapolates this value to find a projected price change for the next bar.
The resulting extrapolated value is shown as a histogram on a lower subgraph. By default, sections of the histogram where the extrapolated value is increasing are shown in green; sections corresponding to the decreasing value are shown in red.
Note: Value projection is purely mathematical as all calculations are based on algorithm averaging of previous values.
Note: lower subgraph it's just for you to understand and view the waves during the Strategy process Study it's not included in this strategy.
Overlay True
The strategy includes 3 different adjustable levels for the ladder , plus automatic adjustable stop loss and takes profit calculated from your average entry price after each ladder adds.
Adjustable BAcktest Window.
1 long signals
3 ladder long add signals
1 short signals
3 ladder short add signals
1 dynamic stop calculated from your average entry price
1 dynamic take profit calculated from your average entry price

MA cross strategyThis strategy uses simple moving average cross for entry signals, but it can be customized with 3 cases:
1- exit at take profit and stop loss;
2- exit when distance between close and moving average is above a user defined minimum;
3- use Renko candles to calculate the moving average without changing the graph candles.
The third case is the one with better results, but for non-pro users can be used only with daily time frame.
Look at profit factor and percent of winning trades.
You can test also on your favorite pair, but most important is setting correct brick size.
At request, I could share also a screener with alarms for finding which symbol statisfy entry rules.
Please use comment section for any feedback.
********************************** IMPORTANT*******************************
I have developed an expert advisor for metatrader4 (MT4): results of expert advisor form 2015-01-01 to today are very good with low drawdown and good profit.
********************************************************************************

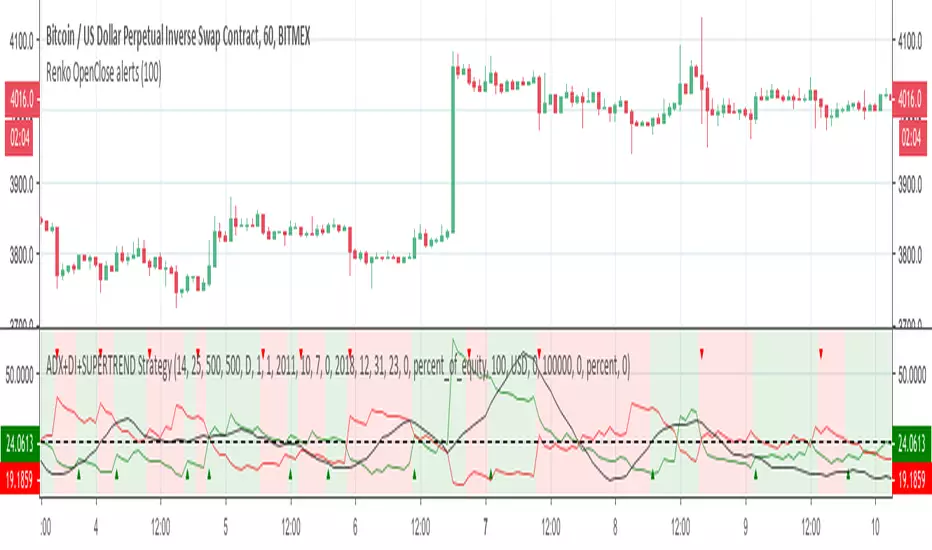
ADX+DI+SUPERTREND StrategyThis strategy is a port of famous script from MasaNakamura ADX and DI.
Here is the exact startegy from original study from MasaNakamura MasaNakamura at
In this version, I added also SUPERTREND as filter!
Scope of this port is to identify corrects inputs to get best results from signals that indicator gives.
I added the possibility to choose stop loss and take profits and to smooth the results also with heikin ashi candles.
Please use comment section for any feedback.
Next improvement (only to whom is interested to this script and follows me): study with alerts on multiple tickers all at one. Leave a comment if you want to have access to study.
********************************** IMPORTANT*******************************
I have developed an expert advisor for metatrader4 (MT4) and for jforex platform: results of expert advisor form 2015-01-01 to 2018-11-25 are very good with low drawdown and good profit.
********************************************************************************
ADX and DI StrategyThis strategy is a port of famous script from MasaNakamura ADX and DI
Original study from MasaNakamura MasaNakamura at
Scope of this port is to identify corrects inputs to get best results from signals that indicator gives.
I added the possibility to choose stop loss and take profits and to smooth the results also with heikin ashi candles.
Please use comment section for any feedback.
Next improvement (only to whom is interested to this script and follows me): study with alerts on multiple tickers all at one. Leave a comment if you want to have access to study.
********************************** IMPORTANT*******************************
I have developed an expert advisor for metatrader4 (MT4) and for jforex platform: results of expert advisor form 2015-01-01 to 2018-11-25 are very good with low drawdown and good profit.
********************************************************************************

Vix spread Betting/CFD strategy. Highest profit factor ever?Recently I have noticed that many CFD and spread betting providers (I wont mention which ones but they are easy to find with a quick google search) are letting users "trade" the CBOE Volatility Index ( VIX ). I thought this was unusual as the VIX is not a purchasable asset; it is a measure of implied volatility (both long and short) on the S&P500 calculated through a formula using the price of S&P options. As far as I know the VIX has never been directly tradeable until now, VIX related products like ETFs which attempt to follow the VIX has been available for nearly two decades however they suffer greatly from slippage which makes them difficult to trade.
I am astonished that we are now, for the first time, able to bet on the result of a formula. I think that CFD and spread betting providers have made a mistake, they were probably just looking to add more tradable products and didn't think through fully that the VIX is not like any of their other products, and is much easier to profit from when using a quantitative strategy.
This strategy works live on 4H and daily charts and achieves absolutely ridiculous results. I set it to start with $100 initial capital, and over the course of 465 trades it made $73154339495899.86 profit due to compounding profits. This is a profit factor of 695603.753. I don't expect to earn this much profit myself as I am sure that CFD and spread betting providers will eventually realize that it was a mistake to let traders have positions betting on the outcome of a formula, and eventually stop allowing VIX trades to be placed. I am currently trading using this algorithm, and will maybe let others use this script eventually after I've had my fun. So follow me :)

Simpelyfe Ichimoku TKx StrategyThe Simpelyfe Ichimoku TKx Strategy is a moving average crossover strategy with variable timed exit points. This strategy is quite versatile -- it can be used to scalp intraday trades or enter high probability/profitability trades on longer timeframes. It hits all the trending trades with minimal drawdown.
For access to this strategy, a negotiable one-time fee must be tendered. For more information, contact me personally through Trading View chat.
Happy trades!
-Sim

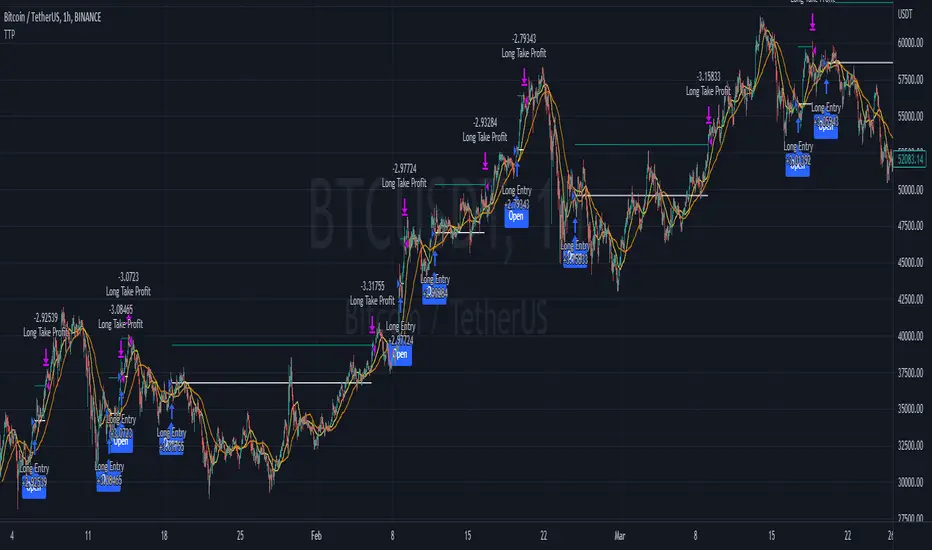
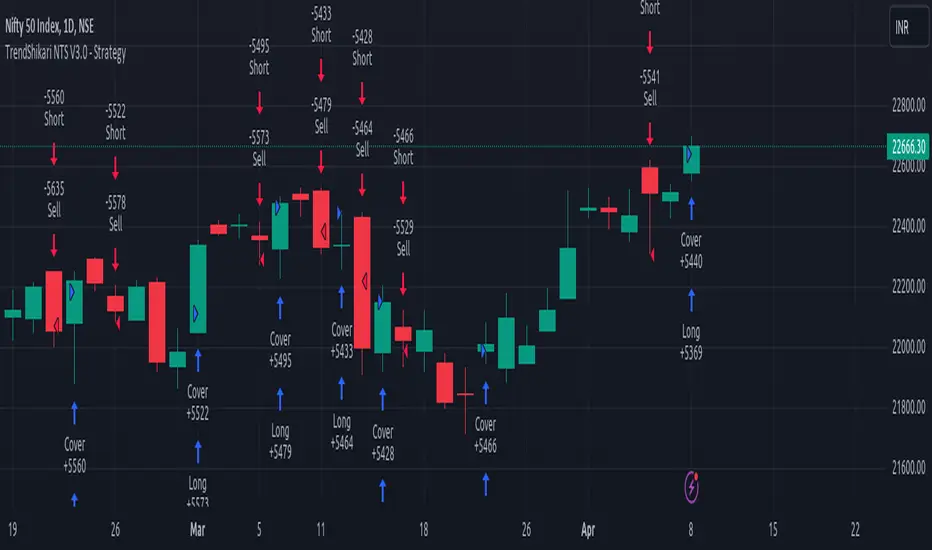
TrendShikari NTS - StrategyTrendShikari NTS is a Nifty Index, Swing trading system with great profitability. This is the STRATEGY file for you to see backtest performance along with the feature to see the next day trading levels in advance. For getting Email / SMA alerts (based on your TV subscription plan) and to see better graphic level marking use the STUDY file from the indicator library. Access to this system will be limited. See my profile status field to see how you can gain access.
Salient Features
1. Daily Bar System. System analyzes a Daily chart of NIFTY to give signals with average holding period of 5 days.
2. Automatic Long and Short signal generation. No need to draw waves / lines and other fancy stuff on your charts to analyze NIFTY any more.
3. Backtester Results Available - Thanks to TradingView, backtest results for previous years (from 1990) are available right in the charting platform for NIFTY.
Having a good trading system is one thing and trading it to make money is a whole different ball game. One thing you must always do if you want to mimic the backtest results in live trading is to follow the rules mentioned below as if your life depends on it.
Trading Rules
1. Each day the system gives you a Long and Short trading level. You go Long on NIFTY when the Daily Long level is breached and you go Short on NIFTY when the Daily Short Level is breached.
2. Trade using Nifty Options, In the Money calls, one strike below the nearest strike price for going Long using Call Option or one strike above the nearest strike price for going Short using Put Option.
3. Preset exit and entry orders of appropriate option contracts every day at market open. To set the levels see the difference in Nifty spot price and the trading levels given by system and then multiply it with 0.8 to give an approximate order trigger price in both directions for the corresponding option contracts.
4. Book profit when Nifty moves significantly along signal direction. Every time NIFTY moves 100 points in your direction you exit the current option contract and enter a trade in the next strike price in the same direction.
5. Rollover before expiry. Its important that you rollover (ideally one day before the expiry day) your Option contact positions by exiting the current month contract and take a new position in the next month contract of the same type and strike price of the current month contract.
6. Trade only Nifty using this system. Also Daily chart has to be used for trading. System parameters have been tested and optimized for Nifty Index Daily patterns only and hence is likely to give stated results with Nifty Daily chart only.
7. Trade all signals. Don't pick and choose or add your own or someone else's analysis to filter the signals. Take confidence from the objective backtest results and not any subjective interpretations.
8. Trade with only that amount of money you can afford to loose. Initial capital that you need to have to trade one lot of NIFTY Option using this system should be at least INR 150000. You need only INR 7500 - 15000 to open a position and the rest is the margin of safety you need to have in your trading account to account for drawdowns in trading. You can add the capital in a staggered need to basis to your trading account. But make sure you have the initial capital mentioned above at your disposal, if need be.
As always your thoughts and inputs are welcome. Happy Trading !!!
Vix FIX / StochRSI StrategyThis strategy is based off of Chris Moody's Vix Fix Indicator . I simply used his indicator and added some rules around it, specifically on entry and exits.
Rules :
Enter upon a filtered or aggressive entry
If there are multiple entry signals, allow pyramiding
Exit when there is Stochastic RSI crossover above 80
This works great on a number of stocks. I am keeping a list of stocks with decent Profit Factors and clean equity curves here .
Possible ways to use this:
Modify this script and setup alerts around the various entries
Use as is with different stocks or currency pairs
Modify entry / exit points to make it more profitable for even more symbols and currencies

How to automate this strategy for free using a chrome extension.Hey everyone,
Recently we developed a chrome extension for automating TradingView strategies using the alerts they provide. Initially we were charging a monthly fee for the extension, but we have now decided to make it FREE for everyone. So to display the power of automating strategies via TradingView, we figured we would also provide a profitable strategy along with the custom alert script and commands for the alerts so you can easily cut and paste to begin trading for profit while you sleep.
Step 1:
You are going to need to download the Chrome Extension called AutoView. You can get the extension for free by following this link: bit.ly ( I had to shorten the link as it contains Google and TV automatically converts it to a symbol)
Step 2: Go to your chrome extension page, and under the new extension you'll see a "settings" button. In the setting you will have to connect and give permission to the exchange 1broker allowing the extension to place your orders automatically when triggered by an alert.
Step 3: Setup the strategy and custom script for the alerts in TradingView. The attached script is the strategy, you can play with the settings yourself to try and get better numbers/performance if you please.
This following script is for the custom alerts:
//@version=2
study("4All-Alert", shorttitle="Alerts")
src = close
len = input(4, minval=1, title="Length")
up = rma(max(change(src), 0), len)
down = rma(-min(change(src), 0), len)
rsi = down == 0 ? 100 : up == 0 ? 0 : 100 - (100 / (1 + up / down))
rsin = input(5)
sn = 100 - rsin
ln = 0 + rsin
short = crossover(rsi, sn) ? 1 : 0
long = crossunder(rsi, ln) ? 1 : 0
plot(long, "Long", color=green)
plot(short, "Short", color=red)
Now that you have the extension installed, the custom strategy and alert scripts in place, you simply need to create the alerts.
To get the alerts to communicate with the extension properly, there is a specific syntax that you will need to put in the message of the alert. You can find more details about the syntax here : gist.github.com
For this specific strategy, I use the Alerts script, long/short greater than 0.9 on close.
In the message for a long place this as your message:
Long
c=order b=short
c=position b=short l=200 t=market
b=long q=0.01 l=200 t=market tp=13 sl=25
and for the short...
Short
c=order b=long
c=position b=long l=200 t=market
b=short q=0.01 l=200 t=market tp=13 sl=25
If you'll notice in my above messages, compared to the strategy my tp and sl (take profit and stop loss) vary by a few pips. This is to cover the market opens and spread on 1broker. You can change the tp and sl in the strategy to the above and see that the overall profit will not vary much at all.
I hope this all makes sense and it is enough to not only make some people money, but to show the power of coming up with your own strategy and automating it using TradingView alerts and the free Chrome Extension AutoView.
ps. I highly recommend upgrading your TradingView account so you have access to back testing and multiple alerts.
There is really no reason you won't cover the cost and then some on a monthly basis using the tools provided.
Best of luck and happy trading.
Note: The extension currently allows for automation on 2 exchanges; 1broker and Okcoin. If you do not have accounts there, we'd appreciate you signing up using our referral links.
www.okcoin.com
1broker.com

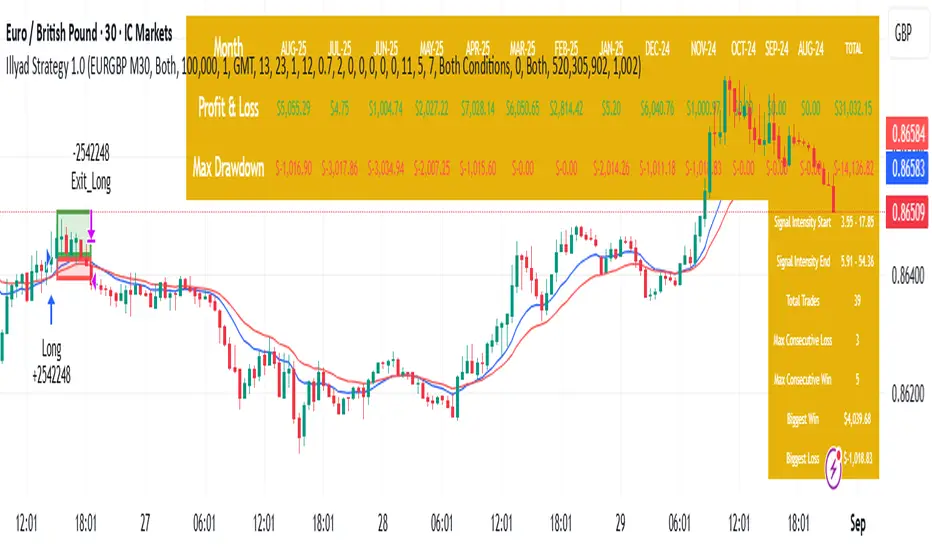
Optimised EURGBP (IC Markets, 30m)Illyad Strategy 1.0 – Optimised EURGBP (IC Markets, 30m)
Description:
This is the Illyad Strategy 1.0 optimised for EURGBP on the 30-minute timeframe (IC Markets feed).
📊 Results (Jan 2024 – Aug 2025):
✅ Total P&L: +£31,032.15 (+31.03%)
📉 Max Drawdown: 2.86% (£3,576.85)
🔁 Total Trades: 39
📈 Win Rate: 58.97%
⚖️ Profit Factor: 2.92
This strategy focuses on controlled drawdown + consistent growth, making it ideal for prop trading challenges and long-term account compounding.
🔧 Optimisation:
Works best on the 30m timeframe.
Each symbol behaves differently — for maximum performance, you should optimise the parameters (MAs, SL/TP, intensity) to the instrument you want to trade.
Example: The EURGBP setup shown here differs from what you’d use on NASDAQ, XAUUSD, or stocks like Tesla.
💡 Best Use Cases:
Passing and scaling prop firm accounts (FTMO, AquaFunded, etc.).
Automated alerts → MT5 integration (hands-free trading).
Consistent, rule-based trading without emotion.
⚠️ Disclaimer:
This script is for educational purposes only. Past results don’t guarantee future performance. Always backtest and forward-test on demo before live trading.
📲 Next Steps:
This version shows the EURGBP optimisation. If you want to run it on other pairs, indices, or stocks → simply optimise parameters for that symbol.
👉 For full automation (TradingView → MT5 execution), check my profile for details.
Timeshifter Triple Timeframe Strategy w/ SessionsOverview
The "Enhanced Timeshifter Triple Timeframe Strategy with Session Filtering" is a sophisticated trading strategy designed for the TradingView platform. It integrates multiple technical indicators across three different timeframes and allows traders to customize their trading Sessions. This strategy is ideal for traders who wish to leverage multi-timeframe analysis and session-based trading to enhance their trading decisions.
Features
Multi-Timeframe Analysis and direction:
Higher Timeframe: Set to a daily timeframe by default, providing a broader view of market trends.
Trading Timeframe: Automatically set to the current chart timeframe, ensuring alignment with the trader's primary analysis period.
Lower Timeframe: Set to a 15-minute timeframe by default, offering a granular view for precise entry and exit points.
Indicator Selection:
RMI (Relative Momentum Index): Combines RSI and MFI to gauge market momentum.
TWAP (Time Weighted Average Price): Provides an average price over a specified period, useful for identifying trends.
TEMA (Triple Exponential Moving Average): Reduces lag and smooths price data for trend identification.
DEMA (Double Exponential Moving Average): Similar to TEMA, it reduces lag and provides a smoother trend line.
MA (Moving Average): A simple moving average for basic trend analysis.
MFI (Money Flow Index): Measures the flow of money into and out of a security, useful for identifying overbought or oversold conditions.
VWMA (Volume Weighted Moving Average): Incorporates volume data into the moving average calculation.
PSAR (Parabolic SAR): Identifies potential reversals in price movement.
Session Filtering:
London Session: Trade during the London market hours (0800-1700 GMT+1).
New York Session: Trade during the New York market hours (0800-1700 GMT-5).
Tokyo Session: Trade during the Tokyo market hours (0900-1800 GMT+9).
Users can select one or multiple sessions to align trading with specific market hours.
Trade Direction:
Long: Only long trades are permitted.
Short: Only short trades are permitted.
Both: Both long and short trades are permitted, providing flexibility based on market conditions.
ADX Confirmation:
ADX (Average Directional Index): An optional filter to confirm the strength of a trend before entering a trade.
How to Use the Script
Setup:
Add the script to your TradingView chart.
Customize the input parameters according to your trading preferences and strategy requirements.
Indicator Selection:
Choose the primary indicator you wish to use for generating trading signals from the dropdown menu.
Enable or disable the ADX confirmation based on your preference for trend strength analysis.
Session Filtering:
Select the trading sessions you wish to trade in. You can choose one or multiple Sessions based on your trading strategy and market focus.
Trade Direction:
Set your preferred trade direction (Long, Short, or Both) to align with your market outlook and risk tolerance. You can use this feature to gauge the market and understand the possible directions.
Tips for Profitable and Safe Trading:
Recommended Timeframes Combination:
LT: 1m , CT: 5m, HT: 1H
LT: 1-5m , CT: 15m, HT: 4H
LT: 5-15m , CT: 4H, HT: 1W
Backtesting:
Always backtest the strategy on historical data to understand its performance under various market conditions.
Adjust the parameters based on backtesting results to optimize the strategy for your specific trading style.
Risk Management:
Use appropriate risk management techniques, such as setting stop-loss and take-profit levels, to protect your capital.
Avoid over-leveraging and ensure that you are trading within your risk tolerance.
Market Analysis:
Combine the script with other forms of market analysis, such as fundamental analysis or market sentiment, to make well-rounded trading decisions.
Stay informed about major economic events and news that could impact market volatility and trading sessions.
Continuous Monitoring:
Regularly monitor the strategy's performance and make adjustments as necessary.
Keep an eye on the results and settings for real-time statistics and ensure that the strategy aligns with current market conditions.
Education and Practice:
Continuously educate yourself on trading strategies and market dynamics.
Practice using the strategy in a demo account before applying it to live trading to gain confidence and understanding.

SwingTrade VWAP Strategy[TiamatCrypto]V1.1This Pine Script® code creates a trading strategy called "SwingTrade VWAP Strategy V1.1." This strategy incorporates various trading tools, such as VWAP (Volume Weighted Average Price), ADX (Average Directional Index), and volume signals. Below is an explanation of the components and logic within the script:
### Overview of Features
- **VWAP:** A volume-weighted moving average that assesses price trends relative to the VWAP level.
- **ADX:** A trend strength indicator that helps confirm the strength of bullish or bearish trends.
- **Volume Analysis:** Leverages volume data to gauge momentum and identify volume-weighted buy/sell conditions.
- **Dynamic Entry/Exit Signals:** Combines the above indicators to produce actionable buy/sell or exit signals.
- **Customizable Inputs:** Inputs for tuning parameters like VWAP period, ADX thresholds, and volume sensitivity.
---
### **Code Breakdown**
#### **Input Parameters**
The script begins by defining several user-configurable variables under groups. These include indicators' on/off switches (`showVWAP`, `enableADX`, `enableVolume`) and input parameters for VWAP, ADX thresholds, and volume sensitivity:
- **VWAP Period and Threshold:** Controls sensitivity for VWAP signal generation.
- **ADX Settings:** Allows users to configure the ADX period and strength threshold.
- **Volume Ratio:** Detects bullish/bearish conditions based on relative volume patterns.
---
#### **VWAP Calculation**
The script calculates VWAP using the formula:
\
Where `P` is the typical price (`(high + low + close)/3`) and `V` is the volume.
- It resets cumulative values (`sumPV` and `sumV`) at the start of each day.
- Delta percentage (`deltaPercent`) is calculated as the percentage difference between the close price and the VWAP.
---
#### **Indicators and Signals**
1. **VWAP Trend Signals:**
- Identifies bullish/bearish conditions based on price movement (`aboveVWAP`, `belowVWAP`) and whether the price is crossing the VWAP level (`crossingUp`, `crossingDown`).
- Also detects rising/falling delta changes based on the VWAP threshold.
2. **ADX Calculation:**
- Calculates the directional movement (`PlusDM`, `MinusDM`) and smoothed values for `PlusDI`, `MinusDI`, and `ADX`.
- Confirms strong bullish/bearish trends when ADX crosses the defined threshold.
3. **Volume-Based Signals:**
- Evaluates the ratio of bullish volume (when `close > VWAP`) to bearish volume (when `close < VWAP`) over a specified lookback period.
---
#### **Trade Signals**
The buy and sell signals are determined by combining conditions from the VWAP, ADX, and volume signals:
- **Buy Signal:** Triggered when price upward crossover VWAP, delta rises above the threshold, ADX indicates a strong bullish trend, and volume confirms bullish momentum.
- **Sell Signal:** Triggered under inverse conditions.
- Additionally, exit conditions (`exitLong` and `exitShort`) are based on VWAP crossovers combined with the reversal of delta values.
---
#### **Plotting and Display**
The strategy plots VWAP on the chart and adds signal markers for:
- **Buy/Long Entry:** Green triangle below bars.
- **Sell/Short Entry:** Red triangle above bars.
- **Exit Signals:** Lime or orange "X" shapes for exits from long/short positions.
- Additionally, optional text labels are displayed to indicate the type of signal.
---
#### **Trading Logic**
The script's trading logic executes as follows:
- **Entries:**
- Executes long trades when the `buySignal` condition is true.
- Executes short trades when the `sellSignal` condition is true.
- **Exits:**
- Closes long positions upon `exitLong` conditions.
- Closes short positions upon `exitShort` conditions.
- The strategy calculates profits and visualizes the trade entry, exit, and running profit within the chart.
---
#### **Alerts**
Alerts are set up to notify traders via custom signals for buy and sell trades.
---
### **Use Case**
This script is suitable for day traders, swing traders, or algorithmic traders who rely on confluence signals from VWAP, ADX, and volume momentum. Its modular structure (e.g., the ability to enable/disable specific indicators) makes it highly customizable for various trading styles and financial instruments.
#### **Customizability**
- Adjust VWAP, ADX, and volume sensitivity levels to fit unique market conditions or asset classes.
- Turn off specific criteria to focus only on VWAP or ADX signals if desired.
#### **Caution**
As with all trading strategies, this script should be used for backtesting and analysis before live implementation. It's essential to validate its performance on historical data while considering factors like slippage and transaction costs.

Project Monday Strategy [AlgoAI System]Overview
Project Monday is a sophisticated trading strategy designed for active market participants. This strategy can be used alongside other forms of technical analysis, providing traders with additional tools to enhance their market insights. While it offers a flexible approach for identifying and exploiting market inefficiencies, Project Monday does not fit every market condition and requires adjustments. Its core principles include technical analysis and risk management, all aimed at making informed trading decisions and managing risk effectively.
Features
Project Monday Strategy works in any market and includes many features:
Efficient Trading Presets: Offers ready-to-use presets that allow traders to start efficient trading with one click.
Confirmation Signals: Provides signals to help traders validate trends, emphasizing informed decision-making (not to be followed blindly).
Reversal Signals: Identifies signals to alert traders to potential reversals, encouraging careful analysis (not to be followed blindly).
Adaptability: Can be adjusted to fit different market conditions, ensuring ongoing effectiveness.
Multi-Market Application: Suitable for use across various asset classes including stocks, forex, commodities, and cryptocurrencies.
Integration: Can be used alongside other technical analysis tools for enhanced decision-making.
Position Sizing: Allows traders to determine optimal trade size using backtesting and trading performance dashboard.
Backtesting: Supports historical testing to refine and validate the strategy.
Continuous Monitoring: Includes features for ongoing performance evaluation and strategy adjustments.
Unique Project Monday Strategy Features on TradingView:
Adaptive Position Sizing: Dynamically adjusts the size of each position based on market conditions and predefined risk management criteria, ensuring optimal trade sizing and risk exposure.
Preliminary Position Opening: Allows traders to enter a position in anticipation of a signal confirmation, enabling them to capture early market movements and improve entry points.
Preliminary Position Closing: Enables traders to exit a position before a signal reversal, helping to lock in profits and minimize potential losses during volatile market conditions.
Adjusting Strategy Parameters:
Price Band Inputs:
Project Monday Strategy uses a set of configurable inputs to tailor its behavior according to the trader's preferences. The following are the key inputs for the price band calculations. Signals are not generated when the price remains within these bands.
“Length of Calculation” determines how many historical data points are used in the trend calculation. A shorter “Length of Calculation” will make the Price Band more responsive to recent price changes but may also increase the noise and the likelihood of false signals. A longer “Length of Calculation” will make the Price Band smoother, with less noise, but may cause more lag in reacting to price changes.
“Offset” determines the position of the Gaussian filter, which is used to weight the data points in the trend calculation. The offset is expressed as a fraction of the “Length of Calculation”, with a value between 0 and 1. A higher “Offset” will shift the Gaussian filter closer to the more recent data points, making the Price Band more responsive to recent price changes but potentially increasing noise. A lower “Offset” will shift the Gaussian filter closer to the centre of the window, resulting in a smoother Price Band but potentially introducing more lag.
“Sigma” refers to the standard deviation used in the Gaussian distribution function. This parameter determines the smoothness of the curve and the degree to which data points close to the centre of the “Length of Calculation” are weighted more heavily than those further away. A smaller “Sigma” will result in a narrower Gaussian filter, leading to a more responsive Price Band but with a higher chance of noise and false signals. A larger “Sigma” will result in a wider Gaussian filter, creating a smoother Price Band but with more lag.
Adjust the “Source” inputs to specify which type of price data should be used for strategy calculations and signal generation.
“Width of Band” input determines the multiplier for the band width. A higher value of “Width of Band” makes the price band wider, which generates fewer signals due to the lower probability of the price moving outside the band. Conversely, a lower multiplier makes the band narrower, generating more signals but also increasing the likelihood of false signals.
Direction input:
The Project Monday strategy includes an input to specify the direction of trades, allowing traders to control whether the strategy should consider long positions, short positions, or both. The following input parameter is used for this purpose:
This input parameter allows traders to define the type of positions the strategy will take. It has three options:
Only Long: The strategy will generate signals exclusively for buying or closing short positions, focusing on potential uptrends.
Only Short: The strategy will generate signals exclusively for selling or closing long positions, focusing on potential downtrends.
Both: The strategy will generate signals for both buying (long positions) and selling (short positions), allowing for a more comprehensive trading approach that captures opportunities in both rising and falling markets.
Signals Filter:
The Project Monday strategy includes inputs to filter signals based on higher timeframes and the length of the data used for filtering. These inputs help traders refine the strategy's performance by considering broader market trends and smoothing out short-term fluctuations.
Filter Timeframe input specifies the timeframe used for filtering signals. By choosing a higher timeframe, traders can filter out noise from shorter timeframes and focus on more significant trends. The options range from intraday minutes (e.g., 1, 5, 15 minutes) to daily (1D, 2D, etc.), weekly (1W, 2W, etc.), and monthly (1M) timeframes. This allows traders to align their strategy with their preferred trading horizon and market perspective.
Filter Length input defines the number of data points used for filtering signals on the selected timeframe. A longer filter length will smooth out the data more, helping to identify sustained trends and reduce the impact of short-term fluctuations. Conversely, a shorter filter length will make the filter more responsive to recent price changes, potentially generating more signals but also increasing sensitivity to market noise.
Adaptive Position Size:
The Project Monday strategy incorporates inputs for unique feature Adaptive Position Sizing (APS), which dynamically adjusts the size of trades based on market conditions and specified parameters. This feature helps optimize risk management and trading performance.
Enable Adaptive Position Size: Users can check or uncheck this box to enable or disable the Adaptive Position Size feature. When checked, the strategy dynamically adjusts position sizes based on the defined parameters. This allows traders to scale their positions according to market volatility and other factors, enhancing risk management and potentially improving returns. When unchecked, the strategy will not adjust position sizes adaptively, and positions will remain fixed as per other settings.
“Timeframe for Adaptive Position Size “input specifies the timeframe used for calculating the position size. Options range from intraday minutes (e.g., 30, 60 minutes) to daily (1D, 3D), weekly (1W), and monthly (1M) timeframes. Selecting an appropriate timeframe helps align position sizing calculations with the trader’s overall strategy and market perspective, ensuring that position sizes are adjusted based on relevant market data.
“APS Length” input defines the number of data points used to calculate the adaptive position size. A longer APS length will result in higher position sizes. Conversely, a shorter APS length will result in smaller position sizes.
Anticipatory Trading:
Project Monday Strategy includes inputs for unique feature Anticipatory Trading, allowing traders to open and close positions preliminarily based on certain conditions. This feature aims to provide an edge by taking action before traditional signals confirm.
Enable Preliminary Position Opening: Users can check or uncheck this box to enable or disable Preliminary Position Opening. When enabled, the strategy will open positions based on preliminary conditions before the standard signals are confirmed. This can help traders capitalize on early trend movements and potentially gain a better entry point.
Enable Preliminary Position Closing: Users can check or uncheck this box to enable or disable Preliminary Position Closing. When enabled, the strategy will close positions based on preliminary conditions before the standard exit signals are confirmed. This can help traders lock in profits or limit losses by exiting positions at the early signs of trend reversals.
“Position Size in %” input specifies the position size as a percentage of the trading capital. By setting this value, traders can control the amount of capital allocated to each trade. For example, a risk value of 40% means that 40% of the available trading capital will be used for each anticipatory trade. This helps in managing risk and ensuring that the position size aligns with the trader's risk tolerance and overall strategy.
Usage:
Signal Generation
Long signal indicates a potential uptrend, suggesting either buying or closing a short position. Short signal indicates a potential downtrend, suggesting either selling or closing a long position. Signals are generated on your chart when the price moves beyond a calculated price band based on the current trend.
Signal Filtering
The strategy includes a filtering mechanism based on the current or another timeframe. Filtering works best with higher timeframes. This component calculates the trend on a higher timeframe and predicts the trend, ensuring trades on the current timeframe are only opened if they align with the higher timeframe trend. Setting the right filter timeframe is crucial for obtaining the best signals.
Position Direction
Users can choose the direction of positions to open via the settings box. Options include only long positions, only short positions, or both.
Adaptive Position Size (APS)
Users can enable the Adaptive Position Size feature to adjust position sizes based on trend strength. The strategy evaluates the strength of the current trend based on a higher timeframe. The stronger the trend, the larger the position size for opening a position.
Anticipatory Trading
Users can activate this unique feature to enhance trading decisions. The strategy assesses the likelihood of receiving a main signal. If the opportunity appears strong, it opens a partial position, as specified in the settings box. As the probability of the signal strengthens, the strategy gradually increases the position size.
Exit Strategy
The strategy exits positions based on receiving a reverse signal. Positions opened through “Anticipatory trading” are exited incrementally as each preliminary signal reverses.
By following these steps, traders can implement the strategy to navigate various market scenarios, manage risk, and adjust trading performance over time. Adjusting parameters and monitoring signals diligently are key to adapting the strategy to individual trading styles and market conditions.
You will get
By purchasing the Project Monday strategy, you not only gain access to a cutting-edge system but also receive ready-to-use presets designed to help you start trading immediately and achieve optimal results. Additionally, you benefit from comprehensive support and the option to request custom presets for your desired financial instruments through our dedicated support team, ensuring you have the tools and assistance needed for successful trading.
Risk Disclaimer
This information is not a personalized investment recommendation, and the financial instruments or transactions mentioned in it may not be appropriate for your financial situation, investment objective(s), risk tolerance, and/or expected return. AlgoAI shall not be liable for any losses incurred in the event of transactions or investments in financial instruments mentioned in this information.

5 ema strategyThis Strategy is based of Subhashish Pani's (power of stocks) 5 EMA Strategy.strategy used for sell in 5 minutes and for buy in 15 minutes ..
Rules for this strategy ..
Sell signal -
1) if price is above 5 Ema and not touching Ema use as alert candle..
2) if price break low of alert candle strategy open trade ..
3) if price move more upside low of alert candle keep change into next candle ..
4) input we can select number of trade per day .as rule should take only 4 signal should execute
5) stop loss is fixed highest high of last 2 candle and take profit is input multiply of stop loss
buy signal-
1) if price is below 5 Ema and not touching Ema use as alert candle..
2) if price break high of alert candle strategy open trade ..
3) if price move more downside high of alert candle keep change into next candle ..
4) input we can select number of trade per day .as rule should take only 4 signal should execute
5) stop loss is fixed lowest low of last 2 candle and take profit is input multiply of stop loss
notes -input can be selected which side should take signal either buy or sell side ...number of trade can be adjusted ..
Disclaimer -Traders can use this script as a starting point for further customization or as a reference for developing their own trading strategies. It's important to note that past performance is not indicative of future results, and thorough testing and validation are recommended before deploying any trading strategy.

Inverse MACD + DMI Scalping with Volatility Stop (By Coinrule)This script is focused on shorting during downtrends and utilises two strength based indicators to provide confluence that the start of a short-term downtrend has occurred - catching the opportunity as soon as possible.
This script can work well on coins you are planning to hodl for long-term and works especially well whilst using an automated bot that can execute your trades for you. It allows you to hedge your investment by allocating a % of your coins to trade with, whilst not risking your entire holding. This mitigates unrealised losses from hodling as it provides additional cash from the profits made. You can then choose to hodl this cash, or use it to reinvest when the market reaches attractive buying levels.
Alternatively, you can use this when trading contracts on futures markets where there is no need to already own the underlying asset prior to shorting it.
ENTRY
The trading system uses the Momentum Average Convergence Divergence (MACD) indicator and the Directional Movement Index (DMI) indicator to confirm when the best time is for selling. Combining these two indicators prevents trading during uptrends and reduces the likelihood of getting stuck in a market with low volatility.
The MACD is a trend following momentum indicator and provides identification of short-term trend direction. In this variation it utilises the 12-period as the fast and 26-period as the slow length EMAs, with signal smoothing set at 9.
The DMI indicates what way price is trending and compares prior lows and highs with two lines drawn between each - the positive directional movement line (+DI) and the negative directional movement line (-DI). The trend can be interpreted by comparing the two lines and what line is greater. When the negative DMI is greater than the positive DMI, there are more chances that the asset is trading in a sustained downtrend, and vice versa.
The system will enter trades when two conditions are met:
1) The MACD histogram turns bearish.
2) When the negative DMI is greater than the positive DMI.
EXIT
The strategy comes with a fixed take profit combined with a volatility stop, which acts as a trailing stop to adapt to the trend's strength. Depending on your long-term confidence in the asset, you can edit the fixed take profit to be more conservative or aggressive.
The position is closed when:
Take-Profit Exit: +8% price decrease from entry price.
OR
Stop-Loss Exit: Price crosses above the volatility stop.
In general, this approach suits medium to long term strategies. The backtesting for this strategy begins on 1 April 2022 to 18 July 2022 in order to demonstrate its results in a bear market. Back testing it further from the beginning of 2022 onwards further also produces good returns.
Pairs that produce very strong results include SOLUSDT on the 45m timeframe, MATICUSDT on the 2h timeframe, and AVAUSDT on the 1h timeframe. Generally, the back testing suggests that it works best on the 45m/1h timeframe across most pairs.
A trading fee of 0.1% is also taken into account and is aligned to the base fee applied on Binance.
